JAIC 1985, Volume 24, Number 2, Article 5 (pp. 104 to 109)
THE DETECTION OF MORDANTS BY ENERGY
DISPERSIVE X-RAY SPECTROMETRY
N. Indictor, R.J. Koestler, & R. Sheryll
ABSTRACT—Twelve mordanted and cochineal dyed modern wool samples were subjected to scanning electron microscopy and energy dispersive X-ray spectrometry (SEM-EDS) analysis. The analyses for metallic elements matched in all cases those actually used in the preparation. The mordants detected contained the metallic elements: aluminum, chromium, copper, iron, and tin. SEM photomicrographs were also examined for the effects of
mordanting on fiber surfaces. Atomic absorption (AA) analysis of the samples is also reported.
1 INTRODUCTION
IN A PREVIOUS STUDY A GROUP of modern mordanted textile samples was subjected to SEM-EDS analyses to determine the feasibility of identifying mordants on museum textiles.1 Successful qualitative identification was achieved on silk, cotton, and wool for samples containing the elements aluminum, iron, copper, tin and chromium. Some problems that appeared in that study were the following: significant elements are present very nearly at the limits of detectability of our analytical system; iron sometimes appeared as a trace element even when not used as a mordant; and some analyses of
samples mordanted with chromium gave no indication of chromium; the same was true for tin but less frequently. Aside from the difficulties in obtaining unambiguous analyses for some samples, anticipated difficulties for museum and archaeological samples are foreseeable owing to loss of mordant during dyeing, washing, wear and aging that is certain to attend all historical samples. The presence of metallic elements from dust, dirt, soil, stains, treatment, etc., may also constitute a source of metallic elements that is not associated with the mordanting process requiring a cleaning or washing of the samples prior to analysis. Finally, not all mordants contain metallic elements2 and the
mordants free of metallic elements or elements lighter than sodium would not be detected by EDS.
2 EXPERIMENTAL
MATERIALS AND METHODS.4 Cochineal dyed wool samples were obtained from the Textile Conservation Dept., Metropolitan Museum of Art, New York. These samples were produced in a collaborative exercise during a 5-day workshop conducted by Fred Gerber in September 1978. The samples were stored on ragboard sheets in a bound sample book.
Although details are ambiguous, mordants were applied before dyeing. The following quantities of mordant were used per pound of wool yarn:
K2SO4AI2(SO4)3 ·24H2O, 4.0 oz; CuSO4 ·5H2O, 1.0 oz; FeSO4 ·7H2O, 1.0 oz; SnC12 ·2H2O, 0.5 oz; K2Cr2O7, 0.5 oz.
Mordants were dissolved in sufficient quantities of water to insure solution of mordants, heated, and the wool yarn was then added to the mordant solution. The yarn was left in the solution for some time depending on the mordants. Dried cochineal insect grains from the Canary Islands were mashed and added to warm water. After the dye was extracted into the water larger dye baths were prepared and the mordanted yarn was added and simmered (90–100°C) ca. 1 h. Different dye baths were used for each mordant. The dyed yarns were then rinsed in cold tap water and dried. Some of the mordant/dye solutions contained unspecified amounts of additives other than metallic mordants: cream of tartar, oxalic acid, sumac. The cochineal and the sumac were not purified or refined products but used as received. The sumac was field collected on the morning of use.
ANALYSES. The samples were prepared for scanning electron microscopy and examined in an AMRay 1600T with attached Kevex X-ray spectrometer system. Details of the treatment for analysis and the equipment used has been described previously.1 In addition, elemental dot mapping and
photomicrography were performed on the samples. For atmoic absorption analysis (AA), samples were submitted to Schwartzkopf Microanalytical Lab, Woodside, NY 11377.
3 RESULTS AND DISCUSSION
scans. The frequency with which the elements were observed is also given. As expected for wool samples sulfur is prominently present in each scan.
Elements other than those from the mordant may be picked up by the wool from the wash water or the non-uniform wool-mordant-dye-additive system.
Table I WOOL. Results of EDS Scans
Table II summarizes the mordants identified by EDS analysis. Samples 13 and 15 gave such small weight percentages (approx. 1%) of aluminum and iron in some EDS scans that they were reported as probably absent. Samples 20, 24, 25, 27 and 28A gave trace analyses for aluminum or iron (about 1–2%) in all EDS scans and are reported as possibly present. Samples 23A and 26 had aluminum (4–6%); samples 14 and 24 had copper (16–70%); samples 16 and 27 had iron (9–19%); samples 17 and 28A had tin (about 70%); samples 25 and 26 had chromium (17–32%). The decision to report the presence or absence of elements was based on the peak heights of these elements relative to that of sulfur, the element persistently present in all of the scans. “Yes” values were reported when EDS scans showed the mordant element to be always present in amounts greater than 2% relative to sulfur. Variation in weight percent relative to sulfur was often greater than 100% from scan to scan emphasising the already noted difficulty in using EDS analysis for quantitative assay. 1 The percentages indicated above represent only the weight percents of elements above the atomic weight of fluorine detected in an individual scan and not the weight percent present in the sample.
Table II Detection of Metal Elements on Cochineal Dyed Wool Samples by EDS
The reporting of absolute weight percents for the elements under discussion would require: preparation of known samples with controlled quantities of additives uniformily distributed on the sample; or an independant elemental microanalysis of the samples of levels greater than the 10% obtained by AA (see below). It would also be necessary to perform replicate scans to account for non-uniformity of the surface and non-uniform attachment of the additives.
Table III shows the mordants and additives used in the preparation of the samples of Table I. It is seen that all the mordants actually used were unambiguously detected (cf. Table II). The presence of traces of aluminum and iron in some of the EDS scans suggests a small problem. Continued experience and information concerning the context of samples will help the analyst to know when to disregard trace element values. In this connection the assistance of the curator or conservator cannot be overestimated. It should be noted that sample 26 had a double mordant (aluminum and chromium) and each was detected unambiguously. No difficulty at all was encountered in the detection of Sn or Cr (cf. ref. 1).
Table III Mordants and Additives Used for Cochineal Dyed Wool Samples
incorporated into the yarn. As expected from our previous study1 the quantity of mordant found in the dyed fabric is substantially less than the amount actually used except for the tin mordanted samples. The AA results suggest that a larger amount of tin compound was used than was reported in the experimental section. The data of Table IV also suggests that the process of dying after mordanting may produce a greater retention of mordant in the fiber than simply applying mordant. Previous studies showed retention of mordants to be approximately 10%.1 The entries under % Element by AA are replicates (since each mordant is applied according to the same recipe each time it is applied). It is seen that the values are excellent replicates in some cases but in other cases differences considerably exceed the experimental error of the analysis. One reason for the differences may be non-uniform sample preparation. The procedures for mordanting and dying maintained constant proportions among the ingredients but quantities of water were not measured in the mordant or dye baths or for the washing. The additives and impurities, furthermore, may have contributed differently to the partitioning of mordant between the textile and the aqueous phase. Another reason for the differences may be non-uniformity of the samples. Wool structure may vary considerably microscopically and macroscopically.5 Animal breed, treatment, processing, aging, differences in exposure to the environment, etc., all contribute to structural, mechanical and chemical variations in wool and its ability to interact with mordants, other additives, and impurities. Dot mapping scans of our samples indicated that the individual samples were quite uniform with respect to the metallic elements in the fiber surfaces.
Table IV Comparison of Mordant Quantities Applied to Cochineal Dyed Wool Samples with Quantities Analysed by AA
Each of the samples was examined by SEM photomicrography and the samples retained. Although not prepared with this investigation in mind, the samples examined in this study represent a good standard series since the same wool and dye were used throughout; the only difference in the samples should arise from the use of different mordants and/or additives. No clear-cut
distinctions in surface appearance could be made among the various
mordanted and dyed wool fibers. It is possible that surface characteristics of aged fibers provide a better indication of treatment.
The distribution of the mordant on fibers is an excellent subject for the elemental dot-mapping6 capabilities of SEM. Preliminary results indicate complete delocalization of elements without discernible pattern in the surfaces of the mordanted wool fibers. This result suggests that representative EDS results ought to be obtainable even with sample sizes as small as a single fiber.
4 CONCLUSIONS
1. The use of different mordants and additives in the cochineal dyeing of wool produced a wide variety of color.
mordanted with K2O4Al2(SO4)3 ·24H2O, FeSO4 ·7H2O, CuSO4 ·5H2O, SnCl2 ·2H2O and K2Cr2O7, and dyed with cochineal.
3. Some samples gave trace analyses in EDS scans for iron and aluminum (although not actually used in the mordanting procedure) but far less than when these elements were actually used in the mordanting procedure. The ratio of the weight percent, metallic element/sulfur, appears to provide a useful criterion for deciding whether or not a mordant has been applied to wool. The criterion may also be extended to the analysis of silk samples (see Part II).
4. Atomic absorption analyses confirm the presence of metallic elements in greater than trace quantities as detected by EDS scans. EDS scans indicating trace quantities of elements (Al and Fe) are also confirmed. 5. The presence or absence of mordants or additives could not be inferred
from differences in the appearance of fibers examined in this study by SEM photomicrographs.
BIBIOGRAPHY
Koestler, R.J., R.Sheryll and N.Indictor, “Identification of Dyeing Mordants and Related Substances on Textile Fibers: A Preliminary Study Using Energy Dispersive X-Ray Spectrometry,” Studies in Conservation (in press).
Matthews, J.M.Applications of Dyestuffs to Textiles, Paper, Leather and the Materials. Wiley, New York. 1920. p 168.
Gerber, F.H. “Cochineal and the Insect Dyes,” Ormand Beach, Florida. Nobuko Kajitani, Textile Conservation Department, Metropolitan Museum of Art, New York, provided the samples of dyed wool and described sample preparation.
Bergen, W.V.Ed.Wool Handbook. Interscience, NY.1963.
JAIC 1985, Volume 24, Number 2, Article 6 (pp. 110 to 115)
THE DETECTION OF METALLIC MORDANTS BY
ENERGY DISPERSIVE X-RAY SPECTROMETRY
R.J. Koestler, N. Indictor, & R. Sheryll
ABSTRACT—Thirteen silk fibers from seven different historical silk textiles were subjected to EDS analysis. The major metallic elements detected were aluminum, iron, calcium, silicon and potassium. No evidence for copper, chromium, tin or zinc was found. These results were compared to analyses of known mordanted silk samples.
1 INTRODUCTION
THE SCIENTIFIC AUTHENTICATION OF HISTORICAL material is a difficult and controversial process. It is impossible strictly speaking to prove the authenticity of any object based on technical information, although it is sometimes possible to find the chronological age of the material employed. The manufacture of the object can rarely be dated with absolute certainty or precision based solely on scientific observations, and the dating of both the material and the manufacture can never be proved since it is possible to imagine modern craftsmen with a knowledge of ancient technology. The darker side of this pursuit may have much clearer and straight-forward results: it is sometimes possible to prove that an object or material is other than it purports to be by the objective dating of the material or by discovery of a manufacturing procedure inconsistent with the purported age of the object. Sometimes documentation can date an object and place it unambiguously in its historical context. Most frequently it is necessary to come to a conclusion concerning authenticity by means of considerations from more than one discipline—stylistic analysis, historical documentation, elemental analysis, visual and microscopic examination—which, taken together, present a picture consistent with a particular time, place, workshop or worker. Reading all these cues to form a coherent and consistent picture is gradually becoming more and more difficult owing to the high level of specialization needed to master the several disciplines involved. The collaboration of scientists and art historians becomes especially necessary in problem areas where contradictory evidence and opinions give an ambiguous assessment.
The present day state of the art which would utilize high performance liquid chromatography (HPLC) or gas chromatography-mass spectrometry (GC-MS) combinations should give identifications of the dyes (permitting smaller samples than earlier studies) with the likelihood of a more complete structure identification.3 Carbon-14 dating gave results for the textiles sampled which proved to be uninterpretable, corresponding to neither the 20th century A.D. nor to the 11/12th century A.D. The present day state of the art for C-14 analysis permits analysis of much smaller samples with no larger uncertainty.4
A large sampling of different textiles should be submitted to several
laboratories. Finally, metallic mordants were not determined in these studies.
Fig. 1. (upper left). Fragment with equestrian King Falconer. Iran or Iraq, Abbasid Period, 9th C.A.D. The Cleveland Museum of Art, Purchase from the J.H. Wade Fund.
Fig. 3. (lower left). Fragment. Iran, Abbasid Period, 9th C.A.D. Cleveland Museum of Art, Purchase from the J.H. Wade Fund.
Fig. 4. (lower right). Fragment. Iran, Abbasid-early Buyid Period, early 10th C.A.D. Cleveland Museum of Art, Purchase from the J.H. Wade Fund.
In recent studies in our laboratory the feasibility of detecting mordants on textiles has been explored by exposure of small samples to the high energy electron beam of a scanning electron electron microscope (SEM) with
2 EXPERIMENTAL
SAMPLES WERE TAKEN FROM SEVEN textile fragments. Individual fibers were separated according to color. A single fiber of each color was carbon coated with approximately 15 nm of spectroscopically pure carbon in an Edwards vacuum evaporator and viewed in an Amray 1600T scanning electron microscope with a Kevex EDS spectrometry system. The collection conditions were: 20 kV; 200 seconds; area scanned was full fiber width at about 1–2000 magnifications. The samples were analysed as received, without washing or cleaning. Samples appeared to be clean and unsoiled.
3 RESULTS AND DISCUSSION
TABLE ILISTS THE TEXTILES AND ACQUISITION numbers of the silk textiles studied. The color of the fiber taken from each textile is also given and the elements found are shown in descending order of abundance. Each sample showed the presence of sulfur as would be expected from silk.6 The level of sulfur appears to be slightly lower than that found in modern undyed
mordanted samples examined in earlier studies5 with the exception of B-5-a and B-5-b. It is possible that this is the effect of aging (loss of sulfur) or the effect of dyeing or mordanting. The observed weight percent of any element will obviously decline in the presence of added matter. The weight percent in all samples reflects only weight percent of elements above the atomic weight of fluorine and not the weight present in the sample. The brown and gray fibers appeared to have significantly less sulfur than the other colored fibers. Lowered sulfur content of proteinaceous fibers has often been associated with aging.7Table I also indicates the presence, at least in trace amounts, of
aluminum and iron in all fibers except B-5-b, undyed.
Table I Historical Silks: Results of EDS Scans
presence of calcarious material associated with the surface of the textile. A group of mordanted (undyed) modern silks studied previously as standard also showed substantial calcium in EDS scans but approximately half the amount observed in the sample decribed here. The consistently high percentages of silicon in the scans indicates the presence of siliceous materials as well. The presence of iron and/or aluminum associated with the siliceous or calcarious material rather than as mordant cannot be excluded; nor the trace presence of aluminum and/or iron associated with some additive (e.g., sumac or tannin, as discussed at some length in ref. 1). It should also be added that sulfur as part of the proteinaceous backbone and sulfur as adventitious material (mordant, salt, soil, etc.) cannot be distinguished.
Table II Presence of Metallic Mordant on Historical Silks
The foregoing technical information illustrates some points made in the introduction. Authentication of the materials under discussion is not possible based on the data obtained. However none of the elements detected suggests a technology in the mordanting procedures at odds with analyses of other archaeological material.8 In order to demonstrate a late date for these textiles further analyses would be required. Since the technology is now available to do mordant analyses, dye analysis, and C-14 dating on micro-samples it would be a valuable contribution to the study of textile technology to continue this investigation.
We plan to enlarge our study of mordants on historical textiles; we are also planning a study of metallic yarns and weighted-silk fabrics.
4 CONCLUSIONS
1. Metallic elements detected on all colored silk fibers of the group of textiles studied were calcium, aluminum, iron, silicon, potassium. 2. Undyed silk showed the absence of aluminum and iron.
3. The metallic elements chromium, tin, copper, and zinc were absent from the silk fibers of the group of textiles studied.
4. Judgments as to the presence or absence of metallic elements as mordants were made by using sulfur as an internal standard.
5. This group of samples indicated a larger weight percent calcium than a group of modern undyed mordanted samples studied previously. 6. This group of samples indicated a lower weight percent sulfur than a
group of modern undyed mordanted samples studied previously. 7. The data obtained do not permit the dating of the textiles; but the
REFERENCES
Bulletin de Liaison du Centre International D'Etude des Textiles Anciens (Lyons). Nos. 37–40, 1973, 1974. Contributions by M. Lemberg; G. Vial; J.H. Hoffenck-De Graff; and D.G. Shepherd.
Irene Emery Roundtable on Museum Textiles, 1974, Proceedings
Archaeological Textiles. Ed.P.L.Fiske; D.G.Shepherd, “The Archaeology of the Buyid Textiles,” 175–190; N.Kajitani, “The Physical Characteristics of Silk Generally Classified as ‘Buyid’(10–13th Century A.D., Persia), 191–204. Washington, D.C., 1974.
Whiting, M.C., “Recent Advances in the Detection and Identification of Red and Yellow Dyes,” Dyes on Historical and Archaeological Textiles. 1st Mtg. York Arch. Trust (August 1982), p.2; DeWitte, E. and Terfve, A. “The Use of a PY-GC-MS Technique for the Analysis of Synthetic Resins,” Science and Technology in the Service of Conservators 1982 IIC Preprints, pp. 16–18. Washington, D.C., 1982.
Hall, E.T., R E.M.Hedges, J.O.Wand and N.R.White, “Radioactive Dating by Mass Spectrometry: Progress at Oxford,” Revue d'Archeometrie4, 51–58, (1980); Hewson, A.D., “Interpretation and Exploitation of an Interlaboratory Comparison of Radiocarbon Measurements,” Revue d'Archaeometrie, 4, 53– 72 (1980); Stenhouse, M.J. and M.S.Baxter, “An Assessment of the Current Role of Conventional Radiocarbon Dating Laboratories in Archeology,” Revue d'Archaeometrie, 4, 45–56 (1980).
Koestler, R.J., R.Sheryll and N.Indictor, “Identification of Dyeing Mordants and Related Substances on Textile Fibers: A Preliminary Study Using Energy Dispersive X-Ray Spectrometry,” Studies in Conservation (in press).
Stevens, M.P.Polymer Chemistry An Introduction. Addison-Wesley Reading, MA, 1975, p.417; data from Handbook of Commercial Polymers, The
Chemical Rubber Co., Cleveland, OH, 1971.
Baer, N.S., M.Delacorte and N.Indictor, “Chemical Investigations on Pre-Columbian Archaeological Textile Specimens” in Preservation of Paper and Textiles of Historic and Artistic Value, Adv. in Chem. Series 164, Wash., D.C., 1977, pp.261–271.
Masschelein-Kleiner, L and L.R.J.Maes, “Ancient Dyeing Techniques in Eastern Mediterranean Regions,” International Council of Museums Comm. for Conservation, 5th Council Mtg., Zagreb, 1978, 78/9/83.
ACKNOWLEDGEMENTS
JAIC 1979, Volume 19, Number 1, Article 3 (pp. 14 to 23)
IDENTIFICATION OF DYES ON OLD TEXTILES
Helmut Schweppe
ABSTRACT—A method for the differentiation of natural from synthetic dyes on textiles is discussed, and a simple method for the identification of natural dyes on old textiles is established. Identification is accomplished by the
preparation of lakes of the dyes and their color comparison with lakes of known dyes. Thin-layer chromatography for the identification of certain red dyes and yellow dyes is also discussed, and several examples of identification of unknown dyes are described.
1 INTRODUCTION
ONLY A FEW EXPERTS are capable of identifying dyes on old textiles, because most of the methods currently used require expensive apparatus, are time-consuming, and can be evaluated only by people with much experience, or because the necessary collection of authentic samples is not available. I wish to introduce here a method of analysis that is simple, quick, and cheap and is suitable for identifying the most important natural dyes on textiles. However, even this method cannot be carried out without making color comparisons, and I have therefore included a list of suppliers of natural dyes and books on dyeing with natural dyes (Appendices 1 and 2).
In contrast to methods previously known, I identify the natural dyes on the fibres, without taking them up into solution. Many of the natural dyes are mordant dyes, present on the fibre as insoluble lakes, for example aluminum lakes. In such cases one can form different lakes by boiling with aqueous solutions of tin, aluminum, iron, copper, or uranium salts, and then one obtains a series of lakes of different shades. By making comparisons with known dyeings it is very often possible to make an unambiguous identification of particular natural mordant dyes. This method of analysis is really based on the method of dyeing whereby the color is first developed on the fibre. This method of dyeing with mordant dyes is used when a metal salt is not suitable for direct mordanting of the fibre. For instance, one can dye wool mordanted with alum and then treat it with an aqueous solution of, say, copper sulfate, forming the copper lake on the fibre.
2 PRELIMINARY EXAMINATION
A SMALL SAMPLE of the colored fabric is first boiled in a 1% ammonia solution, in order to remove soil and finishes. Most natural dyes do not run when subjected to this treatment, since they are usually mordant dyes, that is to say they are present in the fabric as insoluble lakes. Indigo is also fast to dilute ammonia. Most of the earlier synthetic dyes made prior to the end of the 19th century run considerably. The same observation is made by textile restorers when they wash carpets with anionic surfactants in ammoniacal solution: if they see that no dye runs they draw conclusions about the presence of natural or synthetic dyes.
Prior to testing the fabric sample is washed with water and then with methanol, pressed between filter papers and set aside to dry.
A small piece of the cleaned dyeing is boiled successively with water, ethanol, glacial acetic acid, and a 20% ammonia solution.1 The material should be thoroughly rinsed in water before being transferred to the ammonia solution. The extents to which the various extracts are colored allow conclusions to be drawn about the types of dyes present. Synthetic acid and direct dyes are extracted by water and by ammonia solution. Synthetic basic dyes are extracted by ethanol and glacial acetic acid. Indigo (natural or synthetic) is extracted by glacial acetic acid.
Most of the natural dyes are extracted only slightly or not at all. There are a few exceptions however, one of which is provided by safflower, whose most
important color constituent is carthamic acid. The red carthamic acid loses its color irreversibly when boiled with ammonia, while the safflower yellow that accompanies it goes into solution without change in color. Indigo extract is also extracted to a considerable extent by boiling ammonia. This dye, which has been made by treating indigo with sulfuric acid since 1740, consists principally of indigo-disulfonic acid.
When a synthetic dye is believed to be present because the color is extracted by water and ammonia, or ethanol and glacial acetic acid, simple dyeing tests can be used to indicate whether it is an acid, basic or direct dye. The most strongly colored extract is evaporated to dryness and the residue is taken up in a little water. The solution is divided in two portions; one is acidified with acetic acid, and to part of the other (5 ml) a 5% sodium sulfate solution (1 ml) is added. The solutions are tested on wool and tannin-mordanted cotton.2 if the wool is stained more strongly by the acid solution than the cotton, an acid dye is present. If the cotton is dyed more strongly, a basic dye is present. A direct dye can be recognized by the fact that it easily goes onto unmordanted cotton from the neutral solution containing sodium sulfate.
ammonia extract is strongly colored and the color disappears when the extract is shaken with a little zinc powder at room temperature, the dye is an azo dye. If a few drops of concentrated sulfuric acid are poured over a small portion of a dyed fabric and observed for a few minutes, the acid may develop an intense color (red-violet, blue, or green); and if it does so, this is a certain indication of synthetic dye.
3 COLOR REACTIONS FOR THE IDENTIFICATION OF
NATURAL MORDANT DYES
THE PRINCIPLE of the reactions described here is that natural mordant dyes form lakes of various colors with tin, aluminum, iron, copper, and uranium. In addition, treatment of the tin lakes with 20% ammonia solution sometimes results in very striking color changes that can lead to the identification of certain dyes, such as orchil or sandalwood. The complete set of six colors is usually unique and provides a rapid and simple means for identifying many natural mordant dyes, provided of course that comparison sets obtained from authentic samples are available.
It is usual to form the tin lake first, since treatment with a strong solution of stannous chloride destroys the color of most acid and direct azo dyes and of acid metal-complex dyes, thus providing an additional indication that a synthetic dye is present.
The stannous chloride reagent is prepared by dissolving stannous chloride dihydrate (1 g) in concentrated hydrochloric acid (1 ml) and diluting with water (4 ml). The procedure is to take a small portion of the fabric that has been cleaned with dilute ammonia solution, boil it in the stannous chloride reagent, allow it to stand in the reagent for 10 minutes, wash it thoroughly with water (until the washings are neutral) and divide it into halves. Drying the treated material for this and the following tests can be assisted by washing it with methanol and then pressing it between filter papers. One half is dried and set aside for comparison purposes. The other half is treated with 20% ammonia solution.
The other lakes are formed similarly by treating four separated portions of the clean sample with 2% aqueous solutions of alum, ferrous sulfate, copper sulfate, and uranyl acetate. As in the formation of the tin lake, the solutions are boiled and then allowed to stand for 10 minutes before the material is washed with water.
4 YELLOW
FIGURE 1 shows the lakes formed by the yellow natural dyes that are most frequently encountered: weld extract, quercitron, Persian berries, old fustic, turmeric, and kalama. Shown are the colors of the aluminum, iron, copper, and uranium lakes of the dyes just mentioned, and also the colors of the tin lakes both before and after treatment with ammonia. In practice the dyes are usually in the form of the aluminum lake in the fabric, so that boiling with alum
solution seldom changes the yellow shade, except perhaps to brighten it through soil removal. The lakes whose colors differ distinctly from the others are
marked with a cross.
Fig. 1. Lakes of yellow natural dues.
Looking at Figure 1 one can see that only the tin lakes of quercitron and turmeric are orange. When the tin lake of turmeric is treated with ammonia it turns brown at first and then becomes yellow when washed with water. That of quercitron turns deep orange when heated with ammonia. These observations are sufficient to distinguish the two dyes from the other four. Old fustic and kamala both have orange-yellow tin lakes, but can be distinguished by the behavior of these lakes when treated with ammonia and also by the colors of their iron and copper lakes. Weld extract and Persian berries both have yellow tin lakes, but can be distinguished particularly by the behavior of these lakes when treated with ammonia and by the different colors of their copper lakes.
5 ORANGE AND BROWN
include young fustic (the most commonly-encountered orange natural dye), henna, annatto, walnut-shell, and cutch. Here too you can see that the colors of the individual lakes can be very different. Henna dyeings can be distinguished by the color of the iron lake, and annatto dyeings by the color of the uranium lake.
Fig. 2. Lakes of orange and brown natural dyes.
An important point to note about brown fabrics is that they are sometimes made from brown wool, and scarcely change color when treated with the various metal salts.
6 RED
Fig. 3. Lakes of red natural dyes.
7 BLACK
THE COLORS OF THE LAKES formed by the two natural black dyes logwood and tannin are shown in Figure 4. The two types of black can be distinguished unambiguously by treatment with stannous chloride. Logwood blacks change to violet, and the solution is colored an intense magenta. Tannin blacks lose their color when boiled with stannous chloride; the color is not restored on treatment with ammonia. They also lose their color when treated with 10% sulfuric acid.
8 MIXTURES OF NATURAL DYES AND INDIGO
IF THE FABRIC has a green or violet shade obtained by the use of natural dyes,and in the preliminary test a blue color is extracted by boiling glacial acetic acid, one should test for indigo by the method described by Hofenk-De Graaff (“A Simple Method for the Identification of Indigo,” Studies in Conservation, v. 19, [1974]: 54–5). If the result of the test is positive the indigo should be
removed from the fibre by repeated boiling with dimethylformamide until the solvent remains colorless. Once the indigo has been removed the yellow component (in green dyeings) or the red component (in violet dyings) is left behind and can be identified by forming the various colored lakes as described above.
color but extraction with dimethylformamide took out the indigo, leaving the red on the fibre. The colored lakes formed by the red dye matched those of the red obtained from wild madder (Rubia peregrina). It was confirmed by thin-layer chromatography that ordinary madder from Rubia tinctorum was not present, since only purpurin (1, 2, 4-trihydroxy-anthraquinone) was found: alizarin (1, 2-dihydroxyanthraquinone) was absent.
Fig. 4. Lakes of black natural dyes.
9 RAPID TEST FOR DISTINGUISHING AMONG MADDER,
COCHINEAL, AND KERMES
ONE TAKES A SMALL PORTION of the red dyeing, adds a few drops of concentrated sulfuric acid, and waits for a few minutes until the dye has colored the acid. Madder gives a dull red solution that fluoresces orange in ultraviolet light; cochineal (and lac dye) gives a magenta solution; kermes gives a dull red-violet solution. If a few milligrams of boric acid are then added to the sulfuric acid, color changes may be observed. If cochineal (or lac dye) is present the color changes to blue; if kermes is present the color changes to brownish-violet; if madder is present there is no change in color. If the solution is diluted with about ten times its volume of water and shaken with a little ether, madder and kermes go into the ether phase, coloring it orange; cochineal (and lac dye) remains in the aqueous phase but can be extracted with pentanol.
chromatography. The latter is the only simple way by which one can distinguish between cochineal and lac dye.
10 THIN-LAYER CHROMATOGRAPHY
THIN-LAYER CHROMATOGRAPHY can be carried out with minute samples, needs little apparatus, and is quick. If a natural dye contains several red-colored substances, thin-layer chromatography should be the method of choice. This is particularly true of identifying hydroxyflavone and
hydroxyanthraquinone dyes.
My experience has been that for the separation of natural dyes the best material for the stationary phase is polyamide powder. Figure 5 shows the
chromatograms of various yellow natural dyes of the hydroxyflavone class. Polyamide was used for the stationary phase, and the mobile phase consisted of a mixture of chloroform, methanol, butanone, and formic acid in the proportions by volume of 6:2:1:1. To show up the spots the chromatogram was sprayed with a solution of uranyl acetate. The chromatograms shown include those of old fustic, young fustic, weld, quercitron, Persian berries, and dyers' broom. the two natural dyes weld (no. 3) and dyers' broom (no. 6) contain luteolin as the
principal coloring material, and are included in the Color Index as Natural Yellow 2.
Figure 6 shows the chromatogram of natural red dyes containing
hydroxyanthraquinones. The stationary phase was polyamide but two different mobile phases were used. The chromatograms on the left were developed with a mixture of methanol and formic acid in the ratio 95:5, while those on the right were developed with a mixture of butanone, methanol, and formic acid in the proportions 65:30:5. Both sets of chromatograms include madder, wild madder, soranji (a type of Indian madder), cochineal, kermes, and lac dye. You can see that the first mobile phase madder and wild madder, and cochineal and lac dye can be differentiated.
Fig. 6. Thin-layer chromotography of red natural dyes.
that the dye used was Polish kermes, since this is the only dye containing both these acids.
Another example was the study of a piece of an old Ushak carpet said to have been made about 1600. The various dyes were identified by means of their colored lakes. The red was madder, the brownish-yellow weld, and the green was also shown to be weld after the material had been extracted with
dimethylformamide.
The results obtained by forming the colored lakes were confirmed by thin-layer chromatography. Chromatograms of the dyes from the red, yellow, and green knots showed clearly that the chromatogram of the red is identical with that of madder and that the yellow and the yellow component of the green agree with the chromatogram of weld.
A further case was furnished by the examination of a piece of a 19th century Kazak carpet with two shades of red, which we will call red 1 and red 2.
Red 1 was identified as a madder dye, while red 2 was an acid red azo dye. Boiling with dilute ammonia had almost no effect on red 1, only traces of red going into solution. Red 2 however could be almost quantitatively removed from the fibre with ammonia. Red 1 could be identified as madder by means of comparison of the colored lakes. Red 2 was found to be Crystal Ponceau 6R by color reactions and paper chromatography. This dye is listed in the Color Index as Acid Red 44, whose synthesis was discovered by Hoffmann in 1883. In this case the date of discovery of the synthetic dye showed clearly that the carpet was not made before 1883. The synthetic red was used all over the carpet for various ornaments, indicating that it was not just used for restoration work.
This last example in particular demonstrates that very useful results can be obtained without employing very elaborate equipment or methods.
APPENDIX
1 APPENDIX 1: SUPPLIERS OF NATURAL DYES/DRUGS
Paul Müggenburg, Drogen and Vegetabilien, Einfuhr- und Ausfuhrhandel, Wandalenweg 24, 2 Hamburg 1, West Germany
Petereit & Co., Medizinaldrogen, Import-Export, Groβhandlung Flamweg 132/134, Postfach 852, 22 Elmshorn bei Hamburg, West Germany
Hellmuth Carroux, Import-Export, Drogen-Talkum-Schwefel-Gummiharze-Schellack-Kernmehle, Neuer Wall 37, 2 Hamburg 36, West Germany C. E. Roeper, Fach-Importeur, Drogen-Harze-Quellstoffe, Klosterallee 74, 2 Hamburg 13, West Germany
Compagnie Française des Extraits Maison Westphalen, B.P. 1375, 20, Rue de Pressence, 76 Le Havre, France
2 APPENDIX 2: BOOKS ON COLORING WITH NATURAL
DYES
Natural Dyes and Home Dyeing (formerly titled: Natural Dyes in the United States). A practical guide with over 150 recipes. By Rita J. Adrosko. Dover Publications, Inc., 180 Varick Street, New York, N.Y. 10014, (1971). Natural Dyes. By Sallie Pease Kierstead. Boston Branden Press Publishers (1972).
Dyes from Plants. By Seonaid M. Robertson. Van Nostrand Reinhold Company, New York-Cincinnati-Toronto-London-Melbourne (1973).
Wir färben mit Pflanzen. Tagebuch eines Färbelehrganges mit Beiträgen von Irmgard Becker-Kutscher. Von Kurt Hentschel. WEBE MIT-Verlag, D-7065 Winterbach-Manolzweiler, West Germany (1977).
Färbbuch. Grundlagen der Pflanzenfärberei auf Wolle. Von Emil Spränger. Eugen Rentsch Verlag, Erlenbach-Zürich, Switzerland (1969).
Farben aus der Natur. Eine Sammlung alter und neuer Farbrezepte für das Färben auf Wolle, Seide, Baumwolle und Leinen. Von Gretel Fieler. Verlag M. & H. Schaper, 3 Hannover, West Germany (1978).
NOTES
1. The 20% ammonia solution can be replaced by 25% ammonia solution (d = 0.91), which is the solution usually supplied commercially.
JAIC 1987, Volume 26, Number 1, Article 3 (pp. 27 to 44)
FIBER IDENTIFICATION IN PRACTICE
Martha Goodway
ABSTRACT—Brief case studies of the problems in identification of a wide variety of ethnographic and archaeological fibers are given. The strategy of identification varied with the purpose (choice of treatment, assessment of damage or
identification of its cause, or authentication) but most of all with the condition of the fibers. Fibers from ethnographic or archaeological sources tend to be aged, and are sometimes fragmentary or decayed, fossilized or charred. With fibers in such condition, the simpler methods of preparation for microscopic observation were found more successful than the classical biological methods of soaking, clearing and staining.Not all fibers could be identified. Fur fibers from characteristic areas of the pelt were usually diagnostic as to species as well as to genus. Vegetable fibers were often not mophologically specific to species. Unless “guide elements” were present, or special limitations on species distribution were known, the identification of the genus of a vegetable fiber was often the best that could be done. Instructions for an optical test for flax, and a report form for the observation of fur and wool fibers, are included.The identification of fibers in archaeological and ethnographic objects in practice is a great deal more difficult than the texts on fiber identification lead one to believe. For example, the solubility tests which are a mainstay of synthetic fiber identification are of no use since archaeological and ethnographic fibers are natural ones. The various chloroiodine stains, Herzberg's and others which stain cellulose red, violet or blue and ligno-cellulose yellow, seldom act on old and dessicated fiber unless at nodes or points of fracture. These and many other methods recommended for use with textile fiber identification often give equivocal results when applied to archaeological or ethnographic material.Experience has shown that complicated and lengthy preparation procedures do not repay the time and effort they require and, more importantly, often fail altogether. Perhaps the single most useful generalization that can be made about archaeological and ethnographic fiber identification is that not all fibers can be identified on the basis of the information we now have. Nevertheless, a surprising number of these fibers can be identified, or at least classified, by microscopical observation and a few simple tests. The following examples may suggest useful approaches in dealing with material of this sort.
IN PRACTICE, THE FIRST STEP in identification of natural fiber was to classify it by material, whether of animal or vegetable origin. To differentiate between cellulose and protein fiber where this was not obvious, an ash test detected protein by the characteristically nitrogenous odor of burnt hair. If it was not protein then the twist test quickly differentiated right-hand vegetable fibers such as flax and ramie, from the left-hand fibers such as hemp, jute, and most ethnographic fibers. Right-hand fibers were also distinguished from left-Right-hand fibers microscopically, by a method described in the Appendix.
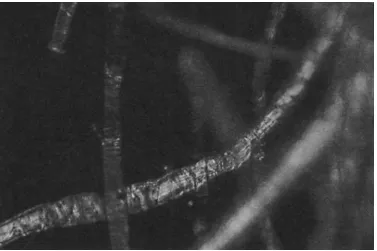
direction it rotated upon drying could be clearly observed. Flax, a right-hand fiber, was used as a comparison standard in these tests so as to establish the direction of rotation. Flax rotated swiftly on drying, but the left-hand fibers were often more subtle. If not repeated several times, the test could be misleading. An example of this occurred in examination of a pulley rope from the sunken warship Tecumseh, in which a red marking thread was found. The naturally colored fibers of the rope consistently gave a slow but distinct left rotation on drying, confirming their microscopical identification as manila hemp. The red-colored fibers, repeatedly wetted and dryed, gave contradictory results. When this fiber was also examined microscopically (Figure 1) it was obviously cotton. Cotton, a seed hair, has the form of a collapsed hollow tube. It collapses randomly, with a right-hand twist in one short section followed by a left-hand twist in another; this randomness of twist was faithfully reflected in the contradictory results of the twist test.
Fig. 1. Collapsed-tube morphology and random twist characteristic of cotton fiber. 500x, 70° cross polars.
With natural fibers, microscopy was the method of choice for identification because the morphology of these fibers can be distinctive. Unfortunately, the differences in morphology among some species are not always sufficiently distinctive to allow precise identification since nature tends to use the same repertoire of cells in constructing the fibers of different plants.
In mounting a fiber for microscopical observation, care was taken that adventitious material—such as cotton from clothing, or processed wood fibers from tissue— were not embedded with the sample in the preparation. Most fibers from objects already bore a large amount of extraneous material, which was distracting and could be misleading. It was also possible for an entire sample to consist of adventitious material. For example, a long, black animal fiber which had come from a cave being excavated proved to be a bristle from a brush used as a tool in excavation.
convenient method of enhancing contrast at the surface of the fiber. Some degree of contrast is essential so that surface detail becomes visible. These high-index media contain nasal irritants and when heated the vapours should not be inhaled, in addition to observing the rules for the use of PCBs imposed by the Environmental Protection Agency.
The most usual stem or bast fiber encountered was flax. Since linen was in common use before the spread of cotton, its identity is sometimes useful in problems of dating. In one such case a conservator was interested in the date of a repair to the joint of an 18th-century harpsichord stand, where a piece of cloth had been used as a filler. Flax fiber was identified, and the use of linen indicated to him, along with other observations, that he was dealing with an early repair. In another case, the presence of flax was useful in establishing the late date of a Plains Indian ceremonial object.
When fresh, stem fibers were generally more flexible than the fiber from leaves (hard fiber). Most vegetable fiber samples examined were left-handed. Of the commercial stem fibers, only flax and ramie are right-hand fibers. An optical method for determining the direction of the cellulose, whether it is right or left handed, mentioned by Luniak1 proved to be particularly useful, in addition to the observation of a fine lumen visible at the center and the cross hatchings called nodes, in identifying flax. See Plates 1–3 and the Appendix on the red plate test for details of this method.
Fig. . Red plate test of flax. Note the yellow color of the vertical fibre. 165x, 90° crossed polars, first order red compensator plate in 45° position.
Fig. . Red plate test of flax. Yellow fibre of plate 2 rotated 90° to horizontal position. Note blue color. 500x, 90° crossed polars and red plate.
over indentations in silk fibers also gave a characteristic silhouette to silk (Figure 4)
in addition to its triangular cross section.
Fig. 2. Partial fractures in silk fiber, indicating brittleness. Green-stick fracture is characteristic of silk. Crossover indentation in lower fiber. 500x, 73° crossed polars.
Fig. 4. A pair of crossover indentations characteristic of silk. 500x.
It is from such characteristic silhouettes that it was possible to classify fibers, if not always to identify them precisely, when they were charred or fossilized. Once charred, a fiber transmits no light, so only silhouette and size remained to be observed. It became routine to measure the width of every fiber as a check on tentative identifications. This dimension was included in all reports of
microscopical observations, however brief.
If the material was a bast or leaf fiber, but not flax, there was a more difficult problem of identification and not one that could be solved in every case. These fibers could be particularly featureless. In such a case what in English are called “guide elements,” from the German “Leitelemente,” were searched for. These associated structures, such as parenchymatous cells or so-called baggy cells in tula ixtle, spiral vessels in sisal and some other agaves (Figure 5), stem hairs in esparto
Fig. 5. Spiral vessels characteristic of sisal and other agaves. These occurred in Tula ixtle. An example of a “guide element.” 200x.
Fig. 6. Stem hairs characteristic of exparto, shown here in cross section. Another example of a “guide element.” 325x.
Cross-sections adequate for identification were prepared quite successfully without a microtome using equipment no more elaborate than cork, a C-clamp, and a razor blade. In practice a smooth, featureless area of the cork was chosen and the fibers were clamped between two pieces. Thin slices containing the fibers were then carefully shaved off. Sometimes this procedure was made easier if the fibers were glued to the cork first. The mounting medium itself was used as the glue. Hand-sectioning succeeded even with a single fiber of less than 15 μm diameter (Figure 7a and b). In most cases cross sections were not required because the cross section could be inferred by slowly focusing up and down upon the fiber at fairly high powers. This “optical sectioning” was a quicker and much less tedious procedure than cutting cross sections.
those of coir or of cotton. When applied to these separated cells, the red plate test also was not particularly informative. So-called “clearing” of thick vegetable fibers in methyl salicylate did render them more nearly transparent for microscopical observation, and was compatible with the Aroclors, for which methyl salicylate is a solvent.
Ethnographic samples were particularly difficult to identify because the necessary references in fiber atlases were wanting. Comparison material from herbarium samples in the National Herbarium, housed at the Smithsonian, were equally dessicated and as difficult to prepare as ethnographic material. The identification of the species of all but a few of the non-commercial vegetable fibers was not possible from their morphology. Matthews2 proved to be the single best source of the possibilities to explore. The situation as far as the scaled fibers—wool and furs— were concerned was, however, somewhat better.
The scales on wool or fur fibers were themselves an insufficient basis for
identification, but the pattern could be used as confirmation. The scale pattern was best observed directly, using a high-index medium rather than taking a cast of the scales by pressing the hair into a film of dried but still plastic clear nail polish
(Figure 8) or some other casting medium, then removing the fiber. The result of attempting a cast of a fiber which was not fresh was usually to pull the scales off the fiber, if not to break it altogether.
Fig. 8. Scale cast using clear nail polish. Photographed without cover slip. 500x.
Keys for the identification of the fur of animals of specific geographical areas are listed in the Appendix on fur and wool fibers. The keys were useful outside their geographical limits for the larger species, which have fewer members but wider ranges. The use of a key suggested that the fur from a single pelt large enough to be used as a saddle pad was from a particularly large marten found in the West, the Mustela caurina(Figure 9). This is a marten so uncharacteristically large for its genus that at first an expert on mammals failed to name it as a possibility. The keys correctly directed attention to the mustelidae, which was confirmed by the expert once he saw the entire pelt. The keys had several limitations. They were usually based upon the longest guard hair, occurring only at the midline of the back. Another limitation was that the underfur of most animals is closely similar. Color was sometimes a clue, but burial tended to stain fibers various shades of brown.
Fig. 9. Guard hair of Mustela caurina, a large western marten. 283x, 70° crossed polars.
wool was very fine. The scales were ashed, using a red-hot dissecting needle on a short length of the blue wool fiber while it was resting on a microscope slide. The scales were separated by this procedure, and quite unexpectedly a blue haze condensed on the cold glass slide (Figure 10). This condensate suggested that the blue dye might be indigo, since indigo sublimes at temperatures above 300°C. As confirmation, another blue fiber was bleached in nitric acid and the resulting orange crystals were identified as isatin by their optical characteristics. The fiber itself
(Figure 11) was differentiated from sheep wool by its even pigmentation, faintness of scale pattern, scarcity of medulla, and a round rather than oval cross section, all characteristic of camel hair. It is easy to be misled by current-day criteria of value and utility in projecting the possible identities of a fiber sample. This wool sample came from one of the South American camels, the vicuna, and a material one would not expect to find used in so offhand a way. Also possible are mixtures of fibers, and of later mending materials.
Fig. 10. Condensed indigo, sublimed from ashed fiber of dyed vicuna. 433x.
Fig. 11. South American camel wool (vicuna), bleached of indigo dye in nitric acid. 283x.
fiber was not from the seal but from the caribou (Figure 13). Though perishable, because its very thin cortex results in a brittle fiber, it was an excellent choice for a parka because caribou fur is in fact warmer than seal.
Fig. 12. Damage to horsehair by carpet beetles, typical of insect damage. 17x.
Fig. 13. A very thin cortex is typical of the fur of the deer family. This example is caribou. 500x.
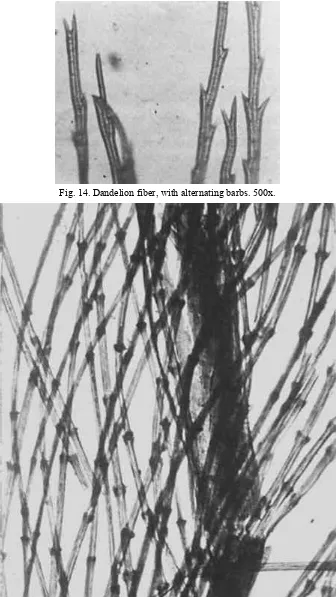
Fig. 14. Dandelion fiber, with alternating barbs. 500x.
description were excavated in Labrador from a level just above the permafrost. No matter what the magnification, their microstructure could not be brought into focus, and it seemed that the microscope would require a major realignment. When a preparation containing fresh comparison material was observed, however, the fresh material came into sharp focus. Apparently the excavated fibers had decayed to the point where the microstructure had lost its definition so that in effect it was no longer there. Excavated cotton fiber has also been observed whose surface was so distressed that it had an appearance very similar to the surface scales found on wool or fur fibers, except that those of wool or fur would have been more regular in pattern.
These examples demonstrated some of the problems encountered when attempting the identification of fibers from archeological or ethnographic materials. Even where these fibers eluded precise identification, it was possible to make a general classification and an assessment of their condition which made the effort to identify them worth while.
REFERENCES
BrunoLuniak, Identification of Textile Fibres. Qualitative and Quantitative Analysis of Fibre Blends, London1953, p. 123; A.Herzog, Textile Forchung4 (1922):58. R.Mauersberger, editor, Matthews' Textile Fibers, sixth edition (New York1954). Mary ElizabethKing and Joan S.Gardner, “The Analysis of Textiles from Spiro Mound, Oklahoma”, in Anne-Marie E.Cantwell, James B.Griffin, and Nan A.Rothschild, editors, The Research Potential of Anthropological Museum Collections, Annals of the New York Academy of Sciences376 (1981):123–139.
APPENDIX
1 APPENDIX
1.1 THE RED PLATE TEST
LUNIAK, FOLLOWING HERZOG, suggested the possibility that the direction (right- or left-hand) of cellulose could be determined optically using a polarizing microscope.1 Specifically, he states:
In order to put this suggestion into practice it is necessary to have a polarizing microscope with a compensator slot and a first-order, so-called red plate. Actually, the color of the field of view when the polars are crossed and the red plate is
inserted in the compensator slot may be more accurately described as magenta. It is more convenient if the microscope, as do most polarizing microscopes, has a rotating stage.
Since bast and leaf fibers are polycrystalline they do not behave optically as neatly and unequivocally as a single crystal, and complete extinction under crossed polars does not occur in these fibers. For this test an individual fiber is more likely to give a definite response than a bundle of fibers, but not all individual fibers are good subjects. Colors under the red plate often cannot be observed when the fiber is in the 45° position which gives maximum brightness under crossed polars alone. To yield diagnostic colors when the red plate is inserted, the fiber should be observed first under crossed polars in a “nearest-to-extinction position” (since they do not extinguish completely) of 0° or 90° that is, the fiber should be parallel to the optical direction of either the polarizer or analyser. Rather than as an extinction position, this might be described better as the position in which the fiber appears most gray, or darkest.
The fiber to be identified must be observed first without the red plate in order to locate exactly an area of the fiber most nearly totally extinguished by crossed polars
Fig. . FUR AND WOOL FIBERS, REPORT OF MICROSCOPIC OBSERVATION
1.2 IDENTIFICATION FROM
• Martin Brown, F. “The microscopy of mammalian hair for microscopists,” Proceedings of the American Philosophical Society 85 (1942) 250–274. • Brunner, Hans and Coman, Brian J., The Identification of Mammalian Hair,
Melbourne 1974.
• Hausman, L. A. “Structural characteristics of the hair of mammals,” The American Naturalist 54 (1920) 496–523.
• Hicks, John W., Microscopy of Hairs, A Practical Guide and Manual, Washington 1977.
• Luniak, B., The Identification of Textile Fibres, London 1953. • Mathiak, Harold A. “A key to the hairs of the mammals of southern
Michigan,” Journal of Wildlife Management 2 (1938) 251–268.
• Mauersberger, R., editor, Matthew's Textile Fibers, sixth edition, New York 1954.
• McCrone, Walter C. and Delly, John, The Particle Atlas Edition Two, volume II, Ann Arbor 1973, articles 39, 40, 43, 44, 45, 46, 47, 48, 49, 50, 51, 52, 53, 54.
• McCrone, Walter C., Delly, John Gustav, and Polenik, Samuel James, The Particle Atlas Edition Two, volume V, Ann Arbor 1979, articles 837, 838, 839, 840, 841, 842, 843, 844, 845, 846, 847, 848, 849, 850, 851
• Moore, Tommy D., Spence, Liter E., Dugnolle, Charles E., Hepworth, William G., editor, “Identification of the Dorsal Guard Hairs of some Mammals of Wyoming” (Wyoming Game and Fish Department Bulletin No. 14) Cheyenne 1974.
• Stoves, J. L., Fibre Microscopy, Princeton 1958.
• Von Bergen, Werner and Krauss, Walter, Textile Fiber Atlas, New York 1942.
• Wildman, A. B., Microscopy of Animal Textile Fibres, Leeds 1954. • Williams Cecil S. “Aids to the identification of mole and shrew hairs with
JAIC 1979, Volume 19, Number 1, Article 6 (pp. 42 to 62)
SOME APPLICATIONS OF INFRARED SPECTROSCOPY IN
THE EXAMINATION OF PAINTING MATERIALS
Richard Newman
ABSTRACT—Infrared spectroscopy has been used successfully in the characterization of several types of painting materials. Although most often employed with organic materials, the technique can also yield valuable structural information on many inorganic compounds. Several applications of infrared spectroscopy to inorganic pigments are reviewed, the theoretical bases for the spectra of these materials considered, and characteristic spectra presented. The materials discussed include chrome greens, green earths, and chromium oxide and viridian. Synthetic organic pigments can also be readily identified by infrared spectroscopy and one example (phthalocyanine blue) is discussed. All spectra were obtained from minute samples comparable in size to those often available from art objects, and were recorded using a Fourier transform IR spectrometer.
1 INTRODUCTION
ANALYTICAL TECHNIQUES used in the characterization of the materials of painting are many. Those used in a particular case are dependent upon available instrumentation, time or financial considerations, amount of sample available (if sampling can be done), and so forth. If possible, a variety of techniques is often used to characterize the material, the particular combination being determined by the general type of material in question.
Infrared spectroscopy is most widely used with organic materials, since carbon-hydrogen, carbon-oxygen, and other types of bonds which are found in
compounds of this category have fundamental vibration frequencies in the
infrared region, particularly in the “mid-infrared” which extends from about 2.5 to 25 microns (4000 to 400 cm−1).∗ Among the difficulties often encountered when this instrumental technique is employed for pigment analyses are the presence of binding media which may mask or distort the characteristic absorptions of pigments (particularly if the latter are organic compounds), the presence of several pigments which may also mask absorptions or generally make
assignments difficult, and sample sizes. Although beam condensors and sample preparation techniques for very small samples are widely available, the quality of spectra obtained from microsamples may often be poor, and weaker absorptions tend to become lost in the instrumental noise. It is often possible to make definite or fairly definite identifications of many painting materials on the basis of the general shapes and intensities of only a few major absorption bands, but in other cases an overall pattern of a large number of peaks is sought, and in these
∗—The spectra in this paper are presented as a function of wavenumber (cm−1). In other publications, spectra and positions of absorption bands may be given in wavelengths (λ) rather than wavenumbers. The relationship between these two numbers is: cm−1 = (104/λ). The units for λ in this formula are microns (10−6 m).
However, infrared spectroscopy has been used successfully for a number of special problems involving painting materials, such as the identification of “copper resinates”1, 2 and organic lake pigments,3, 4, 5 and the characterization of binding media, including varnishes.6, 7, 8 Special note should be made of the pioneering studies by M.J.D. Low with N.S. Baer on the application of the Fourier transform infrared technique in conservation science.9, 10, 11 Publications thus far by these authors in this field have been concerned with “fingerprinting” natural resins and distinguishing between red lakes prepared on different substrates.
Applications to inorganic pigments have been fewer, perhaps because of the widespread availability of other techniques for these types of materials which in general require smaller sample sizes, including X-ray diffraction, and various elemental analytical techniques (emission spectrography, electron beam microprobe, etc.) But the potential of infrared spectroscopy for the study of certain materials in this class has been shown by C. Grissom in her study of green earths,12 and work has also been published on iron oxide-containing earth
pigments.13, 14 There is no lack of reference spectra for materials in this class. High-quality spectra of modern inorganic pigments have been published by the paint industry.15, 16 The literature on the infrared study of minerals is
voluminous,17 and much of value to the study of pigments is to be found in that literature since many pigments are minerals or synthetic versions thereof.
The purpose of this paper is to review several applications of infrared
spectroscopy, particularly in the realm of inorganic pigments.18 The materials chosen for this study were ones for whose characterization infrared spectroscopy may be particularly valuable. Many of the materials studied were taken from reference collections in the Center for Conservation and Technical Studies; Fogg Art Museum.19 Although very large quantities of most of these were available, all samples were purposely kept small, generally on the order of the size of sample that would often be available from an art object, in order that the quality of spectra that may be expected from such samples is more readily evident. Of the infrared spectrometers available to the author, a Fourier transform instrument was found to give the highest quality spectra with the sample sizes here used. The theory of the operation of this type of spectrometer and details of the
instrumentation have been well described elsewhere.9, 20
2 APPLICATIONS
2.1 Sample Preparation and Instrumentation
pressed into 1.5 mm diameter pellets using a vacuum pump and Perkin-Elmer microdie. The samples were run with the aid of a Perkin-Elmer 3X beam
condensor. According to Perkin-Elmer, sample concentrations as small as 10 μg in 1.5 mm KBr pellets will provide good spectra,21 although in preparing the spectra presented in this paper, sample sizes were usually several times greater than this (up to approximately 50–60 μg in a few cases). The spectra were collected on a Nicolet 7199 FT-IR spectrometer (Nicolet Instrument Corp., Madison, Wisconsin) equipped with a Zeta digital plotter.22 The spectra were obtained in the 4000–400 cm−1 range using a liquid nitrogen-cooled HgCdTe detector. The resolution in all cases was 4 cm−1, and the number of scans either 128 or 256. All of the spectra were automatically ratioed by computer against a blank KBr pellet. N2 was continuously flowed through the sample chamber in order to eliminate interference from atmospheric H2O and CO2. Residual water not ratioed out is the cause of the sharp band(s) appearing in several spectra at 670–690 cm−1.
Plotting of the spectra was done under the control of the computer. For more convenient comparison of separate spectra or portions thereof various
manipulations of the ordinate and abscissa were carried out with the aid of the computer on many of the full spectra.
Particularly with inorganic compounds of high refractive indices relative to the matrix material (for KBr, n = 1.56), the quality of the spectra may be very poor due to scattering and reflection losses if the particle size is much greater than the wavelength of the incident radiation.23 This scattering and reflection causes anomalies in the relative intensities of absorption bands, anomalies which are not entirely eliminated until the particle size is considerably smaller than is normally practically obtainable. In an attempt to reduce these effects, the samples studied here were crushed as finely as possible before mixing with the salt, but some lack in the reproducibility of relative intensities of bands from sample to sample of a given material would be expected since particle sizes are probably still rather variable. There are certain other anomalies that may on occasion occur in the spectra of materials prepared in KBr matrices,24 but these are probably not of much significance in the spectra here recorded.
Theoretically, the pigment samples may be largely recovered from the pressed pellets by dissolving away the KBr salt with water. This is a very tedious
operation, but it could be undertaken if the amount of sample available were very limited and other types of examination were necessary.
2.2 Modern Synthetic Organic Pigments: Phthalocyanine Blues
IN THIS CENTURY, literally hundreds of synthetic organic pigments and
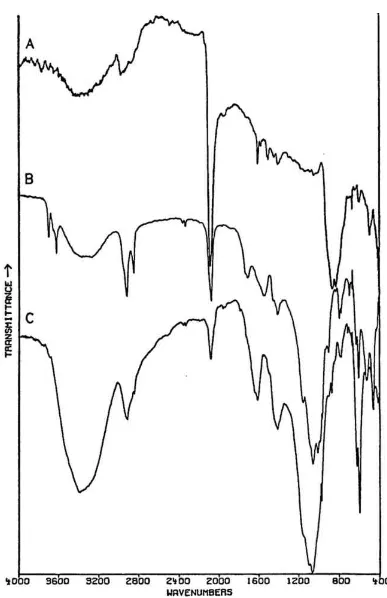
polymorphic forms,26 the two most common of which are designated α and β. Although the polymorphs may be prepared in well-crystallized forms, amorphous forms are actually preferred by color manufacturers because of their more suitable properties, and consequently X-ray diffraction data may be unobtainable.27 In the mid-infrared region, the phthalocyanines give very distinctive spectra which (particularly below about 1700 cm−1) contain many sharp bands due to stretching deformations of the aromatic ring system carbon-carbon bonds, and in-plane and out-of-in-plane bends of the carbon-hydrogen bonds in the ring system.28,
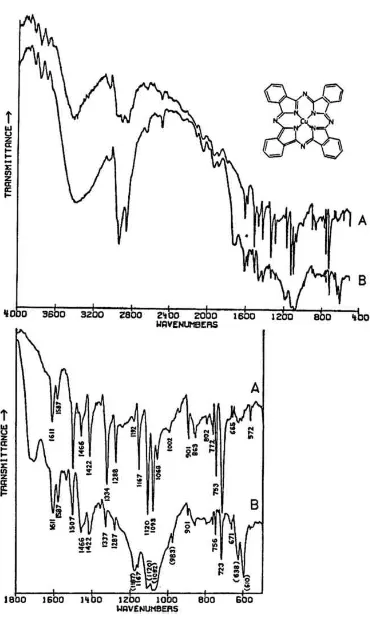
29Fig. 1A shows the full spectrum of a dry copper phthalocyanine pigment and an expanded portion of its spectrum. Fig. 1B reproduces the spectrum of a copper phthalocyanine oil paint film. The oil medium produces bands at 1715–1732 cm−1 and probably contributes to a general increase in absorbance between 1200–1000 cm−1. This paint is also extended with BaSO4, which is often the case with the strongly tinting phthalocyanines; the bands at 1186, 1120, 1082, 983, 638, and 610 cm−1 are due to this sulfate compound (see Section 2.C). In spite of these interferences, the pigment is readily identifiable, and the polymorph may be definitely established as α on the basis of the sharp band at 723 cm−1, due to out-of-plane bending of C-H bonds. This band is located at 730 cm−1 in the β
modification. The dry pigment is also the α polymorph.
Infrared spectroscopy is a technique widely employed in the analysis of modern synthetic colorants,30 and reference spectra of many of the important pigments and dyestuffs have been published.31
2.3 Inorganics Containing Polyatomic Ions
2.3.1 Theoretical Basis for the Infrared Spectra of Polyatomic Ions
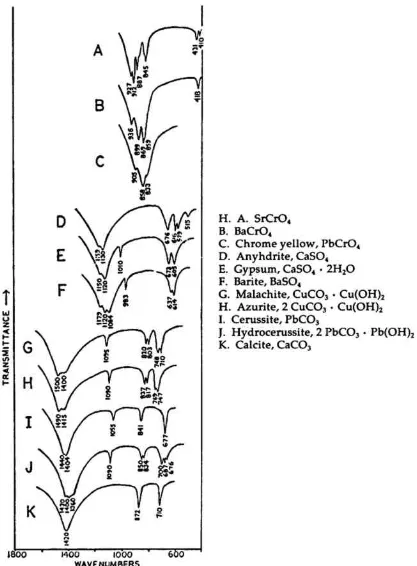
MANY TRADITIONAL and modern inorganic pigments, both mineral and synthetic, contain polyatomic ions. Those ions most frequently encountered include carbonate (malachite; azurite; blue verditers; calcite; cerussite;
hydrocerussite); sulfate (gypsum; anhydrite; barite or ‘blanc fixe’); and chromate (chrome yellows; chrome orange; chrome greens).
In compounds of these types, the binding forces between atoms within the polyatomic ions are appreciably stronger than those between these ions and the metallic cations in the crystal lattice. As a consequence of this fact, different compounds containing a specific polyatomic ion will exhibit spectra which display general similarities in the mid-infrared frequency range.
Fig. 1. Structural formula and spectra of phthalocyanine blue pigments: A. Phthalocyanine blue dry pigment, Krebs Pigment Corp. (Wilmington, Del.), 1935 (Forbes Pigment Collection no. 11). B. Phthalocyanine blue oil paint. Winsor & Newton; scraped from a film prepared on aluminum, 5/ 1936