ISSN: 2339-076X, Volume 2, Number 4 (July 2015): 415 - 422
DOI:10.15243/jdmlm.2015.024.415
Research Article
The comparison analysis of land cover change based on vegetation
index and multispectral classification
(a case study at Leihitu
Peninsula of Ambon City District)
W.A. Siahaya*, P. Danoedoro, N. Khakhim, M. Baiquni
Postgraduate Program, Faculty of Geography, Gadjah Mada University, Bulaksumur, Yogyakarta 55281, Indonesia.
*corresponding author: [email protected]
Abstract:
The study utilizes Landsat-7 ETM+ 2001and Landsat TM5 2009 based on Normalized Differences Vegetation Index (NDVI) and 457 colour composite at the study area located in Leihitu Peninsula, Ambon City District, Ambon Island, Moluccas Province. The classified satellite data under NDVI and 457 colour composite of 2001 and 2009 of 2001 and 2009 were used to determine land cover change that have occurred in the study areas. This study attempts to use a comparative change detection analysis in land cover that has occurred in the study area with NDVI and 457 colour composite over 9 year period (2001 to 2009). The results of the present study disclose that total area increased their land cover were bare land and impermeable surface, herbaceous and shrubs, low density vegetation, and medium density vegetation, while high density vegetation is decreasing in both NDVI and 457 colour composite analysis. Overall accuracy was estimated to be around 94.3 % for NDVI and for 457 Colour composites was 84.7%. The study area has experienced a change in its land cover between 2001 and 2009 in both NDVI and 457 false colour composite analyses. The whole land cover types have experienced increased in both methods, except high density vegetation. The transformations of spectral vegetation (NDVI) product more closely with actual land cover compared with 457 colour composite product.Keywords: change detection, colour composite, land cover, NDVI, vegetation index
Introduction
Land is a basic source of mass and energy throughput in all terrestrial ecosystems (FAO, 2000). Land is a physical environment, which comprises climate, topography, hydrology, and natural vegetation, thus involving ecosystem (Hardjowigeno and Widiatmika, 2007).
Generally, land resources have reached a critical stage due to the increasing of population. When human interaction with the land increases, understanding the changes in the land becomes an integral part of any environmental plan (Perera et al., 2011).
Land-cover refers to the physical characteristics of earth’s surface, captured in the distribution of vegetation, water, soil and and/or artificial structures (Ioannis and Meliadis, 2011). Land cover is the observed types of (bio) physical cover on the earth’s surface (FAO, 2000). In contrast, land cover, in its narrowest sense, often
designates only the vegetation either national or man-made, on the earth’s surface (Kavitha et al., 2012). Furthermore, it is mentioned that the term land cover lacks the emphasis on economic function that is essential to the concept of land use.
Land use/land-cover analysis provides the baseline data required for proper understanding of how land was being used in the past, what type of changes have occurred and are expected in the future (Mani and Krishnan, 2013). Land use/land cover is an important component in understanding the interactions of the human activities with the environment (Vikhe and Patil, 2014). Knowledge of land cover is important for many planning and management activities concerning the surface of the earth. It is necessary to monitor and detect the land use changes to balance a sustainable environment (Pandian et al., 2014).
time, at low cost and with better accuracy (Kachhwala, 1985) in association with Geographical Information System (GIS) that provide suitable platform for data analysis, update and retrieval (Star et al. 1997).
Satellite remote sensing capability is to provide near or real-time consistent and promising data that covers large areas through orbiting satellites that have different wavelengths, look angles and resolution (Kwarteng, 1999). The ability to obtain remote sensing data (Sabins, 1996) for vegetation land-cover studies plays major role in developing classification scheme (Lillesand et al., 2004). Change detection using remote sensing techniques that involves the comprehensive analysis of spatio-temporal as well as spectral characteristics of RS dataset so as to derive accurate information of a given changes in landscape (Singh, 1989; Yang and Lo, 2002; Stathakis and Kanellopoulos, 2008).
Change detection techniques are many, for example tasseled cap transformation, image algebraic technique which included principal component analysis, image regression etc. there is also the multi date composite technique, change vector analysis, and post-classification change detection techniques (Morisette, 1997). The use of land-cover change detection tools such as vegetation indices can help to discriminate different areas of land-cover changes that has occurred between different years in an imaging (Lillesand et al., 2004).
Several attempts have been made in developing advanced classification methods towards improving accuracy in NDVI products (Foody, 1996; Aplin et al., 1999; Stuckens et al., 2000; Pal and Mather, 2003). Jensen (1986) explains that the theory of change detection is that the spectral value of cells from datasets covering the same landscape but of different epochs will differ if the physical characteristics have change overtime. Parakash et al. (1998) used a combined method of colour composite, band subtraction, band division and supervised classification to
prepare a land-use map for change detection in a coalmining district in India. They concluded that the supervised classification gives better results for detecting changes.
For effective and sustainable land cover analysis, the use of vegetation index NDVI and Composite Colour should be encouraged, which is adopted in this study. The main objective of the present study is to analyze and identify the nature and extent of land cover changes in Leihitu Archipelago Ambon City, Ambon Island based on Normalized Difference Vegetation Index (NDVI) and image colour composite method.
Materials and Methods
The study are located at Leihitu Peninsula, Ambon City District, Ambon Island which stretches between 3°34′25″S to 3°42'42″S and 128°03'45″E to 128°15′10″E, covering area 11,838.8 ha (Figure 1). Multitemporal satellite data set observed by LANDSAT-7 Enhanced Thematic Mapper+ (ETM+) and LANDSAT TM5 (Thematic Mapper) were used for the analysis are presented in Table 1. The method used are image pre-processing (radiometric correction, and geometric transformation) image cropping, image classification and change detection. Image pre processing is done to derive maximum benefits from satellite imagery, there is the need to eliminate or reduce errors embedded in the data due to atmospheric effects, sensor and illumination effects as well as missed-registration.
Table 1. Image Data Sources
Data Path
In this research, both radiometric and geometric corrections were applied to the RS images used, including applied Landsat-7 ETM+ 2001 and Landsat TM5 2009 to obtain useful predictive parameters.
ߩૃ۾ܑܠ܍ܔ,۰܉ܖ܌=ቀഊುೣ,ಳೌ.ௗ
మ.గ
ா௦௨ഊಳೌ.ୡ୭ୱ(ఏೞ)ቁ ……….. 1.
Radiometric correction is a useful step of conversion of the value of brightness (digital number) into absolute reflectance value. Technically, radiometric correction is conducted using facilities provided by ENVI 4.5 within Basic Tools – Band Math that was calculated by
formula 1. The image of radiometric correction results are presented in Figure 2.
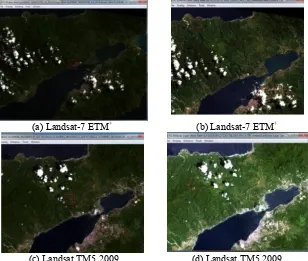
The Landsat TM5 2009 image data was registered using several control points that linked to some identified positions in the topographic (RBI, 1:50.000) map. Landsat Image which has been corrected in geometric is used as a reference to the geometric registration of landsat-7 ETM+ image. The reason for using the control points is to build a polynomial transformation that will change dataset to spatially correct location from its existing location. The results of geometric correction image is presented in Figure 3.
(a) Landsat-7 ETM+ (b) Landsat-7 ETM+
(c) Landsat TM5 2009 (d) Landsat TM5 2009
Figure 2. Radiometric Correction Image: before (a, c) and after (b, d)
Image cropping was done on image that has been corrected in radiometric and geometric. Image cropping was done to find out the image of regions that would analysis. Image cropping was done to simplify the process of digital analysis and reduce memory that is needed to make the process of data processing more accelerated.
Image processing
An analysis of land cover changes cannot be separated from an analysis of vegetation cover changes. Many methods have been developed to study condition of vegetation both in quantitative and qualitative of satellite images, such as vegetation transformation indices, and colour composite image. Analysis of land cover was conducted using NDVI on vegetation indices transformation and false colour composite, by combing near infrared, middle infrared-I and middle infrared-II which are bands 4, 5, 7
together for both imagesusing ENVI 4.5.
The classification of spectral vegetation value of Landsat-7 ETM and Landsat TM5 image to determine land cover type based on relative calibration approach. While the classification of the spectral range of colour composite image used threshold approach of each image histogram. Index vegetation image of Landsat-7 ETM + (2001) and Landsat TM5 ( 2009 ) converted into a land cover map (2001 and 2009) in vector format through raster to vector conversion procedure in ENVI 4.5. In the present study, five cover categories were identified namely bare soil and impermeable surface, herbaceous and shrubs, low density vegetation, medium density vegetation, high density vegetation. Description of these land clover classes are presented in Table 2. To assess the accuracy of classification in both NDVI and 457 colour composites, field observation was employed, while to evaluate the land cover map changes for the 2001 to 2009 interval we using crosstab analysis in ArcGIS 9.3.
Table 2. Land cover classification
Land Cover Type Description
Bare land Bare land and build up area (residential, transportation, social complexes and services).
Herbaceous and shrubs Low dense under bush
low density vegetation A low dense growth plants, and underbrush.
medium density vegetation A medium dense growth of trees, plants, and underbrush. high density vegetation A dense growth of trees, and plants.
Result and Discussion
Land cover analysis in normalized differences vegetation index
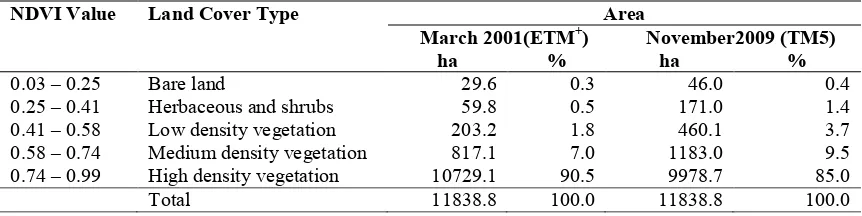
The coverage area of each land-cover type of the study area of the years 2001 and 2009 were produced by using Normalized Differences Vegetation Index is shown in Table 3, while those distribution were presented in Figures 4 and 5.
High density vegetation is the dominant land cover type in the study area, while bare land was the smallest both in 2001 and 2009. According to Landsat imagery of the year 2001 (March Landsat-7 ETM+) high density vegetation covered above 90 percent of the study area (Table 3), this has been decreased to 85.0 percent in 2009 (November Landsat TM5) imagery.
Table 3. Area under NDVI and land cover type
NDVI Value Land Cover Type Area
March 2001(ETM+) November2009 (TM5)
ha % ha %
0.03 – 0.25 Bare land 29.6 0.3 46.0 0.4
0.25 – 0.41 Herbaceous and shrubs 59.8 0.5 171.0 1.4
0.41 – 0.58 Low density vegetation 203.2 1.8 460.1 3.7
0.58 – 0.74 Medium density vegetation 817.1 7.0 1183.0 9.5
0.74 – 0.99 High density vegetation 10729.1 90.5 9978.7 85.0
Figure 4. Land cover under NDVI using Landsat-7 ETM+2001
Figure 5. Land cover under NDVI using Landsat TM5 2009
Land cover under 457 colour composites analysis
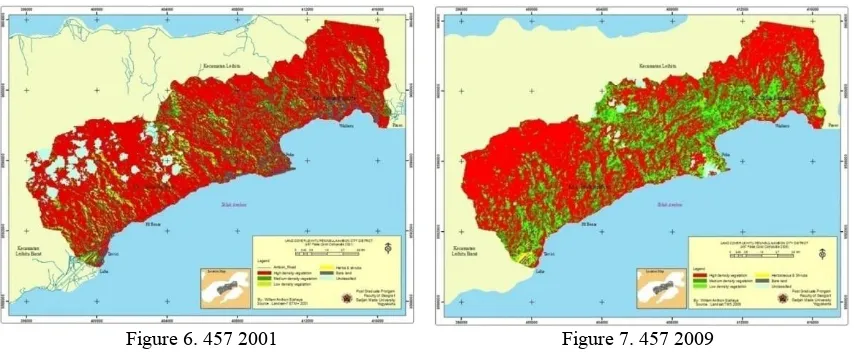
The land-cover maps of 2001 and 2009 were produced by using supervised image classification technique based on the Maximum Likelihood Classifier (MLC) and 534 training samples. Land cover area under 457 colour composites is shown in Table 4. Figures 6 and 7 present the distribution of each land cover type of the study area of the
years 2001 and 2009. High density vegetation is the dominant land cover type in the study area, while bare land was the smallest both in 2001 and 2009. According to Landsat imagery of the year 2001 (March Landsat-7 ETM+) high density vegetation covered above 77 percent of the study area (Table 4), this has been decreased to 58.0 percent in 2009 (November Landsat TM5) imagery.
Figure 6. 457 2001 Figure 7. 457 2009
Bare land area includes settlements, government and social facilities, transportation and recreation places. Generally, the growth and development of bare land areas was along the coastal area. The vegetation found in herbaceous and shrubs were reeds, centrosema, crotalaria, and various species of shrubs. There was also found the agricultural crops such as tubers, nuts, vegetables, corn, banana, papaya, pineapple, and chili. Besides that, there was also found saplings level of mahogany, lenggua, and crops of fruit as langsat, gandaria, mango, rambutan, cashew, and jackfruit. The vegetations found in low density were jabon,
Table 4. Land cover type area under 457 colour composite
ROI Land Cover Type Area
March 2001(ETM+) November 2009 (TM5)
ha % ha %
I Bare land 16.1 0.1 35.4 0.3
II Herbaceous and shrubs 43.1 0.4 106.0 0.8
III Low density vegetation 514.1 4.4 1508.5 12.2
IV Medium density vegetation 2051.3 17.2 3471.2 28.3
V High density vegetation 9214.1 77.9 6717.7 58.4
Total 11838.8 100.0 11838.8 100.0
In addition, there was also found fruit trees such as duren, walnut, langsat, duku, mangosteen, parkia, jackfruits, and bouea macrophyla, salaca, and banana, and plantation such as clove, nutmeg, and coconut. The vegetations e found on this land had medium density in cover. In this area, there was also some kind of agriculture crops such as that has been described above by the spread sporadically. The vegetations found in high density were agathis, matos, angsana, black belo tree, wood of iron, calophyllum, jabon, ulin, candlenut, gopasa, sago, jeunjing, rattan, sago, nypa, mangrove, herbaceous, and grass. In addition, there were also found fruit trees such as duren, walnut, langsat, duku, mangosteen, parkia, jackfruit and bouea macrophyla; and plantation
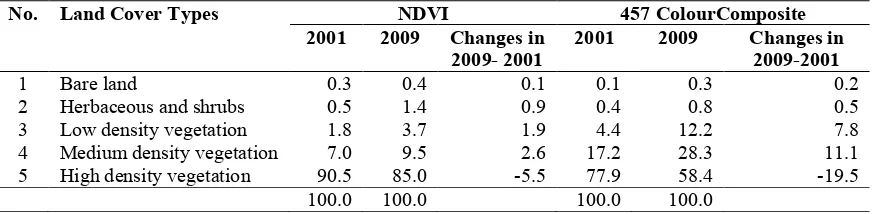
such as clove and nutmeg. The vegetations found on this land had high density in cover. The final analysis shows the classified Figures 3-6 in relation to the verification of the land cover, put NDVI and 457 colour composite as the method for discriminating land cover, hence used as the reference in this discussion. Not only in NDVI but also in 457 colour composite analysis, bare land, herbaceous and shrubs, low density vegetation, and medium density vegetation are increasing in trend, and high density vegetation is decreasing in trend from 2001 to 2009, while high density vegetation is decreasing. Nevertheless broad area of medium density vegetation and high-density vegetation based on NDVI transformation was less than 457 colour composite method (Table 5).
Table 5. Changes in Land Cover 2009-2001
No. Land Cover Types NDVI 457 ColourComposite 2001 2009 Changes in
2009- 2001
2001 2009 Changes in 2009-2001
1 Bare land 0.3 0.4 0.1 0.1 0.3 0.2
2 Herbaceous and shrubs 0.5 1.4 0.9 0.4 0.8 0.5
3 Low density vegetation 1.8 3.7 1.9 4.4 12.2 7.8
4 Medium density vegetation 7.0 9.5 2.6 17.2 28.3 11.1
5 High density vegetation 90.5 85.0 -5.5 77.9 58.4 -19.5
100.0 100.0 100.0 100.0
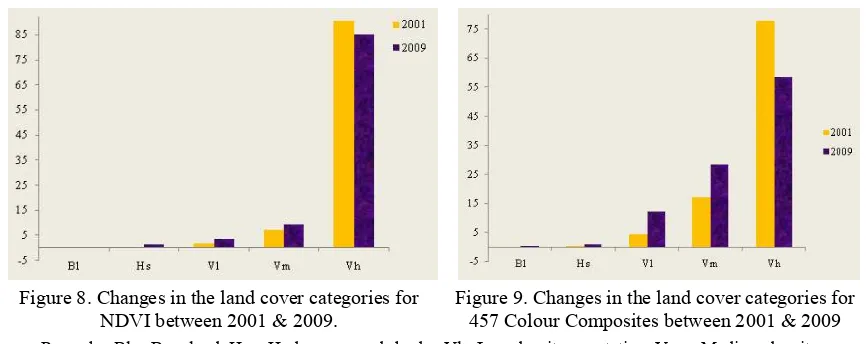
Figures 8 and 9 represent graphically the above changes. The graphic showed that between 1986 and 2008 the amount of bare land, herbaceous and shrubs, low-density vegetation and medium density vegetation increased in both NDVI and 457 colour composite while high density vegetation was decrease. Overall accuracy averaged 94.3 % in NDVI product, while the averaged overall accuracy in 457 Colour Composite product was 84.7%.
Figure 8. Changes in the land cover categories for NDVI between 2001 & 2009.
Figure 9. Changes in the land cover categories for 457 Colour Composites between 2001 & 2009 Remarks: Bl = Bare land. Hs = Herbaceous and shrubs, Vl =Low density vegetation, Vm = Medium density
vegetation, Vh = High density vegetation
Table 6. Accuracy of NDVI 2009
C
la
ss
if
ic
a
ti
o
n
Land Cover
Field Check User Error
Bl Hs Vl Vm Vh TOTAL Accuracy Commission
BL 49 2 0 0 0 51 96.1 3.9
Hs 2 50 2 0 0 54 92.6 3.7
Vl 0 2 45 2 0 49 91.8 8.2
Vm 0 1 1 75 2 79 94.9 5.1
Vh 0 0 1 2 60 63 95.2 4.8
TOTAL 51 55 49 79 62 296
Overall accuracy = 94.3
Remarks: Bl = Bare land. Hs = Herbaceous and shrubs, Vl =Low density vegetation, Vm = Medium density vegetation, Vh = High density vegetation
Table 7. Accuracy of 457 colour composites
C
la
ss
if
ic
a
ti
o
n
Land Cover
Field Check User Error
Bl Hs Vl Vm Vh TOTAL Accuracy Commission
Bl 43 8 1 0 0 52 82.7 17.3
Hs 2 37 3 0 0 42 88.1 7.1
Vl 0 3 46 7 0 56 82.1 17.9
Vm 0 1 5 35 1 42 83.3 16.7
Vh 0 0 3 2 38 43 88.4 11.6
TOTAL 45 49 58 44 39 235
Overall accuracy = 84.7
Remarks: Bl = Bare land. Hs = Herbaceous and shrubs, Vl =Low density vegetation, Vm = Medium density vegetation, Vh = High density vegetation
Conclusion
Overall accuracy was estimated to be around 94.3 % for NDVI and 84.7% for 457 colour composites. The study area has experienced a change in its land cover between 2001 and 2009 in both NDVI and 457 false colour composite
Acknowledgements
The first author would like to thank the NUFFICS and MDF Pacific-Indonesia for providing research grants to undertake this study.
References
Aplin, P., Atkinson, P.M. and Curran, P.J. 1999. Per-field classification of land use using the forthcoming very fine spatial resolution satellite sensors: problems and potential solutions. In Atkinson, P.M., and Tate, N.J., (eds) Advances in remote Sensing and GIS. John Wiley & Sons Ltd., New York, NY. 219-239.
FAO. 2000. Land Cover Classification System (LCCS). Natural Resources Management and Environment Department. Rome, Italy.
Foody, G. M. 1996. Approaches for the production and evaluation of fuzzy land cover classification from remotely-sensed data. International Journal of
Remote Sensing17: 1317–1340.
Hardjowigeno, S. and Widiatmaka. 2007. Evaluasi Kesesuaian Lahan dan Perencanaan Tataguna
Lahan.Gadjah Mada University Press. Yogyakarta.
Ioannis, M. and Meliadis, M. 2011. Multi-temporal Landsat image classification and change analysis of land cover/use in the Prefecture of Thessaloiniki, Greece. Proceedings of the International Academy
of Ecology and Environmental Sciences1 (1):
15-26.
Jensen, J.1986. Introductory Digital Image Processing: A remote sensing perspective. Prentice-Hall, Englewood Cliffs New Jersey, 235 pages
Kachhwala, T.S. 1985. Temporal monitoring of forest land for change detection and forest cover mapping through satellite remote sensing. In:Proceedings of
the 6th Asian Conf. on Remote Sensing, Hyderabad.
pp. 77-83.
Kavitha, K., Prakasam, C. and Shanthakumari, A. 2012. Land Use Land Cover Change Detection In Madurai District, Tamil Nadu, India: Using Satellite Remote Sensing. International Journal of
Physical and Social Sciences2: 104-117.
Kwarteng, A. Y. 1999. Remote sensing assessment of oil lakes and oil-polluted surfaces at the Greater Burgan oil field, Kuwait. International Journal of
Applied Earth Observation and Geoinformation1:
36-47.
Lillesand, T. M., Kiefer, R. W. and Chipman, J. W. 2004. Remote Sensing and Image Interpretation. 5th edition, John Wiley & Sons, New York. Mani, N., and Krishnan, R. 2013. Assessment of
Changes In Land Use/ Land Cover In Tamil Nadu State In India Using GIS. African Journal of
Science and Research2: 01-06.
Morisette, J. T. 1997. Using Generalized Linear Models to Enhance Satellite based Land Cover Change Detection. North Carolina State University, Raleigh, North Carolina, 255.
Pal, M. and Mather, P.M. 2003. An assessment of the effectiveness of decision tree methods for land cover classification. Remote Sensing of
Environment86 (4): 554–565.
Pandian. M., Rajagopal, N., Sakthivel, G. and Amrutha, D. 2014. Land use and land cover change detection using remote sensing and GIS in parts of Coimbatore and Tiruppur Districts, Tamil Nadu, India. International Journal of Remote Sensing &
Geoscience3 (1) 2319-3484
Perera, K., Apan, A., McDougall, K. and Samarakoon, L. 2011. Applying the Global Standard FAO LCCS to Map Land Cover of Rural Queensland. Asian
Journal of Geoinformatics11 (3), ISSN 1513-6728
Prakash, A. and Gupta, R. 1998. Land Use Mapping and Change Detection in a Coal Mining Area, a Case Study in the Jh.ria coalfield, IndiaM.
International Journal of Remote Sensing 19 (3) :
391-410.
Sabins, F.F. 1996. Remote Sensing Principles and Interpretation. 3rd Ed. W. H. Freeman. New York Singh, A. 1989. Digital change detection technique
using remotely-sensed data. International Journal
of Remote Sensing10 (6) : 989-1003.
Star, J.L., Estes, J.E. and McGwire K.C. 1997. Integration of geographic information systems and Remote Sensing. New York, NY: Cambridge University Press.
Stathakis, D., and Kanellopoulos, I. 2008. Global elevation ancillary data for land use classification using granular neural networks. Photogrammetric
Engineering and Remote Sensing74: 55-63.
Stuckens, J., Coppin, P. R. and Bauer, M. E. 2000. Integrating contextual information with per-pixel classification for improved land cover classification.Remote Sensing of Environment71: 282-296.
Vikhe, S.D. and Patil, K.A. 2014. State of the art of land use planning using remote sensing and GIS.
IOSR Journal of Mechanical and Civil Engineering
11 (5): 41-47.
Yang, X. and Lo, C. 2002. Using a time series of satellite imagery to detect land use and land cover changes in the Atlanta, Georgia metropolitan area.
International Journal of Remote Sensing 3: