Company Update
Bank BNI
Bloomberg: BBNI:IJ | Reuters: BBNI.JK
Samuel Research 02 Februari 2017
Andy Ferdinand, CFA +62 21 2854 8148
Still Optimistic
Sejalan dengan pencapaian FY16 yang 7% di atas ekspektasi kami, situasi terkini, dan guidance dari manajemen BBNI, kami menaikkan TP menjadi Rp 6.600 (1,2x PBV 2017F). Pertumbuhan kredit BBNI tahun ini yang diperkirakan masih jauh melebihi industri dan biaya provisi NPL yang lebih kecil dari tahun lalu sejalan dengan meredanya tekanan pada kualitas aset kami lihat sebagai penopang kinerja di tahun ini.
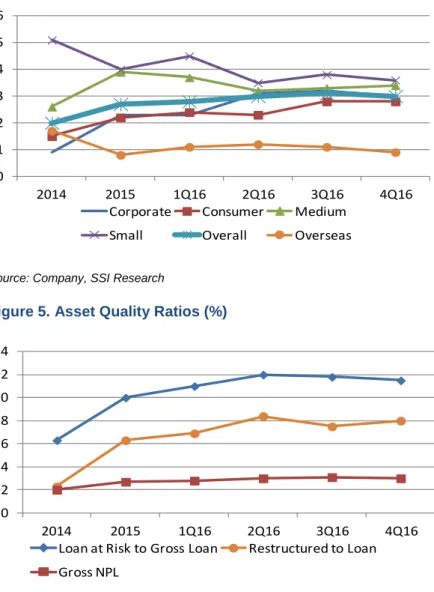
Tekanan pada kualitas aset melandai. NPL gross pada 4Q16 sebesar
3,0% (4Q15: 2,7%, 2Q16: 3,0%, 3Q16: 3,1%) dan terlihat lebih stabil. Hal yang sama ditunjukkan pula oleh data manajemen berupa ratio loan at risk to gross loan dan restructured loan to loan yang sudah lebih stabil. Pendapat kami adalah tekanan pada kualitas aset akan cenderung berkurang di tahun ini, sementara total kredit akan terus tumbuh, sehingga NPL secara
persentase akan flat cenderung turun, dimana manajemen menargetkan NPL <3% tahun ini. Sementara itu, coverage ratio direncanakan naik secara bertahap.
Ekspansi agresif dengan tetap berfokus pada kualitas aset. Kami melihat
permintaan kredit infrastruktur masih akan tinggi di tahun ini sepanjang proyek pemerintah terus berjalan. Kredit infrastruktur naik 30,3% pada FY16. Selain kredit ke SoE, pertumbuhan kredit 2016 ditopang oleh segmen korporasi, small, dan medium yang masing-masing memiliki NPL relatif tinggi. Kami menilai positif langkah manajemen untuk agak menahan kredit di business banking tersebut demi menjaga kualitas aset secara keseluruhan.
Tetap optimis dengan pertumbuhan di tahun ini. Kami memperkirakan
pertumbuhan kredit 18-20% di tahun ini sejalan dengan guidance manajemen, dengan NIM yang agak turun seiring berlanjutnya tren penurunan suku bunga kredit sesuai arahan BI dan kemungkinan naiknya suku bunga acuan BI. Fee-based income dan opex diperkirakan naik 18-21% dan 14-16% sesuai perkiraan manajemen.
Maintain Buy and upgrade TP. Setelah merevisi forecast sejalan dengan
situasi terkini, kinerja FY16 yang 7% di atas ekspektasi kami, serta guidance manajemen, kami mempertahankan rekomendasi Buy dengan target price dinaikkan menjadi Rp 6,600 (1,2x PBV 2017F). Target Price Rp 6,600 Last Price Rp 5,950 Potential Upside 10.9% JCI Index 5,340 Share Issued (m n) 18,649 Market Cap. (Rp bn) 110,959 52-Weeks High/Low 6,075/4,270
Avg Daily Vol (m n) 16.7
Free Float 40%
Nom inal Value Rp 375 (Class C)
Book value/share ‘17 Rp 5,287
Relative to JCI Chart
Com pany Background
Shareholder Structure
Govt of Indonesia 60.0%
Public 40.0%
BUY (Maintain)
PT Bank Negara Indonesia Tbk pada aw alnya didirikan sebagai bank sentral pada tahun 1946. Di tahun 1968, bank ini menjadi bank komersial. Sekarang Bank BNI (BBNI) merupakan salah satu bank terbesar di Indonesia. -40% -20% 0% 20% 40%
Dec-14 May-15 Oct-15 Mar-16 Aug-16 BBNI
JCI
Forecast and Valuation (at closing price Rp5,950 per share)
Y/E Dec (Rp Bn) 15A 16A 17E 18E
Net Interest Income 25,559 29,994 33,159 36,726 Pre Provision Profit 18,748 22,082 23,850 25,818
Net Profit 9,066 11,339 14,277 15,943 EPS (Rp) 486 608 766 855 DPS (Rp) 145 122 152 191 Dividend Yield (%) 2.4 2.0 2.6 3.2 BV per Share (Rp) 4,098 4,674 5,287 5,951 P/E Ratio (x) 12.2 9.8 7.8 7.0 P/BV Ratio (x) 1.5 1.3 1.1 1.0
Bank BNI
BBNI:IJ | BBNI.JK Figure 1. FY16 ResultSource: Company, SSI Research Figure 2. Loan Composition
Source: Company, SSI Research Figure 3. Deposit Composition
Source: Company, SSI Research
(Reported figures)
Rpbn FY15 FY16 YoY FY16E
Net Interest Income 6,537 7,963 8,121 2.0% 24.2% 25,560 29,995 17.4% 27,888 108% Operating Profit 3,868 4,223 4,503 6.6% 16.4% 11,412 14,229 24.7% 13,314 107% Pre Provision Profit 4,801 6,101 5,746 -5.8% 19.7% 18,748 22,082 17.8% 19,744 112% Net Profit 3,069 3,346 3,622 8.2% 18.0% 9,067 11,339 25.1% 10,590 107% Bank Only: NIM 6.4% 6.2% BOPO 75.5% 73.6% LDR 87.8% 90.4% Gross NPL 2.7% 3.0% 4Q15 3Q16 4Q16 QoQ YoY % to FY16E Rpbn Business Banking Corporate 80,238 95,753 19.3% 24.3% SOE 57,671 78,319 35.8% 19.9% Medium 51,147 61,330 19.9% 15.6% Small 42,076 50,684 20.5% 12.9% Subtotal 231,133 286,087 23.8% 72.7% Consumer Banking Mortgage 34,664 36,396 5.0% 9.3% Credit Card 9,789 10,527 7.5% 2.7% Payroll 3,923 8,949 128.1% 2.3% Others 9,164 9,197 0.4% 2.3% Subtotal 57,540 65,069 13.1% 16.5% Overseas 19,538 21,237 8.7% 5.4% Subsidiaries 17,896 20,882 16.7% 5.3% TOTAL 326,105 393,275 20.6% 100.0%
FY15 FY16 Growth Composition
Rpbn
Time Deposit 144,161 154,230 7.0% 35.4% Saving Account 135,065 158,662 17.5% 36.4% Current Account 91,194 122,652 34.5% 28.2%
TOTAL 370,421 435,545 17.6% 100.0%
Bank BNI
BBNI:IJ | BBNI.JK Figure 4. NPL, Gross by Segment (%)Source: Company, SSI Research
Figure 5. Asset Quality Ratios (%)
Source: Company, SSI Research Figure 6. Rolling Forward PBV
Source: SSI Research
0 1 2 3 4 5 6 2014 2015 1Q16 2Q16 3Q16 4Q16 Corporate Consumer Medium
Small Overall Overseas
0 2 4 6 8 10 12 14 2014 2015 1Q16 2Q16 3Q16 4Q16 Loan at Risk to Gross Loan Restructured to Loan Gross NPL 0.5 1.0 1.5 2.0 2.5
Jan-11 Jan-12 Jan-13 Jan-14 Jan-15 Jan-16 Jan-17 Average ST dev +1
ST dev -1 PBV - Forward ST dev +2 ST dev -2
Bank BNI
BBNI:IJ | BBNI.JK Key FinancialsProfit and Loss
(Rp bn) 15A 16A 17F 18F 15A 16A 17F 18F
Net Interest Income 25,559 29,994 33,159 36,726 Profitability
Operating Profit 11,412 14,229 17,952 20,045 NIM 6.5% 6.3% 5.9% 5.7% Pre Provision Profit 18,748 22,082 23,850 25,818 ROAE 13.4% 13.9% 15.4% 15.2% Profit before Tax 11,466 14,302 18,025 20,118 ROAA 2.0% 2.0% 2.2% 2.1% Net Profit 9,066 11,339 14,277 15,943 CIR 50.3% 51.5% 52.9% 54.3% BOPO 76.7% 76.0% 73.4% 73.7%
Liquidity
Balance Sheet LDR 88.0% 90.3% 90.4% 90.7%
Yr-end Dec (Rp bn) 15A 16A 17F 18F CASA Ratio 61.1% 64.6% 65.7% 65.9% Cash 12,890 11,168 13,565 13,238
CA and Placement 73,349 70,108 80,197 91,356 Asset Quality
Marketable Securities 9,928 23,765 26,144 28,757 Gross NPL 2.7% 3.0% 2.9% 2.7% Gross Loan 326,105 393,275 467,997 556,917 NPL Coverage 138% 143% 147% 150% Loan Provision (12,039) (16,680) (19,884) (22,937)
Government Bonds 47,222 63,006 69,307 76,237 Capital
Other Assets 51,140 58,390 66,279 76,882 CAR 20.0% 18.9% 17.4% 16.4% Total Assets 508,595 603,032 703,606 820,451
Deposits 370,420 435,544 517,754 614,354 Growth Rate
Current Account 91,194 122,652 148,409 176,607 Gross Loan 17.5% 20.6% 19.0% 19.0% Saving Account 135,065 158,662 191,981 228,457 Deposits 18.0% 17.6% 18.9% 18.7% Time Deposit 144,161 154,230 177,365 209,290 Net Interest Income 12.3% 17.4% 10.6% 10.8% Deposits from Other Banks 4,697 10,224 10,735 11,272 Operating Income -14.5% 24.7% 26.2% 11.7% Borrowings 22,524 32,965 34,613 36,344 Net Profit -15.9% 25.1% 25.9% 11.7% Securities Issued 6,871 6,731 6,933 7,141
Other Liabilities 25,645 28,314 32,770 38,057 Macro
Total Liabilities 430,157 513,778 602,806 707,168 GDP Growth 4.7% 5.1% 5.2% 5.4% Minority Interest 2,024 2,097 2,202 2,312 BI RR Rate 4.8% 4.8% 5.3% Total Equity 76,413 87,156 98,598 110,971 USD/IDR, average 13,500 13,253 13,200 12,800
DISCLAIMERS : Analyst Certification : The views expressed in this research accurately reflect the personal views of the analyst(s) about the subject securities or
issuers and no part of the compensation of the analyst(s) was, is, or will be directly or indirectly related to the inclusion of specific recommendations or views in this research. The analyst(s) principally responsible for the preparation of this research has taken reasonable care to achieve and maintain independence and objectivity in making any recommendations. This document is for information only and for the use of the recipient. It is not to be reproduced or copied or made available to others. Under no circumstances is it to be considered as an offer to sell or solicitation to buy any security. Any recommendation contained in this report may not be suitable for all investors. Moreover, although the information contained herein has been obtained from sources believed to be reliable, its accuracy, completeness and reliability cannot be guaranteed. All rights reserved by PT Samuel Sekuritas Indonesia
Research Team
Andy Ferdinand, CFA Head Of Equity Research, Strategy,
Banking, Consumer [email protected] +6221 2854 8148
Rangga Cipta Economist [email protected] +6221 2854 8396
Muhamad Makky Dandytra, CFTe Technical Analyst [email protected] +6221 2854 8382
Akhmad Nurcahyadi, CSA Auto, Aviation, Cigarette, Construction
Healthcare, Heavy Equipment, Property [email protected] +6221 2854 8144 Arandi Ariantara Cement, Telecommunication, Utility [email protected] +6221 2854 8392
Marlene Tanumihardja Poultry, Retail, Small Caps [email protected] +6221 2854 8387
Sharlita Lutfiah Malik Mining, Plantation [email protected] +6221 2854 8339
Adde Chandra Kurniawan Research Associate [email protected] +6221 2854 8338
Private Wealth Management
Evelyn Satyono Head of PWM / Institutional Sales [email protected] +6221 2854 8380 Muhamad Alfatih CSA, CTA, CFTe Senior Technical Portfolio Advisor [email protected] +6221 2854 8129
Ronny Ardianto Institutional Equity Sales [email protected] +6221 2854 8399
Clarice Wijana Institutional Equity Sales [email protected] +6221 2854 8395
Fachruly Fiater Institutional Equity Sales [email protected] +6221 2854 8325
Equity Sales Team
Kelvin Long Head of Equities [email protected] +6221 2854 8150
Yulianah Institutional Equity Sales [email protected] +6221 2854 8146
Lucia Irawati Retail Equity Sales [email protected] +6221 2854 8173
Online Trading Sales Team
Nugroho Nuswantoro Head of Marketing Online Trading [email protected] +6221 2854 8372
Wahyu Widodo Marketing [email protected] +6221 2854 8371