128 This article is part of the first author’s dissertation. The first author wish to pay tribute to the late Prof. Drs. Sutrisno Hadi, M.A. for his outstanding guidance concerning this research until he passed away on April 6, 2008.
Correspondence concerning this article should be addressed to Dr. Ide Bagus Siaputra, Faculty of Psychology, Universitas Surabaya. Jalan Raya Kalirungkut Surabaya 60293. E-mail: [email protected]; [email protected]
Subjective and Projective Measures of Thesis Writing Procrastination:
Real World and
The Sims
World.
Ide Bagus Siaputra
Faculty of Psychology, Universitas Surabaya Faculty of Psychology, University of Gadjah Mada
Johana E. Prawitasari, Thomas Dicky Hastjarjo, and Saifuddin Azwar
Faculty of Psychology, University of Gadjah Mada
Although it has been studied since 1980s, the theoretical framework for procrastination has just been comprehensively developed about two decades later. This study applied Temporal Motivation Theory (TMT) as a theoretical framework to develop thesis writing procrastination instruments, using self report and Sim’s behavior observation methods. Self-report results of 232 undergraduate students have fulfilled psychometric norms, concerning either the reliability or validity aspects. Observation of Sim’s behaviors, performed by 48 students, also fulfilled some of the psychometric criteria. The discovery of contradictory patterns of academic activities in the real world against The Sims 2 World was perceived as evidences of basic value differences and manifestation of defense mechanism. Inclusion of subject’s responses on The Sims 2 game play pattern scale in the hierarchical linear regression equation improved the prediction power toward latency of thesis completion.
Keyword: multi-methods, procrastination, Temporal Motivation Theory, The Sims, thesis Sekalipun telah dipelajari sejak 1980-an, kerangka kerja teoretis penunda-nundaan (prokrastinasi) baru tersusun secara komprehensif sekitar dua dekade kemudian. Penelitian ini menggunakan kerangka kerja teoretis Teori Motivasi Temporal (Temporal Motivation Theory/TMT) untuk mengembangkan alat ukur penunda-nundaan pengerjaan tugas akhir dengan laporan diri dan pengamatan perilaku sim. Hasil pengukuran laporan diri terhadap 232 mahasiswa telah memenuhi kaidah psikometris baik dari segi reliabilitas maupun validitas. Hasil pengamatan terhadap perilaku sim yang dikendalikan 48 mahasiswa juga telah memadai dari segi reliabilitas dan validitas. Ditemukannya pola berlawanan antara pengerjaan kegiatan akademik pada dunia nyata dan dunia The Sims 2, dimaknai sebagai bukti adanya perbedaan nilai dasar serta perwujudan mekanisme pertahanan diri. Penambahan prediktor berupa pola bermain The Sims 2 berhasil meningkatkan daya prediksi terhadap latensi penyelesaian skripsi.
Kata kunci: metode pengukuran majemuk, penunda-nundaan, prokrastinasi, skripsi, Teori Motivasi Temporal, The Sims.
Procrastination measurement has been conducted since 1980s (Schouwenburg, Lay, Pychyl, & Ferrari, 2004). Its theoretical framework was comprehensively developed in about two decades since its inception (Steel, 2002; van Eerde, 2003). The theoretical frame-work were developed by Steel and König (2006), based on Temporal Motivation Theory (TMT).
TMT approach believes that thesis writing procrastination happens due to the low level of its subjective utility (Lowenstein & Prelec, 1992). Subjective utility tends to decline temporarily when the deadline is far in the future, and return to its original level when the deadline is near. This understanding was supported by the graduation record in the Faculty of Psychology, Universitas Surabaya (FP UBAYA) in academic year 2000-2007. About 59.3% of 1502 graduates completed thesis writing in the last month of the graduation registration deadline.
(usually called time delay). Those four were assumed to interact synergistically (multiplicative).
Steel (2007) and Steel and König (2006) proposed two important things in procrastination measurement. The first is the importance of measuring four TMT’s components simultaneously as a validation of TMT (Tuckman, 1991). The second thing is procrastination measurement using behavior observation method, especially with the assistance of a computer game known as The Sims. As far as the author knows, until the start of this study, there is not any single/sole instrument, especially as a self-report, which was constructed based on TMT, as it was also personally admitted by Steel (2007). One of the reasons is the recentness of TMT (Gröpel & Steel, 2008; Steel & König, 2006).
In order to concentrate on the focus of this study, there were some constraints (boundaries) about the theoretical framework, procrastination domain, and subject. Theoretical framework was developed upon Temporal Motivation Theory (TMT). Procrastination domain covers thesis completion, due to five considerations. The first is theo-retical fitness of task as behavioristic indicator of procras-tination (Steel, 2007). The second is high level in frequency (Kingofong, 2004). Next, the third is universality of the problem (Clark & Hill, 1994; Jaradat, 2004; Lovitts & Nelson, 2000; Owens & Newbegin, 2000; Popoola, 2005; Yaabub, 2000). The fourth is huge losses (Arini, 2006; Kohun & Ali, 2005; “Sejumlah PTS Diduga,” 2006; “Depdiknas Sulit Atasi,” 2005; Umam, 2005). Finally, the fifth is pressing need of problem solving (Braunstein, 2004; Darmono & Hasan, 2003; Good, 2002; Indriati, 2003; Lang, 2005; Varney, 2003). The subjects employed here are undergraduate students. This restriction was taken due to three considerations: (a) the largest population, (b) higher group’s homogeneity, compared to the master and doctoral students, and (c) high variation in measurement objects and methods. The problem statement was ”Whether the procrastination instruments have fulfilled the psychometric principles as psychological measurements.” This question arises from the purpose to develop instruments, using self-report and beha-vior observation methods. There were two benefits, enrich-ment of procrastination nomological network and availability of new instrument to measure thesis writing procrastination.
Thesis Writing Procrastination
Definition of Procrastination
Procrastination happens due to low level of sub-jective utility (Gröpel & Steel, 2008; Steel, 2007; Steel
& König, 2006). Procrastination is defined as an incli-nation to prolong an intended task due to the low level of subjective utility. Delay in doing an easy, violating personal value, and low time delay is not procrastination.
Measurement of Procrastination
Self-Report.
Low correlation between results of procrastination measurements (Wadkins, 1999), was indicators of definition and indicator dissimilarity (Milgram & Naaman, 1996; Milgram, Dangour, & Raviv, 1992). Correlation between Adult Inventory of Procrastination (AIP) and Decisional Procrastination Questionnaire (DPQ) were only r = .40 (Steel, 2003). It happens due to dissimi-larity in the focus of measurement, which is task procras-tination and decisional procrasprocras-tination (Vestervelt, 2000). Two common problems in using a self-report to measure procrastination are criterion validity (Ferrari, Johnson, & McCown, 1995) and construct validity (Steel, 2003). Threats toward criterion validity emerge due to weak theoretical framework (van Eerde, 2003; Chu & Choi, 2005; Ferrari, 1993). Threats to construct validity emerge from the confusion in defining procras-tination, delay, and time management (Steel, 2003).
Behavior Observation. Procrastination study usually takes place in the academic setting, from quizzes, term paper, attendance, participation in research, until receiving academic titles (Elvers, Polzella, & Graetz., 2003; McKean, 1990; Milgram, Mey-Tal, Levison, 1998; Muszynski & Akamatsu, 1991; Gunawinata, Nanik, & Lasmono, 2008; Steel, 2003; Tuckman, 1996). Fortunately, decision to use academic task as indicators was appropriate with four criteria which were proposed by Steel (2003), (a) decision to carry out the task, (b) clear time frame, (c) negative result, and (d) ability to predict risk for not doing (delay in doing the task).
THE SIMS 2
Similarity between The Sims World and daily life are not coincidental. The Sims creator (Will Wright) admit-tedthat he had studied and applied psychology in study-ing and designstudy-ing The Sims and The Sims 2 (Kosak, 2004). He coined simology as a term to reflect Sim’s psychology (Kramer, 2005).
Player’s Self-Projection in
The Sims
Griebel, 2006), reflected through similarities in appearances, habits, and values (Curlew, 2005; Sicart, 2005).
Players can also try out unusual activities. Some players use their Sim to do “bad” things, which violate social norms or personal values (Griebel, 2006), such as having affairs or hurting another Sim. From the perspec-tive of Schwartz Basic Value (1992, 1994, 2006, 2007), inclination to try new things was based upon Openness to Change value structure. This value structure consist three basic value, Hedonism, Stimulation, and Self-Direction. Sim’s behavior might be perceived as adaptation, consciously or unconsciously. As a conscious action, those efforts were based upon Conservation value structure (Schwartz, 1992, 2007). Unconscious adaptation was often labeled as defense mechanism (Gleser & Ihilevich, 1969; Zeigler-Hill & Pratt, 2007)
The Sims as a Psychological Measurement
Griebel (2006) reported statistically significant correlation between Big Five personality profile and Schwartz Value Survey with The Sims game play pattern. A person with high neuroticism level tends to postpone paying taxes, change career, and insult another Sim. Players with high openness to experiences tend to let their Sim spend more money and do pleasant things. Players who gave high value for wealth tend to acknowledge the importance of having more money for their Sim.
There are some problems in using The Sims as a psychological measurement. First, there are chances that players manipulate their game play. Second, there are difficulties to get response, due to facility constraints or lengthy participation (Griebel, 2006).
Temporal Motivation Theory
Components
TMT consists of five components, subjective utility (tingkat kegunaan subjektif = TKS), expectancy (harapan keberhasilan = HK), value (nilai = N), sensitivity to delay (kepekaan pada penundaan = KP), and time delay (waktu tunda = WT). Inter-component relations are presented at formula 1 (König & Steel, 2006; Steel, 2007; Gröpel & Steel, 2008).
) infinite number when WT reach 0 (zero)
Subjective utility in the TMT approach categorized as multifaceted construct(Carver, 1989; Hull, Lehn, & Tedlie, 1991). Carver stated there were two approaches in perceiving multifaceted construct, as latent variable model or as multiplicative model. Hull, Lehn, and Tedlie have suggested the third model – the additive model. This model is a combination of those two previous models. This approach proposes that each component has its own unique contribution, but rejecting inter-component multiplicative interaction.
In multiplicative model, correlation tests using multiplicative composite scores are prohibited (Bagozzi, 1984; Busemeyer & Jones, 1983; Evans, 1991; Lubinski & Humphreys, 1990). Those scores conceal uniqueness of each facet and miss out the most important information regarding the existence of multiplication effect (J. Cohen, P. Cohen, West, & Aiken, 2003). Hierarchical linear regression/HLR was considered as a more appro-priate statistical data analysis technique.
Application of TMT in Thesis Writing
Procrastination
In TMT, subjective utility should have large nega-tive correlation with procrastination. It means inter-action pattern between TMT components and procras-tination was contradictory. Some components, which positively correlated with subjective utility, were turn into having positive correlation with procrastination. Empirical framework is presented at Appendix A.
Standardized Instrument to Measure TMT
Components
Search for standardized instruments was restricted to value and sensitivity to delay. It happens because those two components are general and relatively stable constructs (Elliot, 2002; Lay & Silverman, 1996; Lay, Kovacs, & Danto, 1998).
2003). PVQ has been translated into 21 languages (Schwartz, 2003), including Bahasa Indonesia (Hardman & Santosa, 2008; Prameswari & Herabadi, 2007; Widya-ningsih, & Wulandari, 2007). In the end, it was decided to use PVQ as item reference source for value component. Sensitivity to delay. Conceptually, this TMT com-ponent has strong connection with perseverance and self-control (Burns, Dittmann, Nguyen, & Mitchelson, 2000; Carden, Bryant, & Moss, 2004; Ferrari, Parker, Ware, 1992; Green, 1982; Rizvi, 1998; Rizvi, Prawita-sari, & Soetjipto, 1997). Both constructs were measurement aspects of conscientiousness in the Big Five personality profile (Johnson & Bloom, 1995). As a result, search for item reference sources were focused on Big Five standardized instrument (Schouwenburg & Lay, 1995; Surijah & Sia, 2007).
The search for standardized instrument resulted twelve Big Five standardized instruments. Eight of those twelve instruments have more than 100 items. Scale with largest items is the Global Personality Inventory,whichconsists 300 items (Schmidt, Kihm, & Robie, 2002). Finally, the Big Five Inventory (BFI) was chosen due to the small number of items, adequate length of the items, and good internal reliability.
Procrastination Conceptual Model
Using TMT
Real World: Thesis Writing Procrastination
Steel (March 14th, 2010, personal communication) stressed
that four TMT components need not be correlated because they weren’t indicators of a single latent variable (Appendix B). TMT components assumed to interact synergistically in determining subjective utility (Gröpel & Steel, 2008; Steel, 2007; Steel & König, 2006). Nevertheless, Steel also admitted that contradictory results often acquired in structural model evaluation. He even suggested a thorough model evaluation (March 21, 2010, personal communication). Steel’s suggestion (2010) was accommodated and manifested in three structural models. Finally, the most supported model is a combination of latent variable and additive model (Appendix C).
The Sims 2 World
: Academic Procrastination
In The Sims,Simcan only execute one order at a time. It means, there are always activities that was brought forward and delayed. TMT suggested that determination of activities order was based upon their subjective utility.
The Sims 2 Game Play Pattern Scale has been de-veloped to complement understanding about Sim’s procrastination. This scale has three components, Sim’s control (pengendalian Sim = PS), Sim’s academic performance (prestasi akademik = PA), and self-projection (proyeksi diri = PD). PA component is developed to measure the subjective utility of Sim’s academic activity. Higher subjective utility resulted in higher duration and lower latency of academic activity, and in higher academic achievement/general procrasti-nation scale = GPS (Appendix D).
Real World and
The Sims 2 World
:
Multi-methods Measurement
Results of procrastination measurement using self-report are expected to be aligned with Sim’s behavior observation. Both of them are also expected to be aligned with measurement results using standardized instruments and thesis writing latency (Appendix E). Results of multi-method measurement of thesis writing procrastination were expected to reveal contradictory pattern between procrastinators and non-procrastinators. At procrastinators' group (high score on TKS), self-report results were expected to correlate positively with Sim’s behavior observation. In contrast, at the non-procrastinator group (low score on TKS), self-report’s result were expected to correlate negatively with Sim’s behavior observation. This condition is believed to be embedding at value incongruence and defense mechanism.
Hypotheses
Based upon previously presented theoretical considerations and conceptual models, a major hypothesis and five minor hypotheses were proposed. Major hypothesis: Thesis writing procrastination measurements based on TMT have fulfilled psycho-metric principles as psychological measurements. Minor hypotheses:
1) Self-report has good internal reliability
2) Self-report results have internal structure that is aligned with theoretical framework.
3) Measurement using self-report has good construct validity.
4) Measurement using self-report has good criterion validity
5) Observation of Sim’s behavior has good internal reliability.
7) Observation of Sim’s behavior has good criterion validity.
8) Multi-method measurement has good construct validity. 9) Multi-method measurement has good criterion validity.
Method
Identification and Operation of Variable
Thesis writing procrastination is defined as inclina-tion to prolonged thesis writing due to low level of subjective utility. This construct was operated into score of thesis subjective utility (tingkat kegunaan subjektif skripsi = TKSS) and duration and latency of academic activity in the Sims 2.
Subject
Subjects were undergraduate students at FP UBAYA. Total number of students who were doing their thesis writing was 357 (March 7, 2007, Iswahyudi as the manager of the administration unit at FP UBAYA, personal commu-nication). The lists already include the students who gradu-ated during the first period of academic year 2007-2008.
Procedures of Scale Development
Scale development procedures were in accordance with the recomendations of the joint Commitee of American Educational Research Association/AERA, American Psychological Association/APA, and Natio-nal Council on Measurement in Education/NCME (1999), Anastasi and Urbina (1997), Kline, (1986), Marnat, 1984, and also Netemeyer, Bearden, and Sharma (2003). These are: (1) construct definition and content domain, (2) blue-print development, (3) item collection and selection, (4) data collection, and (5) data analisis. These procedures were used for both measure-ment methods (Hersen & Bellack, 1988; Appendix F).
Self Report
Scale development might be regarded as explorative, that is, measuring procrastination predisposition in a community (Suryabrata, 1999). Thesis writing procras-tination was manifested as low score of TKSS, which consisted of four components (Appendix G). There were two measurement constraints, procrastination area (thesis writing) and theoretical framework (TMT). Standardized instrument collection was conducted for
value and sensitivity to delay. All items for expectancy and time delay were constructed based on conceptual model and item writing principles (Azwar, 1999; APA, 2010).
In order to speed up data collection and improve accuracy of data processing, a computer-based mea-surement was prepared. The program was named thesis utility test (tes kegunaan skripsi = TKS). This automati-city can reduce data processing period and eliminate chances of typing error. Data collection took place at the end of November until the beginning of December 2007, at Pusat Komputer Edukasi (Puskomed) UBAYA. Measurement results were tested for internal relia-bility and internal structure. Reliarelia-bility testing were conducted using two models, Alpha Cronbach and Mosier composite reliability (1943). All data analysis was performed using non-parametric techniques.
Behavior Observation
In behavior observation, thesis writing procrastina-tion was manifested as predisposiprocrastina-tion to postpone doing academic activities in The Sims 2 world. Observations were conducted on four types of academic tasks, they are, writing term paper, doing assignments, attending classes, and doing final exam.
Observation focused on two components: duration and latency of conducting academic activities. In latency, observations were conducted on time to begin and complete academic task. There were also measure-ments conducted on subject’s game play pattern. Checklists were focused on Sim’s individual and academic profiles. All information was obtained through digital recording of subject’s game play using TechSmith ® SnagIt ©: the Windows Screen Capture Utility (version 8.1.0). This program recorded every image that was presented on the monitor screen during subject's playing period. Image recording took place every 3 seconds, due to very large number of images (more than 3000 images per subject) and size of the file. Data collection using behavior observation took place in the middle of December 2007, at Puskomed UBAYA. Based upon early registration, there were 56 students who wanted to participate. Unfortunately, until the final session of data collection, only 48 subjects (85.714 %) participated in the project.
technical problems reduced number of data to be analyzed statistically.
Statistical techniques used for behavior observation were similar to the statistical analysis of self-report. However, reliability testing for behavior observation was conducted using Spearman-Brown split-half model. As a mono-trait and multi-methods measurement, data analyses were also conducted to test congruence between self-report and behavior observation.
Results
The First Minor Hypothesis: Reliability of
Self-Report
Alpha-Cronbach reliability testing on TKSS ( .834) and PASS-S ( .925) presented at Appendix H. Mosier composite reliability of TKS score is .775. With all reliability indices that already surpass acceptance level, the first minor hypothesis is accepted. Self-report measurements have a good internal reliability.
The Second Minor Hypothesis: Internal
Structure of Self-Report
The measurement model of TKSS (Appendix I) showed large correlation between expectancy and value (r= .960), between value and sensitivity to delay (r = - .770) and between expectancy and sensitivity to delay (r=- .410). In contrast, time delay only has minor and insignificant correlation with the three other compo-nents. The existence of four error covariance at six sub-components (HKP, HKL, NN, NP, KP1, and WT2) indicated the existence of a unique association which is not represented by the four TMT components. However, this model was supported by data, as revealed by the low level of chi square 2= 17.335 (p = .239; DK=14), low level of RMSEA = .032, and high level of CFI = .990.
The Third Minor Hypothesis: Construct
Validity of Self Report
The third minor hypothesis focused on construct validity of the self-report. Supporting evidence for construct validity was confirmed by the high correlation between self-report (TKSS) and standardized procrasti-nation inventory (PASS-S). PASS-S score was extracted with PCA (Principle Component Analysis) procedure using SPSS to get 2 composite scores (PASS-S1 and PASS-S2) in order to get one single PASS-S score.
On the other hand, testing of the multiplicative model was conducted using hierarchical regression analysis/ HLR (Appendix J). Results of HLR have confirmed that addition of multiplicative composite score, as predictors were not statistically significant. It proved that there was not any multiplicative interaction among TMT’s components. It means that the score on a component does not multiply the score on the other components.
Multiplicative model testing was followed by latent variable model testing. Model testing was conducted using partial aggregation approach. The result showed that time delay is not an indicator of thesis writing subjective utility (Appendix K).
The three components of TMT (HK, N, and KP) have large common contribution on PASS-S ( =- .90). Error covariance between HK and N showed unique interaction between components. This covariance came from similarity of measurement object (attitude toward thesis writing).
As previously known that HK, N, and KP were TKSS indicators, model testing were followed by model testing using eclectic approach, which combined the latent variable and the additive model approach. The structural model modification was conducted by eliminating one-way straight line from TKSS toward WT and by adding one straight line from WT to PASS-S. This modification was conducted to measure WT’s contribution on PASS-S (Appendix L).
Model fitness with data can be seen from the low chi square ( 2=10.801; DK=7; p= .148), low RMSEA ( .048), and high CFI ( 2= .980). There were no data supporting additive interaction between TKSS and WT. Meanwhile, WT retained due unique contribution on latency of thesis completion Appendix L).
In summary, the self-report results (TKSS) were used to predict PASS-S score. In other words, the third minor hypothesis was supported. TKSS and PASS-S were two instruments that measured the same construct.
The Fourth Minor Hypothesis: Criterion
Validity of Self-Report
loading of TKSS on WT has made WT’s score could not be added in the computation of KSS score.
− formulated as a combination of KSS and WT.
WT KSS TKSS++= −
The Fifth Minor Hypothesis: The Reliability of
Observation on Sim’s Behavior
The reliability of the observation results (Appendix N) suggested that most reliability indices were not good enough. However, as a whole, the duration of academic activity was still acceptable ( = .728). Therefore, the fifth minor hypothesis can be accepted. It means the duration of academic activities can be considered reliable enough, especially, when the work of four Sims' academic activities were accumulated as one single score.
The result of The Sims 2 Game Play Scale has quite good reliability, especially on Sim's control ( = .753) and self-projection ( = .652). For academic achievement components, reliability index was not good enough ( = .533). It happened due to low correlation of the two items, PA2 and PA3 (r = .081, p>.05), and accumulation of subject response on item PA2. Thirty-three of forty-eight subjects have chosen “Setuju” (S, agree) on item PA2.
There are variations in number of participants between self-report (first until fourth hypothesis) and observation study (fifth until ninth hypothesis). There are only 48 subjects who participated in the observation study, compared to the 232 subjects who completed the self report study. These differences were due to the negligence of most of the participants to follow the observation studies. Unfortunately only 41 subjects had the required complete data. Seven subjects were eliminated from some of the analyses due to technical problems in data collection.
The Sixth Minor Hypothesis: Construct
Validity of Observation on Sim’s Behavior
There were three sources of evidences on observation of Sim’s behavior construct validity, starting from negative correlation with latency of term paper completion (r = - .575, p< .001), positive correlation with Sim’s GPA(r = .577, p< .001), and positive correlation with Sim’s
attitudes to academic achievements (r = .308, p < .05). Among all indicators, the highest correlation was found between the activity duration and Sim’s GPA.
The latency of the term paper completion also significantly correlated with all indicators. Beside the duration of academic activity, the latency of the term paper completion also correlated with Sim’s GPA (r = - .494, p < .001) and attitude to Sim’s academic achieve-ments, especially, with item PA1 (”Berprestasi di
The Seventh Minor Hypothesis: Criterion
Validity of Observation on Sim’s Behavior
Despite having good construct validity, observation on Sim’s behavior does not have strong criterion validity. Almost no significant correlation was found between observation on Sim’s behavior and both criterion (measurement result of procrastination and latency of thesis completion. Significant negative correlation was only found between the latency of term paper completion and the latency of thesis completion (r = - .351, p < .05). Second, there was a negative corre-lation between the subject’s responses on item PA3 (”Sim saya sering membolos kuliah atau kerja sam-bilan”) and the PASS-S score (r = - .258, p = .038). Third, negative correlation was found between the subject’s response on item PA3 and the score PASS-S2 (r = - .249, p = .044). All these weak correlations indicate the low level of criterion validity. Overall, the observations of Sim’s behaviors were not related to the procrastination measurement or the latency of thesis completion.
The Eighth Minor Hypothesis: Construct
Validity of Multi-methods Measurement
Construct validation produces four important informa-tion. First, on procrastinator group, self-report and obser-vation on Sim’s behaviors produced different results. Second, contradictory findings were indicators of basic value dissimilarities and defense mechanisms. Third, self-report results and PASS-S scores were statistically significantly correlated. Fourth, Sim’s checklist and PASS-S measured two different constructs.
The inference that the self-report (TKS) and the observation on Sim's behaviors measured two different constructs has two logical consequences. First, self-report measurement could not be replaced with the observations of Sim’s behavior. Second, self-report results and Sim's behaviors were two different pre-dictors on regression analysis.
The Ninth Minor Hypothesis: Criterion
Validity of Multi-methods Measurement
Correlation testing between the TKSS score and the latency of thesis completion produced statistically significantly negative correlations (Appendix P). On correlation testing involving all subjects (n = 41), the produced correlation was as large as r = - .516 (p < .001). This finding highlighted contradictory associations between the self-report results and the latency of thesis completion. Criterion validation produces four important information. First, the self-report results and the PASS-S score were statistically significantly correlated. Second, the observa-tions of Sim's behaviors were not correlated with the latency of the thesis completion. Third, compared to the PASS-S score, the self-report results correlated more with the latency of the thesis completion. Fourth, the latency of the thesis completion in the real world negatively correlated with the latency of term paper completion in The Sims 2 world. Observation on Sim's behavior were statistically significantly correlated with the latency of Sim’s term paper completion (r = - .351, p = .017), but not statistically significantly correlated with the PASS-S score. As a result, the used criterion for hierarchical regression analysis was only latency of the thesis completion. The predictor was added in the regression analysis using enter method. Missing data was replaced by the means. The results of hierarchical regression analysis was presented in Appendix Q. (Results of the hierarchical regression analysis are available from the author upon request.)
Linear regression analysis produced two important results. First, the best solitary predictor is TKS++ score. Second, addition of latency of Sim’s term paper completion was not a statistically significant prediction on criterion.
Prediction power of TKS++ on the latency of the thesis completion could still be enhanced by addition of subject’s scores on The Sims 2, especially on Sim’s control (PS) component. Addition of predictor could elevate multiple correlation score from .543 to .643 (Appendix R).
Discussion
Empirical Framework of Multi-method
Measurement on Procrastination
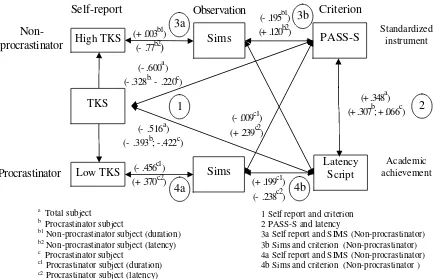
In this section, all the research results were summarized into one conclusion. All attentions focused on the associa-tion pattern between constructs, whether as standardized instruments (PASS-S), new instruments (self-report and observation of Sim’s behavior), or latency of the thesis completion. All information was presented in Figure 1.
Self-report Result and Criterion
On total subject group, self-report results and PASS-S score were negatively correlated (r = - .600, p < .001, n = 48). Self-report results of the total subjects group also negatively correlated with the latency of the thesis completion (r = - .516, p < .001; n = 41). Higher scores accompanied higher scores on the PASS-S and the lower level of the latency of the thesis completion.
The PASS-S Results and the Latency of Thesis
Completion
The procrastination measurement with the stan-dardized instrument positively correlated with latency of thesis writing completion (r = .348, p = .013; n = 41). The higher level of thesis writing procrastination was accompanied by the higher level of latency of thesis completion (longer completion). The positive correla-tion was still founded on observacorrela-tion on non-procras-tinator group (r = .307, p = .077; n = 21), or the procras-tinator group (r = .066, p = .397; n = 18).
Non-procrastinator Group
behaviors. On the other hand, Sim’s behaviors were perceived as exploration and experimentation.
Observation of Sim’s behaviors did not correlate with criterion. The duration of academic activity (r = -0.195, p = .199; n = 21) and the latency of Sim’s term paper direction towards subjective utility of Sim’s academic activity. Subjects who were less appreciative towards thesis writing were the ones who appreciate academic activities in The Sims 2 world.
The reversal of the behavior between the real world and The Sims 2 world on the procrastinator groups indicated two important things. First, Sim’s behaviors
did not reflect players' daily behaviors. Second, the reversal of behavior between the real world and The Sims 2 world were perceived as defense mechanism. The observation of Sim’s behaviors and the latency of the thesis completion were not statistically signify-cantly correlated. The duration of Sim's academic activities (r = .199, p = .222; n = 17) and the latency of Sim's term paper completion (r = - .238, p = .79; n = 17) did not correlate with the latency of the thesis completion. The duration of Sim’s academic activities (r = - .009, p = .484; n = 21) and the latency of Sim's term paper completion (r = .239, p = .148; n = 21) did not correlate also with thesis writing procrastination.
Negative Correlation Between Academic Life in
the Real World and The Sims 2 World
There were three perceptions on negative correlations between academic activities in the real world and The Sims 2 world. First, TMT approach perceived those negative correlations as indicators of contradiction of the real world and The Sims 2 world subjective utility of academic activity. Second, Schwartz's basic value approach perceived those negative correlations as results of contradictory value structure. Thesis writing
Figure 1.
Empirical framework of procrastination measurement
1 Self report and criterion 2 PASS-S and latency
3a Self report and SIMS (Non-procrastinator) 3b Sims and criterion (Non-procrastinator) 4a Self report and SIMS (Non-procrastinator) 4b Sims and criterion (Non-procrastinator )
Sims
PASS-S
Procrastinator subject
b1 Non-procrastinator subject (duration) b2
Non-procrastinator subject (latency) c Procrastinator subject
c1
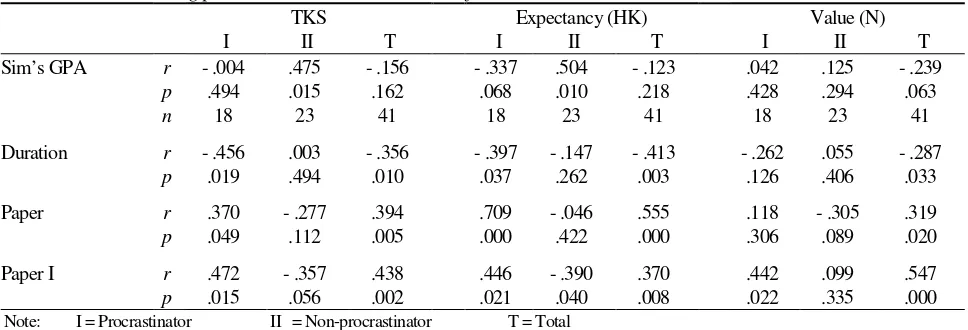
was based on self-improvement, while Sim's academic activities were based on conservation. Third, psychoanalytic approach perceived those negative values as proofs of defense mechanisms. This insight was supported by differences in correlation patterns, found between procrastinator and non-procrastinator (Table 1).
When all the minor hypotheses results were combined with the empirical framework, it can be concluded that all of the measurements have fulfilled psychometric principles, especially internally. Self-report results were aligned with two criteria (the PASS-S and the latency of thesis completion). On the other hand, the observation of Sim's behaviors did not correlate with the criteria set.
Finally, the major hypothesis was accepted. The self-report result has fulfilled all the required psychometric principles. On the other hand, the observations of Sim's behavior were only internally valid. The observation results of Sim's behaviors were not statistically significantly correlated with the PASS-S score or the latency of the thesis completion.
Limitations
Theoretical Framework
Theoretical preposition of TMT that subjective utility was multiplicative composite of its components was not supported by the data. The interaction pattern of TMT’s component is additive. Moreover, although TMT approach could suggest that negative correlation was caused by basic value dissimilarity, it could not ensure which values were involved. This limitation was compensated by the application of Schwartz's basic value and psychoanalytic approach.
Research Method
Data collection using observation of Sim's behavior was constrained by dependence on facilities (the computers, The Sims 2 software, and the room availability). Another constraint was the length of data collection. Length duration provokes subject’s refusal to participate.
The last limitation comes from the criteria set. The usage of the thesis completion as one of the criteria triggers problem in the aspect of reliability of measure-ment. It could not be assured that the delay of thesis completion would be repeated in the future.
Data Analysis
One of the limitations came from the distribution of scores that did not satisfy the assumption of the normal distribution. This condition has been overcome by using non-parametric data analysis techniques.
Conclusion and Suggestion
Conclusion
Self-report results have high internal reliability and inter-nal structure that are in line with theoretical framework. The observations of Sim's behaviors also have good internal reli-ability. Internally, multi-method measurements have produ-ced psychometric principles. Unfortunately, only self-report results statistically significantly correlated with criteria.
Suggestions
Theoretical background. TMT approach can explain the association between the subjective utility
Table 1.
Thesis writing procrastination and academic life in The Sims 2TKS Expectancy (HK) Value (N)
I II T I II T I II T
Sim’s GPA r - .004 .475 - .156 - .337 .504 - .123 .042 .125 - .239
p .494 .015 .162 .068 .010 .218 .428 .294 .063
n 18 23 41 18 23 41 18 23 41
Duration r - .456 .003 - .356 - .397 - .147 - .413 - .262 .055 - .287
p .019 .494 .010 .037 .262 .003 .126 .406 .033
Paper r .370 - .277 .394 .709 - .046 .555 .118 - .305 .319
p .049 .112 .005 .000 .422 .000 .306 .089 .020
Paper I r .472 - .357 .438 .446 - .390 .370 .442 .099 .547
p .015 .056 .002 .021 .040 .008 .022 .335 .000
and the task working pattern (duration and latency). This approach could be further developed in psycho-logical research and measurement. However, rejection on multiplicative model still needs further exploration. Research method. Theoretical assumption about multiplicative model can only be tested in true experiment, when measurement of fourth TMT components was adjusted to the area of procrastination. Besides, it is recommended to improve the similarity of situation and condition which were being faced by each subject. All subjects should deal with the series of exactly same scenarios, to reduce effects of situational variables.
Acceleration of thesis completion. Steel (2007) suggested some advice to overcome procrastination using TMT approach. First, overcoming procrastination can be done via improving expectancies. Second, improving task value may also be the option. Third, procrastination can be conquered by reducing sensitivity to delay. Fourth, reducing time delay can be chosen as an alternative to conquer procrastination. All the advice was aimed to improve subjective utility of thesis writing, in order to reduce procrastination and thesis can be completed in time or faster.
References
American Educational Research Association, American Psychological Association., & National Council on Measurement in Education. (1999). Standards for educational and psychological testing. Washington DC: American Psychological Association.
American Psychological Association. (2010). Publication manual of the American Psychological Association (6th ed.). Washington, DC : Author.
Anastasi, A. & Urbina, S. (1997). Psychological testing (7th ed.). New York: Prentice Hall.
Arini, S. (2006). Jalur cepat bikin makalah.Majalah Suara Mahasiswa UI, 21(22) [On-line], Retrieved from http://suma.ui.edu/cetak.php?id = 3
Azwar, S. (1999). Penyusunan skala psikologi. Yogyakarta: Pustaka Pelajar.
Bagozzi, R. P. (1984). Expectancy-value attitude models: An analysis of critical measurement issues. International Journal of Research in Marketing, 1, 295-310.
Braunstein, J. W. (2004). Simple strategies for conquering procrastination while writing Your Dissertation or Thesis. Simple Strategies, 1(4). Retrieved from http:// OnlineResourceLibrary_03.asp
Burns, L. R., Dittmann, K., Nguyen, N. L., & Mitchelson, J. K. (2000). Academic procrastination, perfectionism, and
control: Association with vigilant and avoidant coping. Journal of Social Behavior and Personality, 15(5), 35-46. Busemeyer, J. R., & Jones, L.E. (1983). The analysis of
multiplicative combination rules when the causal variables are measured with error. Psychological Bulletin, 88, 237-244.
Bussey, L. H. (2006). Measuring the instructional leadership values and beliefs of school leaders. Values and Ethics in Educational Administration, 4(3), 1-8.
Carden, R. , Bryant, C. & Moss, R. (2004) Locus of control, test anxiety, academic procrastination, and achievement among college students. Psychological Reports, 95, 581-582.
Carver, C. S. (1989). How should multifaceted personality constructs be tested? Journal of Personality and SocialPsychology, 56, 577-585.
Chu, A. H. C., & Choi, J. N. (2005). Rethinking procrastination: Positive effects of “active” procrastination behavior on attitudes and performance. The Journal of Social Psychology, 145(3), 245-264. Clark, J. L., & Hill, O. W. (1994). Academic procrastination
among African-American college students. Psycho-logical Reports, 75(2), 931–936.
Cohen, J., Cohen, P., West, S. G., & Aiken, L. S. (2003). Applied multiple regression/ correlation analysis for the behavioral sciences (3rd ed.). Mahwah, NJ: Lawrence Erlbaum Associates.
Curlew, A. B. (2005). Liberal Sims? Simulated difference and the commodity of social diversity. Paper presented at the DiGRA 2005 "Changing Views: Worlds in Play" International Conference, June 16th - 20th 2005. Vancouver, Canada.
Darmono, & Hasan, A.M. (2003). Menyelesaikan skripsi dalam satu semester. Jakarta: PT Grasindo
Depdiknas sulit atasi jual-beli gelar. (2005, August 12). Retrieved from Tempo Interaktif, http://www.tempoin teraktif.com/hg/nasional/2005/08/12/ brk, 2005 0812-65236,id.html.
Elliot, R. (2002). A ten-year study of procrastination stability. Unpublished master’s thesis, University of Louisana, Monroe.
Elvers, G. C., Polzella, D. J., & Graetz, K. (2003). Procras-tination in online courses: Performance and attitudinal differences. Teaching of Psychology30(20), 159-162. Evans, M. G. (1991). The problem of analyzing
multipli-cative composites: Interactions revisited. American Psy-chologist, 46, 6-15.
Ferrari, J., Johnson, J., & McCown, W. (1995). Assessment of academic and everyday procrastination: The use of self-report measures. In J. Ferrari, J. Johnson, & W. McCown (Eds.), Procrastination and task avoidance theory, research and treatment. New York: Plenum Press. Ferrari, J. R. (1993). Christmas and procrastination:
Expla-ining lack of diligence at a "real-world" task deadline. Personality and Individual Differences,14(1), 25-33. Gleser, G. C., & Ihilevich, D. (1969). An objective
instrument for measuring defense mechanisms. Journal of Consulting & Clinical Psychology, 33(1), 51-60. Good, C. E. (2002). Factors affecting dissertation progress.
Unpublished dissertation, University of Arkansas. Green, L. (1982). Minority students’ self-control of
procrastination. Journal of Counseling Psychology, 29, 636-644.
Griebel, T. (2006). Self-Portrayal in a simulated life: Projecting personality and values in The Sims 2. Game Studies, 6(1). Retrieved from http://gamestudies.org/06 01/articles/griebel
Gröpel, P., & Steel, P. (2008). A mega-trial investigation of goal setting, interest enhancement, and energy on procrastination. Personality and Individual Differences , 45, 406-411.
Gunawinata, V.A.R., Nanik, & Lasmono, H.K. (2008). Perfeksionisme, prokrastinasi akademik, dan penyele-saian skripsi Mahasiswa. Anima, Indonesian Psycho-logical Journal,23(3), 256-276.
Hardman, & Santosa, E.M. (2008). Uji validitas dan reliabilitas portrait value questionnaire (PVQ) schwartz. Skripsi, tidak diterbitkan. Jakarta: Fakultas Psikologi Universitas Katolik Atma Jaya. [Online]. Retrieved from http://lib.atmajaya.ac. id/default.aspx?tab ID = 61&src = k&id = 146384 Hersen, M., & Bellack, A.S. (1988). Dictionary of behavioral
assessment techniques. New York: Pergamon Press. Hull, J. G., Lehn, D. A., & Tedlie, J. C. (1991). A general
appro-ach to testing multifaceted personality constructs. Jour-nal of PersoJour-nality and Social Psychology, 61, 932-945. Indriati, E. (2003). Menulis karya ilmiah. Jakarta: PT
Gramedia Pustaka Utama.
Jaradat, A.K.M. (2004). Test anxiety in Jordanian students: Measurement, correlates, and treatment. Unpublished doctoral dissertation, Philipps-University Marburg, Vor-gelegt von.
Johnson, J. L. & Bloom, A. M. (1995). An analysis of the contribution of the five personality to variance in academic procrastination. Personality and Individual Differences, 18(1), 127-133.
Kingofong, S. M. (2004). Penghambat pada pengerjaan skripsi. Unpublished thesis, Faculty of Psychology Universitas Surabaya.
Kline, P. (1986). A handbook of test construction: Introduction to psychometric design. London: Methuen & Co. Ltd.
Kohun, F., & Ali, A. (2005). Isolation feelings in doctoral programs: A case study. Issues in InformationSystems, 6(1), 379-385.
Kosak, D. (2004). Exclusive Hands-On: The Sims 2. Retrieved from http://pc.gamespy.com/pc/the-sims-2/540847p1.html Kramer, G. (2005) The Sims 2: University, the official
strategy guide. California: Prima Games
Lang, K. M S. (2005). Practical tips for completing your psychology dissertation: A recent graduate student’s perspective. Washington, DC: American Psychological Association of Graduate Students (APAGS).
Lay, C., & Silverman, S. (1996). Trait procrastination, anxiety, and dilatory behavior. Personality and Individual Differences, 21(1), 61-67.
Lay, C. H.., Kovacs, A., & Danto, D. (1998). The relation of trait procrastination to the big-five factor conscientious-ness: An assessment with primary-junior school children based on self-report scales. Personality and Individual Differences, 25, 187-193.
Lindeman, M,, & Verkasalo, M. (2005). Measuring values with the short Schwartz’s value survey. Journal of Personality Assessment, 85(2), 170–178.
Loewenstein, G., & Prelec, D. (1992). Anomalies in inter-temporal choice: Evidence and an. interpretation. Quarterly Journal of Economics, 107, 573-598.
Lovitts, B., & Nelson, C. (2000). The hidden crisis in graduate education: Attrition from Ph.D. Programs [On-line]. Available at: http://www.aaup.org/publications/Acade me/2000/00nd/ND00LOVI.HTM
Lubinski, D., & Humphreys, L.G. (1990). Assessing spurious "moderator effects": Illustrated substantively with the hypothesized ("synergistic") relation between spatial visualization and mathematical ability. Psychological Bulletin, 107, 385-393
Marnat, G. G. (1984). Handbook of psychological measure-ment. New York: Van Nostrand Reinhold Company Inc. McKean, K. J. (1990). An investigation of academic
procras-tination as a behavioral manifestation of learned helplessness. Unpublished PhD dissertation, Seton Hall University
Milgram, N. A., & Naaman, N. (1996). Typology in procrastination. Personality and Individual Differences, 20(6), 679-683.
Milgram, N. A., Dangour, W., & Raviv, A. (1992). Situational and personal determinants of academic procrastination. Journal of General Psychology, 119(2), 123-133. Mosier, C. I. (1943). On the reliability of a weighted
Muszynski, S.Y., & Akamatsu, T. J. (1991). Delay in comple-tion of doctoral dissertacomple-tion in clinical psychology. Profes-sional Psychology: Research and Practice, 22(2), 119-123. Netemeyer, R. G., Bearden, W. O., & Sharma, S. (2003).
Scaling procedures: Issues and applications. Thousand Oaks: Sage Publications Inc.
Owens, A.M., & Newbegin, I. (2000). Academic procrastination of adolescents in English and mathematics: Gender and personality variations. In J.R. Ferrari, & Pychyl, T.A. (Eds.), Procrastination: Current issues and new directions. [Special Issue]. Journal of Social Behavior and Personality, 15(5), 111–124.
Popoola, B.I. (2005). A study of the relationship between procrastinating behavior and academic performance of undergraduate students in a Nigerian university. The African Symposium: An On-line Journal of African Educational Research Network.
Prameswari, E., Herabadi, A.G. (2007). Perbandingan gambaran nilai antara remaja yang bermain video game dengan remaja yang tidak bermain video game. Unpublished thesis, Faculty of Psychology Universitas Katolik Atma Jaya. [Online]. Retrieved from http://lib.atma jaya.ac.id/default.aspx?tabID = 61&src = k&id = 151577 Schmit, M. J., Kihm, J. A., & Robie, C. (2002). The global
personality inventory. In B. De Raad & M. Perugini (Eds.), Big Five assessment (pp. 195-236). Göttingen, Germany: Hogrefe & Huber.
Schouwenburg, H. C., Lay, C. H., Pychyl, T. A., & Ferrari, J. R. (2004). Counseling the procrastinator in academic settings. Washington, DC: American Psychological Association.
Schouwenburg, H. C., & Lay, C. H. (1995). Trait procrastination and the big five factors of personality. Personality and Individual Differences, 18, 481– 490. Schwartz, S. H. (1992). Universals in the content and
structure of values: Theoretical advances and empirical tests in 20 countries. In M. P. Zanna (Ed.), Advances in experimental social psychology (pp. 1-65). San Diego, CA: Academic Press.
Schwartz, S. H. (1994). Are there universal aspects in the structure and contents of human values? Journal of Social Issues, 4, 19-45.
Schwartz, S. H. (2003). A proposal for measuring value orientations across nations [Chapter 7 in the Questionnaire Development Report of the European Social Survey]. Retrieved from: http://www.europeansocialsurvey.org/ index.php?option= com_docman&task = doc_view&gid = 126&itemid = 80àESS
Schwartz, S. H., Melech,G., Lehmann, A., Burgess, S., & Harris, M. (2001). Extending the cross-cultural validity
of the theory of basic human values with a different method of measurement. Journal of Cross Cultural Psychology, 32, 519-542.
Schwartz, S. H. (2006). Basic human values: Theory, measurement, and applications. Revue Française de Sociologie, 47(4) 249-288
Schwatz, S. H. (2007). Universalism values and the inclusiveness of our moral universe. Journal of Cross-Cultural Psychology, 38; 711-728.
Sejumlah PTS diduga jual beli gelar magister. (2006, January 28). Retrieved from Suara Pembaruan
[On-line], http://www.suarapembaruan.com/News/
2006/01/28/ Kesra/kes 06.htm.
Sicart, M. (2005) "Family Values: Ideology and the Sims." Level Up. Proceedings of the Digital Games Research Conference 2003. Ed. Marinka and Joost Raessens Copier. Utrecht: University of Utrecht, 2003. CD-Rom. Steel, P., & König, C. J. (2006). Integrating theories of
moti-vation. Academy of Management Review, 31(4); 889-913. Steel, P. (2007). The nature of procrastination: A
meta-analytic and theoretical review of quintessential self-regulatory filure. Psychological Buletin, 133(1), 65–94. Steel, P. D. G. (2002). The measurement and nature of
procrastination. Unpublished master’s thesis, University of Minnesota.
Steel, P. D. G. (2003). Nature of procrastination. Unpublished article. Calgary, Alberta, Canada: Univeristy of Calgary. Surijah, E. A., & Sia, T. (2007). Mahasiswa versus tugas: Prokrastinasi akademik dan conscientiousness. Anima, Indonesian Psychological Journal, 22(4), 352-374. Suryabrata, S. (1999). Pengembangan alat ukur psikologis.
Jakarta: Direktorat Jenderal Perguruan Tinggi, Departemen Pendidikan dan Kebudayaan.
Tuckman, B. W. (1991). The development and concurrent validity of the procrastination scale. Educational & Psychological Measurement, 51(2), 473-480.
Tuckman, B.W. (1996). Using spot quizzes as an incentive to motivate procrastinators to study. Paper presented at the Annual Meeting of the American Educational Research Association, New York, April 8-13, 1996.
Umam, A. K. (2005). Kemunafikan intelektual. Suara Merdeka, 28 April 2005. Retrieved from http://www. suaramerdeka.com/harian/0504/28/opi5.htm
Van Eerde, W. (2003). A meta-analytically derived nomological network of procrastination. Personality and Individual Differences, 35, 1401–1418
Vestervelt, C.M. ( 2000). An examination of the content and construct validity of four measures of procrastination. Unpublished master’s thesis, University of Carleton, Ottawa, Ontario, Canada.
Wadkins, T.A. (1999). The relation between self-reported procrastination and behavioral procrastination. Unpublished dissertation, University of Nebraska. Widyaningsih, A., & Wulandari, M.T.A. (2007).
Perban-dingan gambaran nilai antara remaja yang clubbing dan remaja yang tidak clubbing. Unpublished Thesis,
Faculty of Psychology, Universitas Katolik Atma Jaya. [Online]. Retrieced from http://lib.atmajaya.ac.id/default .aspx?tabid=61&src=k&id=134733
Yaakub, N. F. (2000). Procrastination among students in institutes of higher learning: Challenges for k-economy. Retrieved from http://mahdzan.com/papers/procrastinate/ Zeigler-Hill,V., & Pratt, D.W. (2007). Defense styles and
the interpersonal circumplex: The interpersonal nature of psychological defense. Journal of Psychiatry, Psychology, and Mental Health, 1(2), 1-15.
Appendix A
Correlation of Procrastination and TMT Components
Variable Correlation Confidence interval (95%)
Expectancy (HK)
Self-efficacy Negative - .46* - .42, - .34*
Value (N)
Need for achievement Negative - .55* - .40, - .31*
Sensitivity to delay (KP)
Impulsiveness Positive .52* .37, .46*
Time-delay (WT)
Goal setting Negative - .23** - **
Note. *
Steel (2007) **
Gröpel & Steel’s primary study (2008), which did not report the confidence interval
Appendix B
Measurement Model of Thesis Writing Procrastination
HKP : Expectancy-proposal KP1 : Sensitivity to delay-prudence
HKL : Expectancy-report KP2 : Sensitivity to delay-persistence
NNk : Value-pleasure WT1 : Delay-1 semester
NP : Value-achievement WT2 : Delay-2 semester
Expectancy
HKLe1
1 1HKP
e2
1 1Value
NPe3
NNk
e4
1 1
1 1
Sensitivity to delay
KP2e5
KP1
e6
1 1
1 1
Delay
WT2e7
WT1
e8
1 1
Appendix C
Structural Model of Thesis Writing Procrastination
Appendix D
Conceptual Model of Academic Activities (The Sims 2) Value
eV
Expectancy eE
1 1
Delay eD
Sensitivity to Delay eSD
1 1
Utility
PASS-II 1 eP2
PASS-S
eP
1
1
PASS-I 1 eP1
1
Latency 1 eLat
Duration
Latency
(+)(-)
(-)
The Sims'
gameplay pattern
Academic activities
Attitude towards
Sims' academic
achievement
Sim’s GPA
(+)(+)
(-)
Appendix E
Conceptual Model of Thesis Writing Procrastination Measurement
Appendix F
Flowchart of Instrument Development
Definitions and instruments
Instrument blueprint development
Item collection and selection
Data collection
Data analysis
Suitable with TMT
(Steel, 2007) Rejected
No
Yes
Suitable with TMT components
(Steel, 2007)
Rejected
No
Following item development
guidelines (Azwar, 1999)
Rejected
No
Yes
Yes
Following psychometric and statistics standards
Rejected
No
Yes
Data qualifying acceptance criteria
Sims
PASS-S
Latency of
Thesis
Standardized
instruments
(-)(-)
(-)
(+)
Academic
performance
Self-Report
Sims
(-)(+) (+)
Observation
Criterion
High
Low
Utility
(-) (+)
Non-procrastinator
Appendix G
Blueprint of Thesis Subjective Utility Instrument
Measurement components (TMT notation) Number of items
Expectancy (HK) 10
Value (N) 9
Sensitivity to delay (KtP) 9
Time Delay(WT) 2
Appendix H
Reliability of the Measurement Results of Thesis Writing Procrastination
Instrument Construct Item Alpha Sx Sx (item) Se Se (item)
TKS Thesis subjective utility 30 .834 12.440 .415 5.068 .168
PASS-S1 Thesis writing procrastination intensity 12 .824 8.218 .685 3.447 .287
PASS-S2 Thesis writing procrastination reasons 26 .855 11.545 .444 4.396 .169
PASS-S Thesis writing procrastination 38 .925 32.489 .854 8.897 .234
Note. TKSS : Thesis subjective utility
Appendix I
Measurement Model of TKSS (Partial Disaggregation)
Chi Square = 17.335
DF = 14
Prob. = .239
CMIN/DF = 1.238 GFI = .982
AGFI = .954
TLI = .980
CFI = .990
RMSEA = .032 Standardized estimates HK
.54
HKL
e1 .73
.34
HKP
e2 .58
N
.07
NP
e3
.09
NNk
e4
.26 .29
KP
.56
KP2
e5
.51
KP1
e6
.75 .72
WT
.59
WT2
e7
.37
WT1
e8
.77 .61
.96
-.41
-.05 -.77
.01
.04 .28
.45
-.24
Appendix J
Summaries of Hierarchical Linear Regression Model (PASS-S )
Model R R Square Adjusted R Square Std. Error
of the Estimate
Change Statistics
R Square Change F
Change df1 df2
Sig. F Change
1 .471(a) .222 .208 .889 .222 16.167 4 227 .000
2 .500(b) .250 .216 .885 .028 1.367 6 221 .229
3 .509(c) .259 .211 .888 .009 .681 4 217 .606
4 .514(d) .264 .213 .887 .005 1.564 1 216 .212
Note:
a. Predictors: (Constant), D, SD, E, V
b. Predictors: (Constant), D, SD, E, V, D_x_SD, V_x_SD,V_ x_D, E_x_V, E_SD, E_D
c. Predictors: (Constant), D, SD, E, V, D_x_SD, V_SD, V_D, E_x_V, E_SD, E_D, E_x_V_SD, V_SD_D, E_x_V_D, E_SD_D
d. Predictors: (Constant), D, SD, E, V, D_x_SD, V_SD, V_D, E_x_V, E_SD, E_D, E_x_V_SD, V_SD_D, E_x_V_D, E_SD_D, E_x_V_SD_D e. Dependent Variable: PASS_lt
Appendix K
Structural Model of TKSS and PASS-S (Latent Variable 1)
Utility
.34
Sensitivity to delay
e3
-.58 .21
Value
e2
.46.24
Expectancy
e1
.49.00
Delay
e4
.80
PASS-S
.39
P1
e5
.62
.41
P2
e6
.64 -.90
e8
Chi Square = 10.646
DF = 7
Prob. = .155
CMIN/DF = 1.521 GFI = .985
AGFI = .954
TLI = .958
CFI = .980
RMSEA = .047 Standardized estimates
.36
Utility
.24
Sensitivity to delay
e3
-.49 .36
Value
e2 .60
.32
Expectancy
e1 .56
.00
Delay e4
.23
Latency e5
Chi Square = 5.034
DF = 4
CMIN/DF = 1.258 GFI = .990
AGFI = .962
TLI = .980
CFI = .992
RMSEA = .036
Standardized estimates .33 .33 -.35
Appendix L
Structural Model of TKSS, D, and PASS-S (PASS I & II)Appendix M
Structural Model of TKSS and Latency of Term Paper CompletionAppendix N
Reliability on Duration of Sim’s Academic Activities
Assignment Term-paper Class Attendance Final Exam Academica Duration .488 .619 .525 .609 .728 Latency .550 .460b .541 .608 0,620 Note: a Total scores on the duration of four academic activities (tasks) b Using latency on the latency of of the term-paper completion Utility .33 Sensitivity to delay e3 -.58 .21 Value e2 .45 .25 Exepectancy e1 .50 .00 Delay e4 .80 PASS-S .38 P1 e5 .62 .41 P2 e6 .64 -.90 e8 Chi Square = 10.801 DF = 7Prob. = .148
CMIN/DF = 1.543 GFI = .985
AGFI = .954
TLI = .956
CFI = .980
RMSEA = .048 Standardized estimates
.36
Appendix O
Construct Validity Test of Multimethod Measurement Result
Self-Report Sim’s Behavior Observation Standardied Instrument
TKSS Duration (academic) Latency (term paper) PASS-Script
I II T I II T I II T I II T
TKSS r .834a -0.456 0.003 -0.356 0.37 -0.277 0.394 -0.328 -0.22 -0.6
p . . . 0.019 0.494 0.01 0.049 0.112 0.005 0.059 0.151 0
n 24 24 48 21 21 42 21 21 42 24 24 48
Academic r -0.456 0.003 -0.356 .754b -0.699 -0.299 -0.575 -0.009 -0.195 0.107
p 0.019 0.494 0.01 . . . 0 0.094 0 0.484 0.199 0.25
Finished n 21 21 42 21 21 42 21 21 42 21 21 42
r 0.37 -0.277 0.394 -0.699 -0.299 -0.575 .460c 0.239 0.12 -0.081
p 0.049 0.112 0.005 0 0.094 0 . . . 0.148 0.303 0.306
n 21 21 42 21 21 42 21 21 42 21 21 42
PASS_lt r -0.328 -0.22 -0.6 -0.009 -0.195 0.107 0.239 0.12 -0.081 .925d
p 0.059 0.151 0 0.484 0.199 0.25 0.148 0.303 0.306 . . .
n 24 24 48 21 21 42 21 21 42 24 24 48 Note: Emptied box indicating statistically non-significant correlation coefficients (p> .05)
I Procrastinators group II Non-procrastinators group
T Total subject (procrastinators and non-procrastinators group) a
Internal consistency (CronbachAlpha) coefficient of TKSS measurement results (30 items) b
Spearman-Brown reliability coefficient on duration of sim’s academic activities c
Spearman-Brown reliability coefficient on latency of sim’s term paper completion d
Internal consistency (CronbachAlpha) coefficient of PASS-Skripsi (38 items)
Appendix P
Criterion Related Validity Evidences of Multi-methods Measurement Results
Self-Report Sim's Behavior Observation Standardized Instrument
TKS++ Academic Finished PASS_lt
I II T I II T I II T I II T
Latency r -.422 -.393 -.516 .199 -.198 .108 -.238 -.119 -.351 .066 .307 .348 Skripsi p .041 .032 .000 .222 .202 .263 .179 .308 .017 .397 .077 .013 n 18 23 41 17 20 37 17 20 37 18 23 41 Note: Emptied box indicating statistically non-significant correlation coefficients (p> .05) I Procrastinators group
II Non-procrastinators group
Appendix Q
Hierarchical Linear Regression Model on Thesis Completion Latency
Model R R Square Adjusted R Square
Std. Error of the Estimate
Change Statistics
R Square Change F Change df1 df2 Sig. F Change
1 .496(a) .246 .225 1.343 .246 11.445 1 35 .002
2 .516(b) .267 .224 1.345 .020 .943 1 34 .338
Note:
(a) Predictors: (Constant), Utility
(b) Predictors: (Constant), Utility, Thesis completion
Appendix R
Hierarchical Linear Regression Model on Thesis Completion Latency 1
Model R R Square Adjusted R Square
Std. Error of the Estimate
Change Statistics
R Square Change F Change df1 df2 Sig. F Change
1 .543(a) .295 .280 1.273 .295 19.261 1 46 .000
2 .643(b) .413 .373 1.188 .118 4.416 2 44 .018
Note: 1
Using The Sims 2 Gameplay pattern scale scores as predictors (a) Predictors: (Constant), Utility