CHAPTER III
RESEARCH METHODOLOGY
This chapter provides a detail explanation of the research methodology
used in this present study. It covers hypothesis of the research, research design,
data collection which provides the research procedures in collecting the data, and
data analysis. In addition, teaching procedure, teaching materials, and scoring
method of the task are presented.
3.1 Hypothesis
Muijs (2004) defined hypothesis as a tentative explanation that accounts
for a set of facts and can be tested by further investigation. The hypothesis of this
research was a null hypothesis (H0) which states that there is no difference between the two groups’ means (Coolidge, 2000). There are two possible results
of the research, rejecting or accepting the null hypothesis. Rejecting the null
hypothesis means that the experiment was successful. On the other hand,
accepting the null hypothesis means that the experiment was not successful. This
research expected to reject the null hypothesis (Kranzler & Moursund, 1999). The
formula is shown below:
H0:
µ
1 =µ
2H0 : the null hypothesis
µ
1 : the mean for the experimental groupµ
2 : the mean for the control groupThe notation showed that the treatment gave no improvement to the
H0 : Implementation of genre based approach in written cycle teaching cannot improve students’ recount text writing ability.
3.2 Research Design
This research was conducted by using a quasi-experimental research
design. There were two groups of students involved in this research which were
divided into an experimental group and a control group. Since this research was
trying to figure out a new teaching method in the school where the research was
taken place, so the intervention that was a genre based approach was only
conducted in the experimental group; it is to measure the difference that the
intervention makes (Cohen et.al., 2007). The control group was treated by the
method that the teacher usually used in the classroom that was Grammar
Translation Method (GTM). This method can be identified from the first two
meetings where the students read and translated the text into Bahasa Indonesia
and grammar was taught deductively (Richards & Rodgers, 2001).
Three instruments were used to answer two research questions, writing
task which was conducted in pretest and posttest, a questionnaire, and an
interview. A pretest was conducted to both groups before giving the treatment to
the experimental group. To measure the difference that this treatment made to the
experimental group, a posttest was applied by the end of a complete treatment that
was a written cycle teaching of genre based approach to both the experimental
group and the control group.
The genre based approach was an independent variable that was used to
give a treatment to the experimental group. A dependent variable in this research
The notation of the research sequence used is described as:
Experimental O1 X O2
- - -
Control O3 O4
A quasi-experimental design: the pretest-post-test non-equivalent group design (Cohen etc. 2007: 283)
O1 : experimental group pre-test O2 : experimental group post-test O3 : control group pre-test O4 : control group post-test X : treatment
The students’ pretest scores from the two groups were analyzed, comparing the experimental group’s pretest scores and the control group’s pretest
scores (O1 : O3). The t-test was used to analyze these scores which were expected
to have no significant differences between the two groups’ pretest scores to show
normality of the data. The treatment X was given to the experimental group. The
second analysis using t-test was on the result of the posttest in order to conduct a
hypothesis testing, comparing the students’ posttest score (O2 : O4) ( Sugiyono,
2010:223), a high significant differences between these two groups’ posttest
scores were expected to show that the treatment gave improvement to the
experimental group students’ writing ability.
In addition, a questionnaire was given to the experimental group. The
questionnaire consisted of eighteen questions which were asking the students’
responses to the treatment that they had experienced. After that, an interview was
conducted to nine students who were randomly picked from the experimental
group to convince that the interview’s result was in line with the questionnaire’s
result. Not all students of the experimental group were involved in this interview
because many of them were doing their compulsory activity in the school and the
researcher could not conduct second round interview because of the availability of
3.3 Subject of the Research
Subject of the research were students of 10th grade. The study was
conducted to the 10th grade students of Senior High School in Subang. The
samples of the research are two classes of 25 students. The first class will be
treated as an experimental group and the other one will be treated as a control
group. The reason of using this level of students is because the recount text
becomes one of text types that the students at this level learn in an English class.
3.4 Data Collection
In collecting the data, this research used three main instruments that were
writing task, which was given in the pretest and posttest, and a questionnaire to
figure out the students’ response in the experimental group. In addition, an
interview was conducted to collect deeper information.
3.4.1 Writing Task
Since the focus of the research was on a recount text in the form of a
biography, the writing task in the pretest and posttest was composing a biography
from someone’s curriculum vitae. There were two famous figures identities that
students could choose. The identities presented personal information and a
timeline of the figures’ life, which was randomly assigned.
This writing task was given to both experimental and control groups in the
pretest and posttest. The writing task in the pretest was the same task as what was
used in the posttest. It was conducted to measure the effect of the treatment in the
experimental group. In addition, the results of the tests were used to compare the
experimental and control groups’ writing ability.
3.4.2 Questionnaire
The use of questionnaire in this research was as a survey to find out the
students’ responses towards the implementation of genre based approach. The
questionnaire was only given to the experimental group who received the
in the form of statements related to the research variables that were writing and
the teaching and learning process during the treatment that were equipped with
four ranking scale response options, strongly agree, agree, disagree and strongly
disagree. According to the Likert scale, the options are from positive responses to
negative responses (Sugiyono, 2010: 135). These four response options were used
in order to avoid the students’ neutral response or the students who tend to sit the
fence, not choose either side (Brown, 2000). In addition, this research was trying
to figure out the students’ responses which expected to give a clear direction,
whether it was positive or negative.
The questionnaire was in the form of a checklist. To answer the questions,
the students put a checkmark in the given column. The questionnaire was
presented in Bahasa Indonesia, as suggested by Mackey and Gass (2005) who
stated that questionnaire should be administered in respondents’ native language.
3.4.3 Interview
To clarify the data gathered from the questionnaire, an interview was
conducted which meant that this interview was not used as primary data (Harrel &
Bradley, 2009). A semi-structured interview was conducted for the researcher
used the questionnaire statements as a guide and still had chances to digress or
probe information from interviewees (Mackey & Gass, 2005). It was arranged to
strengthen the participants’ point of view and to collect more data. Moreover, the
interview was conducted to make sure the research come to reasonably clear
conclusion (Muijs, 2004: 31). The interview transcription is available in the
Appendix B.
3.5 Research procedures
The research procedures were divided into three stages that were before,
during and after the implementation of the treatment. Those stages were
3.5.1 Before the Implementation of the Treatment
This was the preparation stage of the research. The researcher designed 8
lesson plans, four lesson plans for each group (See Appendix C), and instruments
of the research (see Appendix A). Before designing the lesson plans, appropriate
teaching materials were prepared. The lesson plans were designed for five
meetings during the teaching and learning process, excluding the pretest and the
posttest. The instruments were in the form of a writing task and a questionnaire.
To check the validity and the reliability of the instruments, a pilot test was
administered. A content validity was used to measure the validity logically,
whether it was relevant to the purpose of using the instruments to get the expected
data (Hynes, 1995).
3.5.1.1 Administering the Pilot Test
Before the instruments were used in the research, a pilot test was
administered to investigate the content validity and the reliability of the
instruments. The pilot test was conducted before the pretest to a group of students
from the same level as the control and the experimental group. The students were
firstly asked to read the instructions given in the instruments to check whether
those instruments were clear and understandable or not. After that, the students
were asked to take the test. Then, the students’ writings were examined to see
whether it met the expectation of the research or not. The pilot test was conducted
on May 3rd, 2012.
3.5.1.2 Administering the Pretest
A pretest was conducted after administering the pilot test. It was
conducted in the control group and the experimental group. This pretest was used
to investigate the students’ initial ability.
3.5.2 During the Implementation of the Treatment
The implementation of the treatment was conducted in five meetings in the
3.5.2.1 Teaching Procedure
The teaching procedure of this research contains two different procedures
that applied in these two groups, an experimental group and a control group. An
explanation of each teaching procedure is presented below:
3.5.2.1.1 Teaching procedure in the experimental group
There are four stages conducted in the experimental group, that are
building knowledge of the field, modeling of the text, joint construction of the
text, and independent construction of the text as suggested by English Teaching
Curriculum in Indonesia (2004). The third stage, joint construction of the text,
was conducted in two meetings. They were delivered in order to give more
opportunity for the students to practice. To sum up, there are five meetings that
were conducted in the experimental group.
1. First Meeting (Building Knowledge of the Field - BKOF)
In this first stage of the written cycle, the students were exposed to
the expressions and linguistics features used in the targeted text (Emilia,
2011), the recount text in the form of biography. The students were asking
each other questions about their personal information which led them to
recognize the first step of making a biography. The activities were
conducted to build the students knowledge about the topic (Emilia, 2011).
This stage was conducted whenever it was needed. In this study, the
BKOF stage was conducted in one meeting since the students seemed
familiar with the topic.
2. Second Meeting (Modeling of the Text – MOT)
A model of biography was presented to give an explicit example of
the text (Emilia, 2011; Derewianka, 1990). It helped the students to figure
out the text organization of the recount text. In addition, they saw how the
organization structure of the text and linguistic features that were used in
the text. This stage was conducted in one meeting because the researcher
thought the students had enough knowledge of the recount text itself and
3. Third Meeting (Joint Construction of the Text – JCOT)
The students got opportunities to share their knowledge and
understanding of the biography to their classmates (Derewianka, 1990).
First of all, the students were given a list of expression. Then they were
involved to write a biography together with the teacher. After that, they
jointly worked in group to produce a biography under the same topic. This
stage was conducted in two meetings for the students could get more
experiences in writing process.
4. Forth Meeting (Joint Construction of the Text – JCOT)
On the second meeting of the joint construction of the text stage,
the teacher and the students discussed some of the students’ work. After
that, the students revised and then rewrote their text.
5. Fifth Meeting (Independent construction of the text – ICOT)
The students worked individually to compose a biography (Emilia,
2011; Derewianka, 1990). They wrote a biography of people that they
chose themselves. This stage was the students’ time to demonstrate their
knowledge and understanding of the targeted text, the recount text in the
form of a biography.
3.5.2.1.2 Teaching procedures in the control group
The teaching procedures in the control group were conducted in five
meetings, the same as the experimental groups had. These procedures were
designed after informal observation and interview were conducted with the
English teacher. The teaching procedures that were usually conducted by the
English teacher in the research site were mainly based on the Grammar
Translation Method (GTM), which conducted as follows:
1. First meeting
On the first meeting, the teacher explained what the recount text is
and gave the example of the biography, a teaching material, to the
difficult vocabulary and the text into Bahasa Indonesia (Larsen-Freeman,
2000).
2. Second meeting
Grammar Translation Method (GTM) was used in the second
meeting which focused on the form. The students were exposed into
grammatical features of the recount text. However, these grammatical
features were presented as separate parts of the recount text which was
given in the first meeting (Richards &Rodgers, 2001). For example, when
the teacher explained the students about the past tense, the students were
asked to make five sentences according to the formula of the past tense.
All students’ sentences were not related to the recount text. 3. Third meeting
On the third meeting, the students were still exposed into linguistic
features but this time they linked the features into the text. The teacher and
the students discussed the students’ work in the previous meeting. The
students can ask questions and discuss with their friends and the teacher
(Larsen-Freeman, 2000).
4. Forth meeting
On this forth meeting, the students worked with the same text as
the previous meeting. This time, the text was used to measure the students’
reading comprehension through questions and answers (Larsen-Freeman,
2000). After that, the students were asked to rearrange jumble paragraphs
into a well-structured text.
5. Fifth meeting
The main activity in the last meeting was to ask the students to
write a biography individually. Then, the teacher gave feedbacks to some
the students’ works.
3.5.3 After the Implementation of the Treatment
After completing the implementation of the treatment, a posttest was
questionnaire was distributed to the experimental group to find out the students
responses toward the implementation of the genre based approach. After that, an
interview was arranged. Finally, a data analysis was conducted.
3.6 Teaching materials
The teaching materials to both groups, the experimental and the control
group, were the same. It covered the generic structure of the text and linguistic
features. Linguistic features of recount text include past tense, action verb, proper
noun, pronoun, preposition of place and time and conjunctions or connectors
dealing with sequences. Those teaching materials were differently arranged for
each group (see Lesson Plans in Appendix C).
3.7 Teaching Schedule
Since the treatment of the study used a genre based approach, a complete
cycle of teaching that were building knowledge of the field, modeling of the text,
joint construction of the text and independent construction of the text was
conducted in five meetings. The teaching schedules were arranged as follow:
Table 3.1
Teaching schedules in the experimental group and the control group
No
Schedule/ Date Activity
Exp. Group
Cont.
Group Experimental Group Control Group
1.
Pretest/ May 7, 2012
Pretest/ May 5, 2012
Writing task. The students were asked to write a biography. They chose one of the two famous figures’ personal information as the material of their writing.
2. introduced into the subject through asking each other questions about their personal information, since speaking can be used in this stage as assessment (Emilia, 2010). The teacher tried to build the students’ knowledge about the recount text in the form of biography which tells someone’s personal information.
First meeting. The teacher explains what recount text is, the purpose and the organization structure. Then the students read the given example of the recount text, J.K. Rowling’s biography. After that, the students translate the text into Bahasa Indonesia. A typical GTM classroom, students are asked to read and translate some organization structure of the recount text (Emilia, 2010).
Second meeting. The teacher explains the grammar rules of the recount text deductively in which emphasized in teaching about form of past tense, pronoun, conjunction, etc. The students were asked to make some sentences in past tense form. Unfortunately, those sentences are usually not
Joint construction of the text. The teacher gave the students a list of expressions that can be used in the recount text writing activity (Emilia, 2011). The students’ previous works, mostly by translating statements found in the students’ work (Richards &Rodgers, 2001).
Joint construction of the text. The students and the teacher discussed the students’ works. After that, the students rewrite their works.
6.
Independent construction of the text. The students write a biography individually (Emilia, 2010; Derewianka, 1990)
questionnaire and the analysis of the research itself.
3.8.1 Scoring Technique of the Writing Task
Students’ works on the pretest and posttest were analyzed based on the
five main aspects of writing (Emilia, 2011), which are genre, register, discourse,
grammar and graphic features. A more detail evaluation of the students’ texts was
proposed by Rose who described those five aspects of writing into more specific
aspects (2006, as cited in Emilia, 2011) and gave points for each aspect. The
points were gained from the four ranges of criteria that were suggested by Coffin,
et al. (2003 as cited in Emilia, 2011). A rubric is used in order to give a detail
score for each aspect of writing (Emilia, 2011).
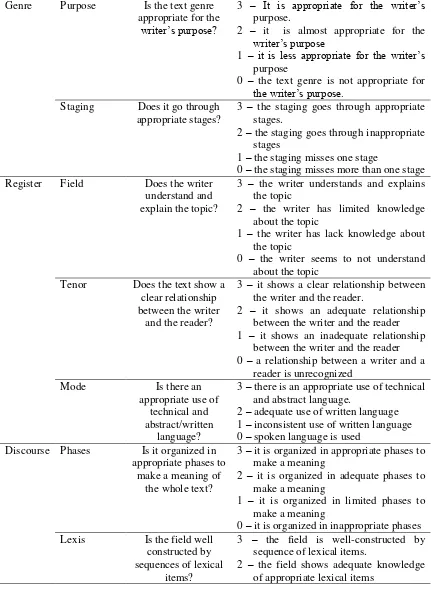
The rubric in Table 3.2 below was a modification of Rose’s evaluation of
text based on rubric and points with some adjustments. The modification was
conducted to give clearer standard or criteria for each aspect of writing (Tchudi,
Table 3.2
Evaluating students’ text based on rubric and points
Rose (2006: 16; 2007: 9-30 as cited in Emilia 2011: 151)
Genre Purpose Is the text genre
Staging Does it go through appropriate stages?
3 – the staging goes through appropriate stages.
2 – the staging goes through inappropriate stages
1 – the staging misses one stage
0 – the staging misses more than one stage Register Field Does the writer
understand and the writer and the reader.
2 – it shows an adequate relationship between the writer and the reader 1 – it shows an inadequate relationship
between the writer and the reader 0 – a relationship between a writer and a 1 – inconsistent use of written language 0 – spoken language is used
Discourse Phases Is it organized in appropriate phases to
1 – the field shows limited knowledge of appropriate lexical items
0 – the field is not well-constructed by sequence of lexical items
Conjunction Are logical relations between each stage
clear, e.g. time, comparison, and
cause?
3 – logical relations between each step are clear.
2 – some parts do not show logical relations
1 – lack of conjunction which leads to unclear logical relations between each stage 1 – there are frequent errors of references 0 – it is not clear who or what is referred
to Appraisal Is appraisal used
judiciously to
Grammar Are grammatical conventions used appropriately?
3 – grammatical conventions are used appropriately.
2 – few errors of grammatical conventions 1 – several errors of grammatical
Spelling Is spelling accurate? 3 – spelling is accurate 2 – few errors of spelling 1 – occasional errors of spelling 0 – frequent errors of spelling Punctuation Is punctuation used
appropriately?
3 – punctuation is used appropriately 2 – few errors of punctuation
1 –occasional errors of punctuation 0 – frequent errors of punctuation Presentation Is it well
organized/presented?
student’s work is 100. The student’s score is obtained from:
3.8.2 Scoring Technique of the Questionnaire
Since the questionnaire response options were in the form of Likert scale,
so the students’ choice was calculating in the form of percentage. The number of
the students who chose the same option in the questionnaire items was divided by
the number of total students and then multiplied by one hundred. In the Likert
scare, to get the direction that the responses took, the average of the students’
responses was counted by the ideal responses score for each item (Sugiyono,
2010). This ideal score was set according to the researcher’s expectation of the students’ response. It meant that each option of the item had a certain score. The gradation score for each option (strongly agree – agree – disagree – strongly
disagree) ranked from 4 to 1 for the positives statements and 1 to 4 for the
negative statements. Through this calculation, the students’ responses toward the
implementation of genre based approach in the classroom could be obtained. See
Appendix A: the research instrument.
The result of the questionnaire was presented in the form of percentage
which was presented in the form of a table. It showed students’ choice for each
optional answer in the questionnaire.
3.8.3 Data Analysis on the Pilot Test
The aim of administering the pilot test was to check the validity and
reliability of the instrument. It was valid when the students were able to follow the
given instructions in the test and they were able to take the test as the way it
instructed. Moreover, the data gained from the test was what this research
expected. Furthermore, it was reliable when the instrument was consistently
giving the same variable result whenever it was conducted. Then, the test was
assumed to be valid and reliable. It meant that the test can be used in the pretest
and the posttest.
3.8.4 Data Analysis on the Pretest
The researcher used independent t-test formula to analyze the result of the
pretest. This test was used to compute two independent groups’ means on the
same dependent variable in order to determine whether there were significant
differences or not (Coolidge, 2000). The level of significance used in this research
was the minimum conventional level of significance that is alpha 0.05. The pretest
result was analyzed using SPSS version 17.0 for Windows. Hatch and Farhady
(1982) stated three assumptions underlying the t-test, they are as follow:
1. The subject is allotted to one group in experiment
2. The variances’ scores are equal and normally distributed
3. The scores on the independent variable are continues
In order to meet those assumptions, the normality distribution and variance
homogeneity tests were done before the researcher calculated the t-test of the data.
All computation was conducted by using SPSS version 17.0 for Windows.
3.8.4.1 Normality Distribution Test
To analyze the normal distribution of the scores in the pretest, the
Kolmogorov-Smirnov test in SPSS version 17.0 for Windows was used by
following the steps of computing the normal distribution test below:
1. Stating the hypothesis and setting the alpha level at 0.05 (two tailed test)
H0 = the scores of the experimental and control group were normally
distributed.
H1 = the scores of the experimental and the control group were not
normally distributed.
2. Analyzing the normality distribution using Kolmogorov-Smirnov test
3. Comparing asymptotic significance (Asymp. Sig) with the level of
significance for testing the hypothesis. If Asymp. Sig>0.05, the null
3.8.4.2 Homogeneity of Variance Test
The homogeneity of variance test was conducted to find out whether the
variances of scores in control and experimental groups were equal. In SPSS
version 17.0, Levene’s test was used to analyze this homogeneity of variance; the
procedures were as follow:
1. Stating the hypothesis and setting the alpha level at 0.05 (two tailed test)
H0 = the variance of the experimental and the control group are
homogenous
H1 = the variance of the experimental and the control group are not
homogenous
2. Analyzing the homogeneity of variance using Levene’s test
3. Comparing asymptotic significance (Asymp. Sig) with the level of
significance for testing the hypothesis. If Asymp. Sig>0.05, the null
hypothesis is accepted which means the scores are homogenous.
3.8.4.3 t-test Computation
When the data were normally distributed and homogenous, the
prerequisites to conduct a parametric test were fulfilled. The researcher used an
independent t-test to find out whether there was significance difference between
the means of experimental and control groups.
The steps of t-test calculation are as follows:
1. Stating the hypothesis and setting the alpha level at 0.05 (two tailed test)
H0 = there is no significance difference between the means of the
experimental and the control groups
H1 = there is significance difference between the means of the
experimental and the control groups
2. Finding the significance value using SPSS version 17.0 for Windows
3. Comparing significance value and level of significance. If significance
value < level of significance at 0.05, then H0 is rejected which means there
is significance difference between the means of the experimental and the
3.8.5 Data Analysis on the Posttest
The posttest scores were analyzed using the same steps of computations as
those analysis conducted in the pretest scores. It was calculated by independent
t-test in SPSS version 17.0 for Windows.
3.8.6 Effect Size
To see how the independent variable influenced the dependent variable, an
effect size computation was calculated. It was conducted to determine how well
the treatment worked (Coolidge, 2000). The correlation coefficient of the effect
size is always positive. A correlation coefficient of effect size is calculated by
using this formula:
r =
√
2 2+
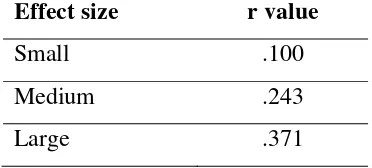
The range of the effect size is from 0 to 1.00. This following scale is used
to interpret the magnitude of the effect size:
Table 3.3
Effect Size Value (Coolidge, 2000)
Effect size r value
Small .100
Medium .243
Large .371
3.8.7 Paired T-Test
In addition, a paired t-test was conducted to investigate the students’
scores in pretest and posttest in the experimental and the control groups. It was to
find out whether there was a significance difference between the pretest and
posttest means of both groups (Coolidge, 2000). The steps of calculating this
paired t-test were as same as the independent one. It was calculated using paired
indicates that the null hypothesis is rejected. The null hypothesis is accepted if the
significance value is lower than α = 0.05. The hypothesis was stated as follow:
H0 = there is no significance different between the means of the pretest
and the posttest
3.9 Conclusion of Chapter III
This chapter presents a detail explanation of the research methodology
which covers hypothesis of the research, research design, subject of the research,
data collection, and data analysis. From those explanations, it can be concluded
that this research is conducted in a quasi-experimental research design, involved
tenth grader students, used three instruments that are writing task, questionnaire