European Journal of Agronomy 12 (2000) 269 – 279
Water movement and stability of profiles in drained, clayey
and swelling soils: at saturation, the structural stability
determines the profile porosity
Y. Pons
a,*, A. Capillon
b, C. Cheverry
caINRA-SAD,545,route du Bois Mache,17450Saint Laurent de la Pre´e,France bCIRAD-CA,A
6enue Agropolis,BP5035,34032,Montpellier Cedex1,France
cENSA,Science du Sol,65Rue de Saint-Brieuc,35042Rennes,France
Received 15 July 1999; received in revised form 17 January 2000; accepted 11 February 2000
Abstract
In clayey, swelling and more or less sodic soils, cultivation and seasonal climatic cycles induce variations in soil moisture which in turn cause variations in the soil structure. In particular, when the soil profile is saturated, some soils become impermeable because the soil porosity value does not remain sufficiently high throughout the drainage period to be effective for water movement. In the marshland soils of the French Atlantic coast, this ability is linked with the soil stability. We showed that soil profile stability and porosity are linked. First, we produced a classification of soil profiles ordered according to their degree of stability. Then, after describing the main features of the soil profile structure at saturation period, we proposed the concept of ‘porosity profile’. This classification and concept were tested on farm fields by measuring two parameters: the water table in winter and the rooting depth of winter wheat. The values assumed by these parameters are indicators of field hydraulic and agronomic behaviour and more precisely of the depth of the soil layers where macroporosity allows water circulation and root colonisation. These results enabled us to validate the concept of ‘porosity profile’. © 2000 Elsevier Science B.V. All rights reserved.
Keywords:Macroporosity; Saline and sodic soils; Soil classification; Soil structure; Marshland soils; Water table; Root depth; Winter wheat
www.elsevier.com/locate/euragr
1. Introduction
Certain marshland soils display similar charac-teristics: flat topography, a soil profile that is only
slightly differentiated, high clay content and a
swell/shrink potential, and more or less saline and
sodic conditions (Van Hoorn, 1981; Salin, 1983; Rands, 1984; Moreno et al., 1995). In such situa-tions the yearly recurrent cropping and climatic cycles induce soil moisture conditions which cause variations in the soil structure. In particular, when the soil profile is water saturated, the soil porosity value does not remain sufficiently high
through-* Corresponding author. Tel.:+33-5468-21056; fax:+ 33-5468-40890.
E-mail address: [email protected] (Y. Pons)
out the drainage period to allow water movement. In the marshland soils of the French Atlantic coast, this capacity is linked to the soil stability.
In this paper, we demonstrate the link between the stability of soil profiles and the hydraulic and agronomic behaviour of drained cultivated plots. To this end we produced a classification of profi-les ordered according to their degree of stability. Then we described the main features of the soil profile structure at the saturation period and pro-posed the concept of ‘profile porosity’ which is defined by the thickness of the layers where macroporosity occurs.
The classification and concept were tested on farm fields by measuring two parameters: the water table level in winter and the root depth of winter wheat. The values assumed by these parameters are indicators of field behaviour and more precisely of the thickness of the layers in which macroporosity allows water circulation and root colonisation to occur. These results en-abled us to validate the concept of ‘porosity profile’.
2. Materials and methods
2.1. Experimental design and the stages in the study
We carried out two different series of studies. In the first we measured the structural stability of soil samples to produce a classification of stan-dard profiles ordered by their degree of stability. The second series was designed to validate the soil profile classification by investigating field be-haviour at the saturation period. The plots, culti-vated with winter wheat, were selected on different farms so as to cover a wide spread of soil types, field drainage systems and farming systems. The first stage of the second series consisted of describing the main common features of the profile structure. The second stage consisted of observing and comparing the hydraulic and agro-nomic behaviour of the plots to prove that the depth of the macroporous layers provides an ex-planation for this behaviour.
2.2. Soil
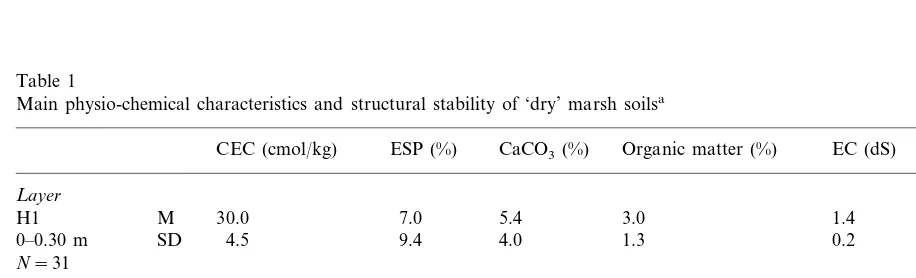
The Western Marshlands (Marais de l’Ouest) in the central part of the French Atlantic coast extend over some 250 000 ha between the Vilaine river in the north and Gironde in the south. The soils are derived from recent marine and river sediments. As a result of similar conditions of sediment deposition in ancient bays and river estuaries (Chevallier et al., 1984; Ducloux, 1989), soil texture and clay mineralogy are the same, with 45 to 60% clay and more than 95% clay plus silt. Clay minerals consist of illite (50 – 60%), kaolinite and montmorillonite (20 – 25%). In ‘dry’ marshes where cultivation is possible, these char-acteristics remain roughly constant throughout the soil profile (Lafond and Verger, 1965; Morizet et al., 1970; Salin, 1983; Collas, 1985) the cation
exchangeable capacity, measured at pH=8.2, is
saturated and its value is high (25 – 30 cmol/kg).
Y.Pons et al./Europ.J.Agronomy12 (2000) 269 – 279 271
crop yields. Taking these soils into cultivation demands not only effective management of the main and collective drainage system as in the ‘dry’ marshes, but also requires field drainage. The main characteristics of the field drainage networks are spacing and depth (ZD) of the drains: 18 m spacing for open ditches at a depth of 0.40 to 0.50 m; 10 – 20 m spacing for pipe drains at a depth of 0.80 to 1.20 m.
2.3. Soils and plots
In the first series of studies, we took 111 sam-ples from 42 soil profiles that represented a wide range of locations, deposition and cultivation ages. Soil samples were taken from 1980 to 1982, from profiles dug in saturated water conditions at the end of winter. The weakly differentiated profi-les were characterised by three successive 0.30 m thick layers designated as H1, H2, H3. In the second series of studies, we observed soil struc-ture, hydraulic and agronomic behaviour in win-ter of 40 plots differing in their physical conditions (year, drainage system, soil type) and crop management (farming systems). We selected winter wheat because this crop is subjected to excess water in winter and will therefore respond differently to varying degrees of excess.
2.4. E6aluation of structural stability
The relationship between soil stability and per-meability has been demonstrated in a range of studies (He´nin et al., 1969; Loveday and Pyle, 1973; Collas et al., 1984). However, this relation-ship can be evidenced only on condition that the evaluation methods are adapted to the soil type. In the case of saline and sodic soils, the relation cannot be verified with a method based on evalu-ating the content of stable aggregates after several preliminary treatments (He´nin et al., 1969). Here, structural stability is better assessed by measuring the dispersion degree (Pons and Martineau, 1983; Pons, 1997) which also serves to identify the relations between soil stability and permeability (Quirk and Schofield, 1955; Shainberg et al., 1980, 1981). The Pons and Martineau test (1983), in-spired from Emerson (1967), Loveday and Pyle (1973) and Greenland et al., (1975), is based on the dispersion intensity of soil aggregates when immersed in water and under mechanical stress. In a first stage, six 3 – 4 mm diameter aggregates, selected at random from the air-dried soil sample, were divided into two lots of three, and each lot dropped into 20 ml of distilled water in a clear, flat-bottomed, glass cup. After 10 min, dispersion of each lot is noted from 0 (no dispersion) to 4
Table 1
Main physio-chemical characteristics and structural stability of ‘dry’ marsh soilsa
CEC (cmol/kg) ESP (%) CaCO3(%) Organic matter (%) EC (dS) DI(0–16)
(complete dispersion). In a second stage, the same procedure is done with a wet and remoulded
sample: rough cubes of :4 mm side are formed
and dropped into distilled water. After 2 h, dis-persion is noted as before. The disdis-persion index
(DI) is the general total of the dispersion note
obtained by each lot of each stage. It varies from 0 (no dispersion) to 16 (maximum dispersion). If
DI56, the soils are stable, if DI]10, they are
unstable, and if DI lies between 7 and 9, their
stability is intermediate. Pons (1997) showed that DI is an indicator of soil structural stability.
2.5. Characteristics and obser6ation of the soil structure
The plot profiles were investigated at the satu-rated period at the start of stem elongation. They were dug halfway between two drains. Observa-tions were carried out down to rooting base and to 1 m depth at least. Soil structure was described following the methods of He´nin et al. (1969) and Gautronneau and Manichon (1987). When soils reach maximum swelling, hydraulic conductivity is strictly linked with macropore volume (Bouma and Wo¨sten, 1979; Ahuja et al., 1984; Messing, 1989; Messing and Jarvis, 1990). The root diame-ter of windiame-ter wheat (Finney and Knight, 1973 cited in Cannell, 1977) is approximately the same as that of macroporosity which is defined by the minimum pore equivalent diameter value, i.e.
0.3 – 0.6×10⁻³ m, depending on authors (Beven
and Germann, 1982). Soil macroporosity is there-fore a condition that favours root development in winter wheat. Investigating water movement through a saturated profile therefore means
iden-tifying the layers in which macroporosity and/ or
roots occur.
In these soils, the exchangeable sodium content (ESP) and the soil solution salinity (EC) act on the hydratation capacity, the swelling degree and on the clay dispersion degree, and consequently on the structure of the soil profile. This accounts in part for the impermeability and morphology of the soil profiles (Tessier and Pedro, 1980; Halitim et al., 1984; Tessier, 1984; Guyot et al., 1984; Azib, 1989, Hallaire et al., 1996), and particularly
for the lack of effectiveness of drainage systems and the poor behaviour of soils when drained and cultivated (Collas et al., 1984; Rands, 1984).
2.6. Obser6ation of soil hydraulic and agronomic beha6iour in winter
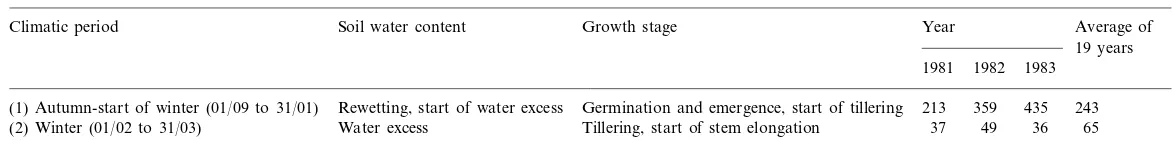
Soil hydraulic and agronomic behaviour was observed in 1981, 1982 and 1983. Water excess was evaluated by compiling the monthly weather balance (R-ET) at two periods. The first corre-sponds to re-wetting and the start of water excess (September – January), the second to water excess (saturation period from February to March). During the first period, the winter wheat reaches the start-of-tillering stage and during the second the start of stem elongation.
The water table depth in winter was taken as an indicator of the permeable layer base (Van Hoorn 1958; Trafford and Oliphant, 1977) or of drain depth. Damour et al. (1972) and Collas (1985) have shown that (a) in any marshland soil and any field drainage system, the water table shape is almost flat, and (b) the water table depth is not very sensitive to drain spacing. Consequently the water table was measured by placing piezometers at 1.20 m depth equidistantly of two neighbouring drains. The water table depth in winter was mea-sured by calculating the mean of weekly
piezomet-ric values recorded during :10 weeks of the
saturated period, i.e. mainly from mid-January to end of March.
Root density was evaluated on a vertical face of the profile (1.5 to 2 m width on the total rooting depth) at the start of stem elongation which is also the end of the saturated period (end of March), using the method applied by Meynard (1985). Root depth was assessed when root
den-sity was B1 root×10−2 m2. This particular
growth stage was chosen because the root system development shows that (a) the root dry matter and root depth are closely linked (Baldy, 1973; Welbank et al., 1974), and (b) the root dry
weight/shoot dry weight ratio is maximum at the
Y.Pons et al./Europ.J.Agronomy12 (2000) 269 – 279 273
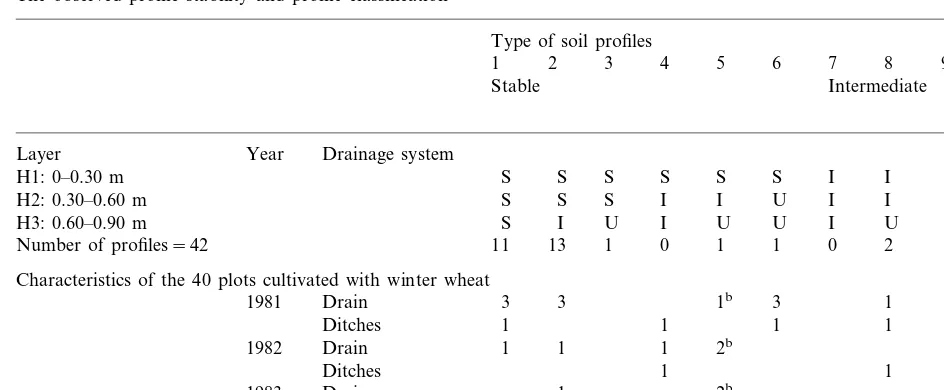
Table 2
The observed profile stability and profile classificationa
Type of soil profiles
1 2 3 4 5 6 7 8 9 10
Stable Intermediate Unsta
ble
Drainage system
Layer Year
S S S S S S I
H1: 0–0.30 m I I U
S S S I I U
H2: 0.30–0.60 m I I U U
H3: 0.60–0.90 m S I U I U U I U U U
Number of profiles=42 11 13 1 0 1 1 0 2 5 8
Characteristics of the 40 plots cultivated with winter wheat
Drain 3 3
1981 1b 3 1
Ditches 1 1 1 1 3 1
Drain 1 1 1 2b
1982 3 1
Ditches 1 1 3
1983 Drain 1 2b 1 2
Ditches 1
5 5 0 3
Number of plots=40 5 4 0 4 10 4
aThe soil profile types are obtained by combining the three layers ordered by their degree of stability H1`H2`H3. Stability of soil layers: S, stable; I, Intermediate; U, unstable.
bCharacteristics of the soil profile described in Fig. 1 and Fig. 4.
3. Results
3.1. Profile stability and classification
Table 2a presents the observed profile stability. It shows that the stability of soil layers varies greatly within and between the profiles. The first layer may be stable, intermediate or unstable, and in each profile, there is always a gradient of
instability with depth: the stability of H1]H2]
H3. This induced us to consider all the combina-tions of the three soil layers characterised by their structural stability (stable, intermediate, unstable) subjected to this gradient. We ended up with ten cases ordered according to their degree of instabil-ity and defined as ‘profile types’. The types are characterised as stable (numbers 1 – 6), intermedi-ate (numbers 7 – 9) and unstable (no. 10) when the first layer is respectively stable, intermediate or unstable. Consequently, the degree of stability of the profile may be defined by a single parameter, the depth of the unstable layer. On the basis of this result, the profile classification is defined as a succession of more or less thick layers ordered along a gradient of instability.
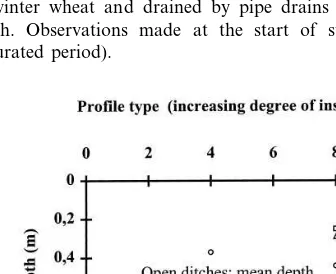
3.2. A porosity profile case: structure of a type 5 drained and culti6ated soil
At the start of winter wheat stem elongation and therefore at the saturation period (Fig. 1), the water table depth is about 0.55 to 0.60 m. The plot is drained by pipes placed at 0.95 m depth. The plough layer (0 – 0.30 m) is stable; the sub-structure, consisting of more or less joined, differ-ent sized clods, leaves voids through which free water flows. The clods have a high internal poros-ity. The subsoil consists of two layers. The first, between 0.30 and 0.60 m, displays intermediate stability and a few thin cracks. The second, below 0.60 m, is unstable; it is massive, compact, with no cracks. A very thin layer of clay joins the prism faces and blocks the pores of former walls. Internal porosity in the subsoil structural elements is very low: it consists of rare and very fine pores
of 0.2×10⁻³m diameter. Macroporosity is
there-fore found only in the 0 to 0.55/0.60 m layers. So,
3.3. Profile stability and water table depth in winter
Table 2 presents the main characteristics of the 40 plots cultivated with winter wheat. It shows the
wide range of conditions concerning year, soil types and drainage system in which the plot hy-draulic and agronomic behaviour was observed. Table 3 shows the high variability of water excess during the three years. For the period autumn – start of winter, the weather balance expresses the almost full variability observed over 19 years; for the winter period, values are lower than for a normal year.
Fig. 2 shows the relation between soil types and water table in winter: irrespective of the drainage system and year climate, the water table depth increases with profile stability until it reaches the drain level. For drain pipes (mean depth: 1 m), the water table depth varies significantly (from 1.20 to 0.10 m). With a high degree of profile stability (soil types numbers 1, 2 and 4), the water table depth is linked to drain depth, and the unstable layer occurs below 0.60 m. At the other extreme, when the soil profile is unstable (soil type no. 10), the water table moves inside the unstable plough layer. In this case, the depth of the profi-le’s impermeable layer (0 – 0.30 m) and not the drain depth determines the water table depth. In-between these two situations, the depth of the unstable layer of soil types numbers 5 – 9 lies between 0. 30 and 0.60 m and that of the water table is about 0.40 and 0.70 m. In open ditches, the drains lie at about 0.50 m depth. In this case, the water table depth is linked to the soil type, but the depth of the open ditches restricts water table variation.
In brief, the mean water table depth during the saturated period results from the interaction of soil types and drainage system and reflects the drainage efficiency; it characterises the hydraulic behaviour of drained plots. It enables us to clas-sify the different drainage systems and soil types independent of yearly weather effects. It is indica-tive of the depth of the unstable soil profile layers lying above the drains. These unstable layers form the impermeable layers of the soil profile.
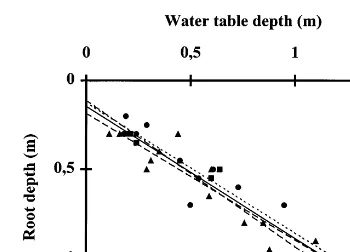
3.4. Depth of roots at the start of elongation and depth of the water table
Fig. 3 shows the close link between water table depth in winter and rooting depth at the start of
Fig. 1. Structure of soil profile type no. 5. The plot is planted to winter wheat and drained by pipe drains laid at 0.95 m depth. Observations made at the start of stem elongation (saturated period).
Y
.
Pons
et
al
.
/
Europ
.
J
.
Agronomy
12
(2000)
269
–
279
275
Table 3
Weather balance (rainfall−evapotranspiration) in mm during the period of water excessa
Average of Growth stage
Climatic period Soil water content Year
19 years 1982 1983
1981
243 359 435 (1) Autumn-start of winter (01/09 to 31/01) Rewetting, start of water excess Germination and emergence, start of tillering 213
36 Water excess Tillering, start of stem elongation 37 49 65 (2) Winter (01/02 to 31/03)
Fig. 3. Root depth at start of stem elongation and water table depth in winter (m). 1981 (circle), 1982 (triangle), 1983 (square). Regression: 1981 (point)R2=0.85; 1982 (point and dash) R2=0.84; 1983 (dash) R=0.92; 3 years (continuous line)R2=0.85.
identical in the three years (Table 4). This close proportionality shows that the field drainage sys-tem and soil type account for the rooting depth at the end of winter irrespective of the year’s weather characteristics. This confirms that macroporosity and root growth were also closely linked. On the other hand, there are no roots in the unstable layers of the profile during the saturation period.
3.5. The porosity profile and its indicators
3.5.1. Profile stability and drainage efficiency The depth of the unstable layer (ZI) determines the degree of profile stability. The unstable layers form the impermeable zone of the profile at satu-ration. The layers having no macroporosity are unfavourable for early development of winter wheat roots. We synthesised these results by using the notion of ‘porosity profile’ at saturation (Fig. stem elongation. The coefficients of determination
and the regression equation parameters are almost
Table 4
Regression coefficient (R2) and regression equation between root depth at the start of stem elongation (y) and water table depth (x)
Total period
1981 1982 1983
0.84 0.92 0.85
R2 0.85
0.73x+15
y 0.71x+11 0.71x+18 0.82x+11
30
11 6
Total plots 13
Y.Pons et al./Europ.J.Agronomy12 (2000) 269 – 279 277
4). The porosity profile may be described by a single parameter, the depth of the ZI. This layer separates the first permeable layers from the un-derlying impermeable layers. The former consist of the yearly ploughed layers (in the case of Fig. 4, the first layer is stable) and the stable or intermediate sub-soil layers; the latter of the un-stable profile layers. The thickness of these lay-ers depends on depth of ploughing for the ploughed layer and soil type for the subsoil lay-ers. If the drain depth (ZD) is known, water movement in the profile can be predicted. If
ZIBZD, the water flow through the permeable
cultivated (S) and subsoil (Mp) layers is fast, and slow through the impermeable subsoil layers
(MI). With ZI\ZD, only the fast water flow
through S and Mp occurs.
The permeability of the profile layers can thus be diagnosed either from its causes (struc-tural stability of soil layers) or its effects
(drained plot behaviour: water table depth
in winter and depth of wheat rooting at the end of winter according to the drainage system depth, structural characteristics of the profile layers). But the water table depth in winter is the indicator which, is most convenient and easiest to obtain for diagnosing the porosity profile on the condition that the drain depth is known.
3.5.2. Structure and root system at saturation At saturation, the profile porosity is minimal. The porosity of the soil layers decreases due to clay swelling, with cracks closing up to a greater or lesser degree. Macroporosity is partially pre-served if the soil stability is high or intermediate. This is the case in Fig. 1 and Fig. 4 where macroporosity partly persists inside and between the clods in the stable plough layer. In cases of high or intermediate stability of the subsoil lay-ers (0.30 – 0.60 m) a network of a few functional cracks survives, enabling water flow. On the
other hand, if the subsoil layer is unstable (\
0.60 m), macroporosity disappears during the saturated period; the layer structure is massive, compact with no cracks or live roots. This par-ticular structure enables us to assess the depth
of the unstable layer. The rooting depth of wheat is restricted by the soil hydromorphy, a result of interaction between drain depth and depth of the unstable layer.
4. Conclusion
In swelling, more or less sodic clay soils, there is a close relation between soil stability and profile porosity at the saturation stage. The drainage system efficiency and rooting depth of winter wheat are indicators of the hydraulic and agronomic behaviour of the plots. This means that the soil stability factor has a far greater effect on plot behaviour than other environmen-tal factors such as weather variation and cultiva-tion methods.
At saturation profile swelling is maximum: the cracks in the unstable layers close up and the layers become impermeable. On the other hand, in the soil layers with strong and intermediate stability, there remains a sufficient degree of macroporosity to allow for water movement and the early development of the wheat root system. The ‘porosity profile’ enables us to differentiate between macro and microporosity or more sim-ply between the permeable and impermeable lay-ers at the saturation period. If the pores are the locus of soil-water exchanges, the distinction be-tween macro and microporosity inside a soil profile enables us to identify two water circula-tion regimes, one fast, the other slow, and there-fore to predict drainage water quality.
References
Ahuja, L.R., Naney, J.W., Green, R.E., Nielsen, D.R., 1984. Macroporosity to characterize spatial variability of hy-draulic conductivity and effects of land management. Soil Sci. Soc. Am. J. 48, 699 – 702.
Azib M., 1989. Etude de l’e´volution, de la gene`se et du comportement de sols argileux sale´s, d’origine se´dimentaire (Marais de l’Ouest). Aspect morphologique, ge´ochimique et hydrique. The`se E.N.S.A-I.N.R.A. Rennes, 141 pp. Baize D., Girard M.C., 1995. Re´fe´rentiel pe´dologique. INRA
Editions, Collection ‘Techniques et Pratiques’, 332 pp. Baldy, C., 1973. Progre`s re´cents concernant l’e´tude du syste`me
racinaire du ble´. Ann. Agron. 24 (2), 241 – 276.
Beven, K., Germann, P., 1982. Macropores and waterflow in soils. Water Resour. Res. 18, 1311 – 1325.
Bouma, J., Wo¨sten, J.H., 1979. Flow pattern during extended saturated flow in two undisturbed swelling clay soil with different macrostructures. Soil Sci. Soc. Am. J. 13, 16 – 22. Callot G., Favrot J.C., 1965. Etude pe´dologique des marais du Me´doc. Service d’e´tude des sols Montpellier, INRA 34, 117 pp.
Cannell, R.Q., 1977. Soil aeration and compaction in relation to root growth and soil management. Appl. Biol. 2, 1 – 86. Chevallier C., Pons Y., Cheverry C., 1984. Etude pe´dologique du polder de Moe¨ze-Brouage. Premie`res e´tapes des trans-formations structurales et ge´ochimiques du polder. INRA-SAD St Laurent de la Pre´e, 110 pp.
Collas P., 1985. Le drainage des sols lourds plus ou moins sodiques des marais de l’Ouest de la France. Institut National Polytechnique, Toulouse. The`se Docteur-Inge´-nieur, 217 pp.
Collas, P., Damour, L., Pons, Y., 1984. Soil variability and hydraulic restrictions in the marshland of the West Central Atlantic region of France. In: Bouma and P.A.C. Raats (Eds.). Water and Solute Movement in heavy clay Soils. ILIR Publication 37, 178 – 184.
Concaret, J., Guyot, J., Perrey, C., 1976. Circulation dans les sols de l’eau exce´dentaire. Conse´quences sur la Technolo-gie du Drainage. INRA Science du sol, Dijon.
Damour L., Pons Y., 1987. Attention… un marais peut en cacher un autre. Brochure INRA-DRSAD, St Laurent de la Pre´e, Chambres d’agriculture et DDAF de Loire Atlan-tique, Vende´e, Deux Se`vres, Charente Maritime, Gironde et Ministe`re de l’Agriculture, 12 pp.
Damour, L., Camus, P., Garreau, J., Lesage, B., Me´dion, H., 1972. Etude de trois syste`mes d’assainissement dans les Marais de l’Ouest. Bull. Tech. d’Informat. 273 – 274, 1005 – 1018.
Ducloux, J., 1989. Notice explicative de la carte pe´dologique de Fontenay-le-Comte (C-14). In: Service de´tude des sols. INRA, Orle´ans, 204 pp.
Emerson, W.W., 1967. A classification of soil aggregates based on their coherence in water. Aust. J. Soil Res. 5, 47 – 57. Gautronneau Y., Manichon H., 1987. Guide me´thodique du
profil cultural. GEARA/CEREF, Lyon.
Greenland, D.J., Rimmer, D., Payne, D., 1975. Determination of the structural stability class of English and Welsh soils, using a water coherence test. J. Soil Sci. 26 (3), 294 – 303. Gregory, P.J., Gowan, Mc., Biscoe, P.U., Hunter, B., 1978. Water relations of winter wheat: I-growth of the root system. J. Agric. Sci. Camb. 91, 91 – 102.
Guyot J., Delmas A.B., Jacquin M., 1984. Ame´lioration de la structure de sols non sale´s par le gypse. Colloque ‘Fonc-tionnement hydrique et comportement des sols’ Associa-tion Franc¸aise pour l’Etude du Sol (AFES) Dijon, 257 – 282.
Halitim, A., Robert, M., Tessier, D., Prost, R., 1984. Influence des cations e´changeables (Na, Ca, Mg) et de la concentra-tion saline sur le comportement physique (re´tenconcentra-tion en eau, conductivite´ hydraulique) de la montmorillonite. Agronomie 4 (5), 129 – 145.
Hallaire, V., Azib, M., Curmi, P., Cheverry, C., 1996. Physical and chemical variations within prisms of a saline polder clay in relation to seasonal changes. Eur. J. Soil Sci. 47, 463 – 471.
He´nin, S., Gras, R., Monnier, G., 1969. Le profil cultural. In: Principes de Physique du Sol. Masson, Paris, 332 pp. Lafond R., Verger F., 1965. Mine´ralogie des argiles du littoral
et des rivie`res du marais poitevin. C. R. Acad. Sc. Paris, t. 260. Groupe 9.
Loveday J., Pyle J., 1973. The Emerson dispersion test and its relationship to hydraulic conductivity. CSIRO, Division of soils Technical Paper No. 15.
Messing, I., 1989. Estimation of the saturated hydraulic con-ductivity in clay soils from soil moisture retention data. Soil Sci. Soc. Am. J. 53, 665 – 668.
Messing, I., Jarvis, N.J., 1990. Seasonal variation in field-satu-rated hydraulic conductivity in two swelling clay soils in Sweden. Soil Sci. 41, 229 – 237.
Meynard J.M., 1985. Construction d’itine´raires techniques pour la conduite du ble´ d’hiver. The`se de Docteur-Inge´-nieur, INA-PG, Paris, 297 pp.
Morizet, J., Dejou, J., Guyot, J., 1970. Principales caracte´ris-tiques physico-chimiques des sols de types vertique et sodique dans le marais rochefortais a` Saint Laurent de la Pre´e (Charente Maritime). Bull. AFES Sci. Sol. 5, 11 – 24. Moreno, F., Cabrera, F., Andreu, L., Vaz, R., Martin-aranda, J., Vachaud, G., 1995. Water movement and salt leaching in drained and irrigated marsh soils of Southwest Spain. Agri. Water Manag. 27, 25 – 44.
Pons Y., 1985. Incidence de l’abaissement du niveau d’eau hivernal sur le rendement du ble´ dans les Marais de l’Ouest. In ‘Conditions et effets des exce`s d’eau en agricul-ture’. Se´minaire Commission Agrome´te´orologie de l’INRA, 123 – 130.
Pons, Y., 1988. Effect of water table on yield and root depth of winter wheat in the French West Central Atlantic Marshlands. Agri. Water Manag. 14, 35 – 42.
Y.Pons et al./Europ.J.Agronomy12 (2000) 269 – 279 279
Pons Y., Martineau G., 1983. Description d’un test de com-portement a` l’eau pour de´terminer la classe de stabilite´ structurale des sols argileux des marais de l’Ouest. INRA-DRSAD, Domaine Expe´rimental de St Laurent de la Pre´e. 16 pp.
Quirk, J.P., Schofield, R.K., 1955. The effect of electrolyte concentration on soil permeability. J. Soil Sci. 6, 163 – 178. Rands J.G., 1984. De´te´rioration des syste`mes de drainage souterrain due a` la de´floculation dans les terrains mare´cageux. Colloque ‘Fonctionnement hydrique et com-portement des sols’ Association Franc¸aise pour l’Etude du Sol (AFES) Dijon, 257 – 282.
Salin R., 1983. Etude pe´dologique dans le marais de Rochefort. INRA Paris. 200 pp.Cartes, 1:25 000. Shainberg, I., Rhoades, J.D., Prather, R.J., 1980. Effect of low
electrolyte concentration on clay dispersion and hydraulic conductivity of sodic soils. Soil Sci. Soc. Am. J. 45, 273 – 277.
Shainberg, I., Rhoades, J.D., Suarez, J.D., Prather, R.J., 1981. Effect of mineral weathering on clay dispersion and hy-draulic conductivity of sodic soils. Soil Sci. Soc. Am. J. 45, 287 – 291.
Tessier D., 1984. Etude expe´rimentale de l’organisation des mate´riaux argileux. Hydratation, gonflement et structura-tion au cours de la dessiccastructura-tion et de la re´humectastructura-tion. The`se Dr d’Etat, Univ. Paris VII, I.N.R.A. Versailles e´d., 361 pp.
Tessier, D., Pedro, G., 1980. Sur les proprie´te´s de gonflement des argiles dans les sols. C.R. Acad. Soc. Paris 291 (5), 461 – 464.
Trafford, B.D., Oliphant, J.M., 1977. The effect of different drainage systems on soil conditions and crop yield on a heavy clay soil. Expl. Husb. 32, 75 – 85.
VanHoorn, J.W., 1958. Results of a ground water level exper-imental field with arable crops on clay soil. Neth. J. Agri. Sci. 6, 1 – 10.
VanHoorn J.W., 1981. Drainage of heavy soils. In: M.J. Gardiner (Ed), Land Drainage Seminar, Cambridge, pp 57 – 72.
Welbank, P.J., Gibb, M.J., Taylor, P.J., Williams, E.D., 1974. Root growth of cereal crops. Rep. Rothamsted Expl. Sta. 2, 26 – 66.
Wilbert J., 1978. Notice explicative de la carte pe´dologique de Lesparre (G-17). Service d’e´tude des sols, INRA, 220 pp.
.