AN EVALUATION OF THE EFG GROWTH MODEL IN ITS CAPACITY
TO PREDICT AMINO ACID REQUIREMENTS IN BROILERS
B. Indarsih 1 and R.A.E. Pym2
1 Department of Animal Production, Faculty of Animal Science, University of Mataram, Jl. Majapahit No. 62 Mataram , 83125. NTB, Indonesia
2
Department of Farm Animal Medicine and Production
School of Veterinary Science, University of Queensland , St. Lucia, QLD 4072 Australia Corresponding Email:[email protected]
Received November 12, 2009 ; Accepted February 10, 2010
ABSTRACT
An experiment imposing the multi continuous phase feeding was carried out to evaluate the EFG (Emman, Fisher and Gous) Growth Model in its capacity to predict amino acid requirements in broilers. Birds were fed using blended summit (247.91g/kg CP, 3200 kcal of ME /kg) and dilution (166.26 g/kg CP, 3200 kcal of ME g/kg ) diets and offered to 2-4 or 8 phases. Two hundred male day-old broiler chicks of two commercial strains (A=Ingham and B = Steggles) were used. The predicted responses were greater than the observed both gain (g/d) and feed intake (g/d). The discrepancy between the observed and predicted gain in the strain A and B birds, showed a different pattern, with a marked difference during the early growing period, with a degree of convergence in the late growing period for the strain A but the reverse picture for the strain B. This shows that strain characterization is not accurate due to an inadequate definition of the genotypes by the model. Non agreement between predicted and determined gain and feed intakes provided little benefit in moving towards a more frequent change in diet to accommodate predicted growth-related changes in amino acid requirements.
Keywords : broiler, feed intake, growth, predicted, observed
INTRODUCTION
Although the general nature of growth and body composition response in broilers to dietary essential amino acids has been well documented, there is a need to provide a means of predicting nutrient requirements and actual growth performance of birds of a given genotype at given ages when housed and fed under specified conditions.
Broiler growth models have been designed to stimulate the growth of the individual bird based on a theory of growth and feed intake (Fisher and Gous, 1998). Account must be taken of maintenance requirements and of gains of body protein and feather (Hurwitz et al., l978; Talpaz et al., l986). Difficulties in predicting animal growth are encountered because of the nonlinear growth response (Roush et al., 1994; Wang and Zuidhof, 2004) and dynamics of the growth response to changes in dietary amino acid concentration (Roush et al., 1994) and the potential interaction between amino acids (Kidd et al., 1997). In addition to dietary factors, there is the effect of environmental temperature on food intake and
further, under high temperature, growth prediction becomes difficult due to a decrease in the rate of protein gain (Hruby et al., l994). Excesses (Latshaw, l993) and deficiencies (Carew et al., l997) in the supply of dietary amino acids both contributes to a reduction in growth and feed intake which is difficult to model. Previous predictive models of chickens (Tzeng and Backer, l981; Muramatsu etal., 1991) and pigs (Knap and Schrama, l996; Ferguson et al., l997) growth were more based on a mathematical model. These studies developed an equation, which allowed the prediction of the dynamic changes in growth.
Many different growth models have been proposed such as Chickpot, Walla Model, Fortell Broiler, Hurwitz, IGM, Pesti Brill Model and Edinburg Model 1980 (Harlow and Ivey, 1994), Covariance Structure Model (Rosario et al., 2007), Hyperbolastics Models (Ahmadi and Mottaghitalab, 2007), and were used in experimental and commercial applications. However, the EFG Growth Model is well known model and have been developed and revised for improvement.
capacity of the EFG Growth Model in predicting broiler’s performance through multiple continuos phase feeding program using summit and dilution diet approaches which the advantage is that food intake is unaffected by dietary imbalance or deficiencies of a specific amino acid (Emmans, l987).
MATERIALS AND METHODS
Birds and housing
Two hundred and forty male day-old broiler chicks of two commercial strains A = Ingham and B = Steggles, were allocated to twenty four brooder cages, with ten birds per cage and were individually housed from 20 to 40 days of age. Temperature was gradually decreased from 31ºC at the first week until it reached 25ºC at d 12, after which it was held at 25ºC to 19ºC at day 42. The lighting program was 23 h light for the first two days, which was reduced to 18 h/d for the remainder of the experiment.
Experimental design
The summit (247.91g/kg CP, 3200 kcal of ME /kg) and dilution (166.26g/kg CP, 3200 kcal of ME g/kg) diets were blended together to make the two-, four- and eight-dietary regimen across the 40-day growth period. The two-phase feeding regimen comprised a diet formulated to meet the amino acid requirements of a 10-day old bird and given to the birds from day-old to 20 days of age and the second diet was formulated to meet the amino acid requirements of a 30-day old bird and given to the birds from 20 to 40 days of age. Similarly, these procedures were applied for the four and the eight-phase feeding regimen. The nutrient requirements were estimated separately for each of the two commercial strains using the EFG Growth Model. The ingredient and nutrient contents of the experimental diets are shown in Table 1. predicted value by the EFG Growth Model.
The growth model Model description
The EFG Broiler Growth Model implements
a theory of growth and feed intake in broilers outlined by Emmans and Fisher (l986) and developed further by Emmans (1987, 1995). The principal features of the model are as follows: Firstly; potential growth, Secondly; by assuming that birds have a purpose to achieve their potential growth of body protein – a general theory of ad libitum feed intake can be elaborated (Emmans, l987). Thirdly; by analysing how the environment, both physical and nutritional, will prevent a bird achieving its potential, actual performance under defined conditions can be computed. Fourthly; nutritional transaction (energy and amino acids only) are considered in conventional ways except that food energy is computed as “ effective ” energy (Emmans, 1995) and not in the more limited way as ME. Fifthly; by using these principles the model simulates the growth of body and feather protein, fat, water and ash over successive intervals of time with daily summary of outputs. At each stage, the composition of the body is computed using equations based on allometry with body protein weight. Biological and economic indexes of performance allow the results to be assessed.
The observed growth and feed intake responses are compared with responses predicted from the Emmans, Fisher and Gous (EFG) Broiler Model, described above. The experiments described provide an opportunity to determine the capacity of the model to predict both nutrient requirements and performance outcomes in terms of growth and feed intake of different genotypes. The genotypes used in the study had been characterised for the purposes of the model (Gous et al., l996). Five components of growth and development in each genotype : mature protein weight, the rate of maturing of both body and feather protein and the lipid to protein ration in the body at maturity. To obtain this information the genotypes were to maturity under a near ideal environment on a feed that contained sufficient of all the essential nutrients, with serial samples of birds taken from hatching through to maturity.
Broiler Growth Model version 4.2.
Model inputs related to nutritional manipulation and recorded environmental factors. In terms of nutrient inputs, dietary protein and fat digestibility in the model during the starting period both were set to 90 %. In the absence of specific amino acid digestibility values, amino acid digestibility was set to 90 % for all dietary amino acids.
In estimating house temperature, the following equation of Hurwitz et al. (l985) was
used : Tin= 2.6 + 0.86 Tout (Syx = 1.7, R = 0.946)
5<Tout<30
Where, Tin is the average temperature inside
the house and Tout is the average temperature in
the meteorological both maximum and minimum data of local temperatures.
Comparison of observed and predicted analysis
Data derived from this experiment was compared with the outcomes predicted by the
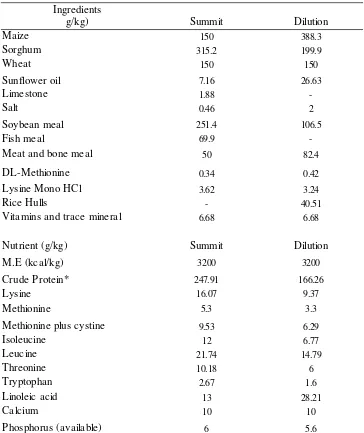
Summit Dilution
Maize 150 388.3
Sorghum 315.2 199.9
Wheat 150 150
Sunflower oil 7.16 26.63
Limestone 1.88
-Salt 0.46 2
Soybean meal 251.4 106.5
Fish meal 69.9
-Meat and bone meal 50 82.4
DL-Methionine 0.34 0.42
3.62 3.24
Rice Hulls - 40.51
Vitamins and trace mineral 6.68 6.68
Nutrient (g/kg) Summit Dilution
3200 3200
Crude Protein* 247.91 166.26
Lysine 16.07 9.37
Methionine 5.3 3.3
9.53 6.29
12 6.77
21.74 14.79
10.18 6
2.67 1.6
13 28.21
Calcium 10 10
Phosphorus (available) 6 5.6
*all values from this asterisk onward are determined
Table 1. Ingredient and Nutrient Composition (g/kg) of the Summit (day-old) and Dilution (40-day-old) Diets Blended together to Produce the Diets for the 2, 4 and 8-Dietary Regimens
Ingredients g/kg)
Lysine Mono HCl
M.E (kcal/kg)
Methionine plus cystine Isoleucine
EFG model (Hurwitz et al., l985). Comparison here was based on performance data growth rate (g/d) and feed intake (g/d). The growth performance comparison is fundamental since the model bases its evaluation of a feeding strategy on the effect on weight gain. This is the criteria used to define when a nutritional change should take place.
Hurwitz et al. (l985) suggested that in validating a model, there is a need to have independent observation created under different conditions. The authors of the EFG Broiler Growth Model acknowledge that the model cannot be regarded as being absolutely accurate under all conditions because there are certain aspects of the simulation process for which little or no information is available.
Whilst the model has the capacity to predict outcomes to nutritional manipulation and certain management/environmental factors, there are some procedures which the model has no intuitive capacity to deal with. In the present experiment,
the disruption caused by the move from the group brooder cages to single grower cages is one such procedure. The model, however have a “ growth constraint ” setting, which can be manually adjusted to accommodate such effects. This can be achieved by adjustment to the height of histogram bars at 3.5 day intervals from hatching. The user can thus impose a growth constraint at
any stage in the growing period to accommodate some management factor not included as an input. The program will incorporate this into the predicted performance outcomes.
It is necessary to note that the comparison made can identify problems with the model's predictive capacity which can be identified from the poor agreement between observed and predicted outcomes. However, if there is good agreement, such result does not necessarily " validate" the model. A high proportion of close prediction would suggest that under the majority of conditions (as determined by the experiments in question) the model is effective in predicting
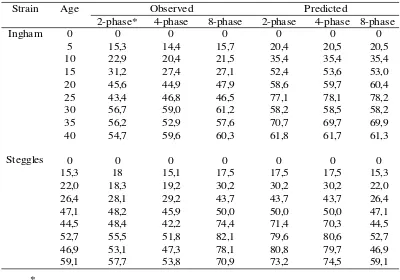
Strain Age Observed Predicted
2-phase* 4-phase 8-phase 2-phase 4-phase 8-phase
0 0 0 0 0 0 0
5 15,3 14,4 15,7 20,4 20,5 20,5
10 22,9 20,4 21,5 35,4 35,4 35,4
15 31,2 27,4 27,1 52,4 53,6 53,0
20 45,6 44,9 47,9 58,6 59,7 60,4
25 43,4 46,8 46,5 77,1 78,1 78,2
30 56,7 59,0 61,2 58,2 58,5 58,2
35 56,2 52,9 57,6 70,7 69,7 69,9
40 54,7 59,6 60,3 61,8 61,7 61,3
0 0 0 0 0 0 0
15,3 18 15,1 17,5 17,5 17,5 15,3
22,0 18,3 19,2 30,2 30,2 30,2 22,0
26,4 28,1 29,2 43,7 43,7 43,7 26,4
47,1 48,2 45,9 50,0 50,0 50,0 47,1
44,5 48,4 42,2 74,4 71,4 70,3 44,5
52,7 55,5 51,8 82,1 79,6 80,6 52,7
46,9 53,1 47,3 78,1 80,8 79,7 46,9
59,1 57,7 53,8 70,9 73,2 74,5 59,1
2 = diet changed every 20 days 4 = diet changed every 10 days 8 = diet changed every 5 days
Table 2. Gain g/d per Bird from 0-40 Days of Age According to Three Multi Continuos Feeding Schedules
Ingham
Steggles
outcomes from variation in the parameters tested over the range in question (Moughan et al., 1987).
RESULTS AND DISCUSSION
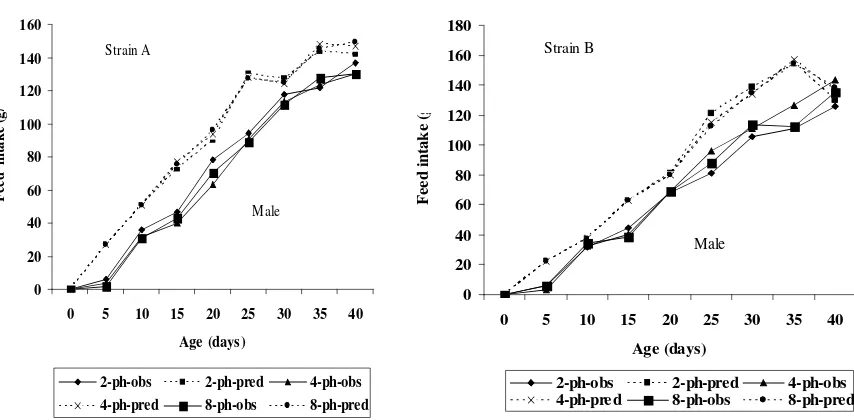
A comparison of the experimental results (observed) and model prediction (predicted) values on growth rate and/or feed intake were presented in Table 2 and 3 as well as seen in Figure 1 and 2. In both strains, predicted growth rate was markedly greater than obtained under the three nutritional regimens, but there was essentially very little difference in predicted or observed growth rates between the three nutritional regimens. Similarly, observed feed intake was substantially lower under all nutritional regimens than predicted, but there was again marginal difference in observed or predicted feed intake between the three nutritional regimens. The discrepancy between the observed and predicted gain in the strain A and B, showed a different pattern, with a marked difference during the early growing period, with a degree of convergence in the late growing period (week 6
and 8) for the strain A birds, but the reverse picture for the strain B birds. This reflects an inaccurate strain characterisation, which could arise from an inadequate definition of the genotypes by the model or a change in the genotype of the strain(s) by the breeders since the strain characterisation exercise.
The lack of difference in observed and predicted gain and food intake between the three nutritional regimens suggests that there may be little benefit in moving towards a more frequent change in diet to accommodate predicted growth-related changes in amino acid requirements. Interestingly, it is not only the observed responses in growth rate to the three nutritional regimens, which show no benefit of the 8- over the 2-phase regimen, there is no consistent predicted benefit of the former regimen in either strain. In terms of growth rate, at least, there would appear to be little gained from more closely matching growth-related changes in amino acid requirements. However, Gutierreez et al. (2008) showed that continuos multiphase feeding improved BW gain during finishing periods using commercial
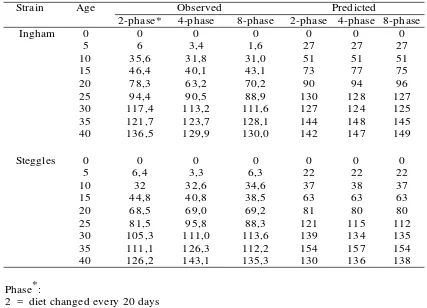
Strain Age Observed Predicted
2-phase* 4-phase 8-phase 2-phase 4-phase 8-phase
0 0 0 0 0 0 0
5 6 3,4 1,6 27 27 27
10 35,6 31,8 31,0 51 51 51
15 46,4 40,1 43,1 73 77 75
20 78,3 63,2 70,2 90 94 96
25 94,4 90,5 88,9 130 128 127
30 117,4 113,2 111,6 127 124 125
35 121,7 123,7 128,1 144 148 145
40 136,5 129,9 130,0 142 147 149
0 0 0 0 0 0 0
5 6,4 3,3 6,3 22 22 22
10 32 32,6 34,6 37 38 37
15 44,8 40,8 38,5 63 63 63
20 68,5 69,0 69,2 81 80 80
25 81,5 95,8 88,3 121 115 112
30 105,3 111,0 113,6 139 134 135
35 111,1 126,3 112,2 154 157 154
40 126,2 143,1 135,3 130 136 138
2 = diet changed every 20 days 4 = diet changed every 10 days 8 = diet changed every 5 days
Table 3. Food Intake g/d per Bird from 0-40 Days of Age according to Three Multi Continuos Feeding Schedules
Ingham
Steggles
industry basal diets based on the EFG Growth Model.
The generally higher predicted food intakes are reflected in the higher predicted growth rates across all dietary regimens. This leads to the suggestion is that food intake and hence growth rates were constrained, possibly by management and environmental factors associated with the
rearing conditions and which were not incorporated in the model inputs. This is in line with Gous (2007a) that some constraint to potential performance have not been adequately described from which are a challenge to modellers. Gous (2007 b) also found that one of constraints for a bird to achieve the required food intake was the favourable environment. The
Figure 1. Comparison of the Experimental Results (observed) and Model Prediction (predicted) Values on Gain (g/d)
difficulties found by Wang and Zuidhof (2004), who using a nonlinear mixed Gompertz Model in measuring growth parameters were due to variation between birds within genotypes. In agreement with Schiavon et al. (2007) that close ideal the procedure, improvement in recording farm protocol and other factors contributing such as the description of the physical environment which affect the potential growth should be met. In this study, non agreement between predicted and observed feed intakes and growth rate indicated that nutritional or environmental conditions were not perfect to allow the protein and lipid growth to proceed at their potential during the growth period
CONCLUSION AND SUGGESTION
The EFG Broiler Model can be used to predict a broiler growth data set and the results of predicted responses both growth and food intake were greater the observed values. The capacity to predict the parameters seems dependent on the nutritional and physical environment that allow the growth of protein and lipid and to support the growth of genetic potential. A little benefit was obtained from a more frequent change in diet to accommodate predicted growth-related changes in amino acid requirements. Improvement continue have to be made in attempts to provide agreement between predicted and actual results.
ACKNOWLEDGEMENT
We would like to thank Prof. R. M. Gous of the University of Natal, South Africa, and Dr. Colin Fisher of EFG Software Natal for their generosity in donating the software of the EFG Broiler concentrations of chicks fed diets deficient in essential amino acids. Poult. Sci. 76:
1398-1404.
Emmans, G.C. 1995. Problems in modeling the
growth of poultry. World’s Poult. Sci. J. 51: 77-89.
Emmans, G.C. and C. Fisher. 1986. Problems of nutritional theory. In: Nutritional Requirements and Nutritional Theory. C. Fisher and K.N. Booman (Eds). London. Butterworth, pp. 9-57.
Emmans, G.C. l987. Growth, body composition and feed intake. World’s Poult. Sci. J. 47: broiler breeders. Poult. Sci. 77: 124-133. Gous, R.M. 2007a. Predicting nutrient responses
in poultry: future challenges. Animal, 1. Pages 57-65. doi:10.1017/ S1751731107657784.
Gous, R.M. 2007b. Methodologies for modeling energy and amino acid responses in poultry. R. Bras. Zootec. 36:263-2007 ISSN on line:1806-9290.
Gous, R.M., R. A. E. Pym, P. E. Mannion and J.X. Wu. l996. An evaluation of the parameters of the Gompertz Growth Equation that describe the growth of eight strains of broilers. Ed. D.Balnave. Proc. Aust. Poult. Sci. Symp. 8: 174-177.
Gutierrez, O., N. Surbakti, A. Haq, J.B. Carey and C.A. Baile. 2008. Effect of continuous multiphase feeding schedules on nitrogen excretion and broiler performance. J. Appl. Poult. Res. 17:463–470 doi:10.3382/ chicks. Poult. Sci. 57: 197-205.
management of turkey production: dietary nutrient density, marketing age, and environmental temperature. Poult. Sci. 64: 1415-1423.
Kidd, M.T., B.J. Kerr and N.B. Anthony. 1997. Dietary interaction between lysine and threonine in broilers. Poult. Sci. 76: 608-614.
Knap, P.W. and J.W. Schrama. l996. Simulation of growth in pigs: approximation of protein turn-over parameters. Anim. Sci. 63: 533-547.
Latshaw, J.D. l993. Dietary lysine concentrations from deficient to excessive and the effects on broiler chicks. Br. Poult. Sci. 34: 951-958.
Moughan, P.J., W.C. Smith and G. Pearson. l987. Description and validation of a model simulating growth in the pig (20-90 kg live weight). New Zealand J. Agric. Res. 30: 481-489.
Muramatsu, T., H.Ohshima, M.Goto, S.Mori and J.Okumura. l991. Growth prediction of young chicks. Do equal deficiencies of different essential amino acids produce equal growth responses?. Br. Poult. Sci. 32:
139-149.
Rosărio, M.F., M.A.N. Silva, A.A.D. Coelho and
V.J.M. Savino. 2007. Estimating and predicting feed conversion in broiler chickens by modelling covariance structure. Int. J. Poult. Sci. 6 (7):508-514.
Roush, W.B., G.F. Barbato and T.L. Cravener. l994. A nonlinear dynamical (Chaos) approach to the analysis of broiler growth. Poult. Sci. 73: 1183-1195.
Schiavon, S., L.Gallo, P.Carnier, F.Tagliapietra , C.Ceolin, A.Prandini and A. Piva 2007. Use of simple body measurements and allometry to predict the chemical growth and feed intake in pigs. Ital J. Anim. Sci. 6: 27-44.
Talpaz, H., J.R. De la Toree, P.H.J. Sharpe and S. Hurwitz. l986. Dynamic optimization model for feeding of broilers. Agric. Systems 20: 121-132.
Tzeng, R.Y and W.A. Becker. l981. Growth patterns of body and abdominal fat weights in male broiler chickens. Poult. Sci. 60: 1101-1106.