THIS REPORT CONTAINS ASSESSMENTS OF COMMODITY AND TRADE ISSUES MADE BY USDA STAFF AND NOT NECESSARILY STATEMENTS OF OFFICIAL U.S. GOVERNMENT POLICY
Date: GAIN Report Number:
Approved By:
Prepared By:
Report Highlights:
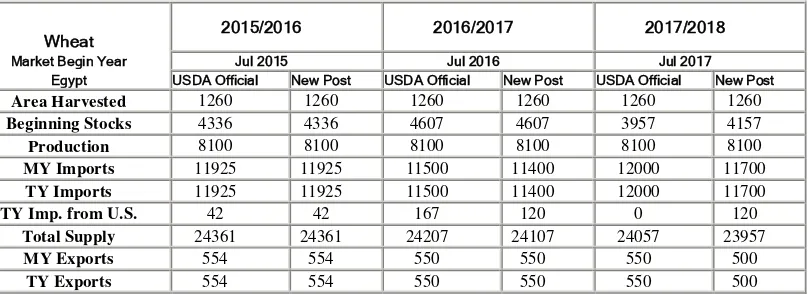
FAS Cairo forecasts Egypt’s wheat production in marketing year (MY) 2017/18 at 8.1 million metric tons (MMT). Wheat imports are forecast in MY 2017/18 at 11.7 MMT. Imports in MY 2016/17 are revised downward from USDA’s official forecast figure of 11.5 MMT to 11.4 MMT due to limited access to foreign currency needed for wheat import purchases between July-October 2016. Corn imports are forecast in MY 2017/18 at 8.8 MMT. Post is revising downwards its MY2016/17 import figures to 8.7 MMT from USDA’s estimate of 9 MMT. Broken rice exports are forecast in MY 2017/18 at 100,000 MT, contingent on the government permitting the resumption of exports. Despite the
accumulation of larger than normal stocks in MY 2016/17, Egypt continues to restrict rice exports. Executive Summary
Ahmed Wally, Agricultural Specialist and Mariano J. Beillard, Senior Regional Agricultural Attaché Ali Abdi, Minister-Counselor
Egypt’s Wheat and Corn Imports Hold Steady, Rice Exports
Remain Restricted
Grain and Feed Update 2017
Egypt
FAS Cairo forecasts Egypt’s total wheat production in marketing year (MY) 2017/18 at 8.1 million metric tons (MMT). Planted area at about 1.26 million hectares (ha) remains the same. Post’s forecast production figures remain unchanged from USDA‘s official MY 2016/17 estimates. USDA’s official MY 2016/17 wheat consumption estimate of 19.7 MMT has been revised downward by 1.5 percent. Inflated prices charged for private-sector baked goods have driven consumer demand down by 20-25 percent.
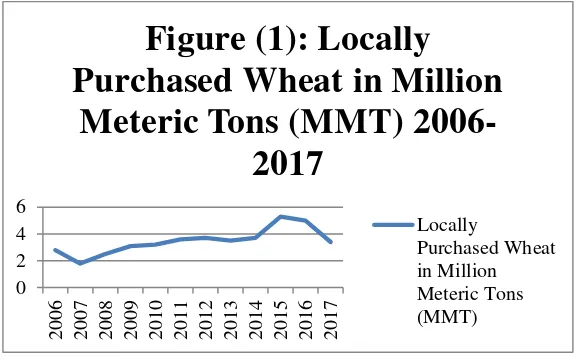
On July 16, 2017, the Ministry of Supply and Internal Trade (MOSIT) announced completing the purchase of 3.4 MMT of local wheat. The price paid by the government for local wheat ranged
$210/MT to $218/MT based on quality and moisture levels. Wheat imports are forecast in MY 2017/18 at 11.7 million metric tons. Imports in MY 2016/17 are revised downward from USDA’s official forecast figure of 11.5 MMT to 11.4 MMT due to limited access to foreign currency needed for wheat import purchases between July-October 2016.
The General Authority for Supply Commodities (GASC), an agency of the MOSIT, is the country’s single largest purchaser of wheat; issuing 27 import tenders for 5.85 MMT of wheat in MY 2016/17 compared to 4.5 MMT in MY 2015/16. The three largest suppliers in MY 2016/17 were Russia (4.47 MMT), Romania (1.26 MMT), and Ukraine (560,000 MT). The average price paid by the GASC during the last two tenders of MY 2016/17, including freight, was roughly $205 per metric ton.
FAS Cairo forecasts Egypt’s corn imports in MY 2017/18 at 8.8 million metric tons. Post is revising downwards its MY2016/17 import figures to 8.7 MMT from USDA’s estimate of 9 million metric tons. The Egyptian pound’s devaluation (November 3, 2016) doubled the cost of imported corn, slowing imports.
Post forecasts Egypt’s broken rice exports in MY 2017/18 at 100,000 MT, contingent on the government permitting the resumption of exports. Despite the accumulation of larger than normal stocks in MY 2016/17, the government is continuing to restrict rice exports. We anticipate a clearer picture to emerge of whether restrictions might be eased following the MY 2017/18 (August-September) harvest.
Potentially Egypt can export upwards of 500,000 MT of milled rice at about $600/MT where it not for the restrictions in place.
FAS Cairo forecasts Egypt’s total wheat production in marketing year (MY) 2017/18 at 8.1 million metric tons (MMT). Planted area at about 1.26 million hectares (ha) remains the same. Post’s forecast production figures remain unchanged from USDA’s official MY2016/17 estimates.
Population growth, land fragmentation, as well as urban encroachment on the fertile lands in the Nile Delta are hindering horizontal expansion (i.e., area planted) efforts. As agricultural lands are taken out of production increasingly for residential construction, externalities such as decreased water availability and drainage are affecting yields in adjacent fields. The Ministry of Agriculture and Land Reclamation (MALR) is consequently focusing increasingly on vertical expansion (i.e., increasing yields by unit area).
Domestic Wheat Procurement:
Post estimates that Egypt in MY 2017/18 will procure 3.5-3.7 MMT of locally produced wheat. The government procures local wheat from April 15 to July 15. On July 16, 2017, the Ministry of Supply and Internal Trade (MOSIT) announced completing the purchase of 3.4 MMT of local wheat. The price paid by the government for local wheat ranges Egyptian pound (EGP) 555 to EGP 575 per ardeb (or $210/MT to $218/MT) based on quality and moisture levels (Figure 1); one ardeb is equal to
approximately 150 kilograms.
SOURCE: FAS Cairo office research.
Table (1): U.S. Dollar – Egyptian Pound, Foreign Exchange Rates - 2016 to 2017
Pre Devaluation (Nov. 3, 2016 ) $1.00 ~ EGP 8.88 Post Devaluation (July 2017) $1.00 ~
EGP 17.60 SOURCE: FAS Cairo office research.
1- The Holding Company for Food Industries (1 MMT)
2- The Egyptian Holding Company for Silos and Storage (1.56 MMT) 3- The General Company for Silos and Storage (143,000 MT)
4- The Egyptian Agriculture Bank (697,000 MT)
Consumption:
FAS Cairo forecasts Egypt’s total wheat consumption in MY 2017/18 at 19.7 MMT, up 1.5 percent from MY 2016/17 consumption estimate of 19.4 million metric tons. Post attributes the uptick to 2.2 percent increase in food, seed and industrial use (FSI) consumption. The rise in FSI consumption of wheat is driven by population growth (growing at 2.5 percent per annum). Egypt with a population of 97 million (Central Intelligence Agency, est., July 2017) is adding roughly 2 million people per year. Today it is host to an estimated 5 million refugees from Iraq, Syria, Libya, Yemen, and Sudan.
USDA’s official MY 2016/17 wheat consumption estimate of 19.7 MMT is revised downward by 1.5 percent. Egypt’s annual inflation rate averaged 31.6 percent during January-June, 2017, driven mostly by an average of 38.3 percent increase in food prices. Post attributes inflated prices charged for private-sector baked goods for driving consumer demand down by 20-25 percent. We find that the cost of 72 percent extraction flour used by private bakeries and the large retailers’ in-store bakeries has gone up by 100 percent.
Subsidized Baladi Bread Remains at EGP 0.05 ($0.01) per Loaf
The government’s bread subsidy system remains unchanged. Every beneficiary is allowed 150 loaves per month or five loaves per day. “Baladi” (i.e., common, traditional) bread is sold at a subsidized price of EGP 0.05 per loaf ($0.01 per loaf), which is less than one tenth of its cost. The government
compensates bakeries for the difference in production cost. The current cost of subsidizing one loaf of baladi bread is estimated at EGP 0.57 or $0.03.
The current system permits beneficiaries who consume less than the quota amount to convert their bread savings into points (1 point = EGP 0.01). These points may be spent on 44 food products. These may be purchased from 27,000 MOSIT partnered private grocery stores, as well as from 5,000 state-owned consumer complexes. Reportedly the point system costs the government some EGP 5.4 billion annually ($306 million).
Subsidy Program Inefficiencies Being Addressed by the MOSIT (August 1, 2017)
To control wheat flour leakages, the MOSIT along with public and private sector millers, the EGYPTIAN Chamber of Commerce, and the Chamber of Cereal Industries signed an agreement on August 1, 2017, fixing a price for the GASC supplied wheat. The agreement calls for the GASC to sell wheat at EGP 4,000/MT ($227/MT) to public and private sector mills. Millers agreed to sell flour at EGP 4,700/MT ($267/MT); the milled flour sell price is subject to a quarterly review. The 82 percent extraction flour is meant solely for use in baladi bread production.
The agreement aims to enhance the efficiency of the subsidy system. It subsidizes the final product, rather than the cost of the raw materials. It also seeks to generate competition among millers in order to produce higher quality flour, as well as better quality bread. The agreement requires bakers to pay millers for milled flour three days in advance.
The government in FY 2017/18 allocated EGP 85 billion ($4.8 billion) for food subsidies. Of this amount, roughly EGP 46 billion is earmarked for the bread subsidy program while EGP 39 billion is for supply commodities. In FY 2016/17, prior to the devaluation, the budget allocated for food subsidies was EGP 41 billion ($4.7 billion); some EGP 23 billion was allocated for the bread subsidy program while EGP18 billion went for supply commodities.
Trade:
FAS Cairo forecasts Egyptian wheat imports in MY 2017/18 at 11.7 million metric tons. Import figures for MY 2016/17 are revised downward from USDA’s official forecast figure of 11.5 MMT to 11.4 MMT due to limited access to foreign currency for wheat import purchases. This limited access to foreign currency adversely impacted the issuance of letters-of-credit from July-October 2016.
The General Authority for Supply Commodities (GASC), an agency of the MOSIT, is the country’s single largest purchaser of wheat; issuing 27 import tenders for 5.85 MMT of wheat in MY 2016/17 compared to 4.5 MMT in MY 2015/16. The three largest suppliers in MY 2016/17 were Russia (4.47 MMT), Romania (1.26 MMT), and Ukraine (560,000 MT). The average price paid by the GASC during the last two tenders of MY 2016/17, including freight, was roughly $205 per metric ton.
On May 15, 2017, the GASC modified its tender protein specifications. For Black Sea wheat, the protein content of wheat has changed from 12 percent to 12.5 percent. For North and South American wheat, as well as EU-origin wheat the protein content has increased from 11.5 percent to 12 percent.
Traders interpret this shift to herald an opportunity for more participations of U.S. and Canadian-origin wheat in future GASC tenders. Ukr-AgroConsult claims that this import rule will restrict Ukraine participation in GASC tenders. However, as of July 1, 2017, Ukrainian wheat has been successfully tendered in nine GASC tenders; purchases reaching 235,000 MT compared to 60,000 MT during the same period in July 2016.
Table (2): The GASC’s Wheat Tenders, MY 2016/17
Tender No. Tender date Shipment Period Origin Tonnage /MT Total/MT
1 12 July 2016 Aug 10-20 Russia
Ukraine
120,000 60,000
2 15 July 2016 Aug 21-30 Russia
Romania Ukraine
60,000 60,000
NOTE: As of July 2017, the GASC purchased 2.61 MMT of wheat, with Russia now supplying 65 percent of total purchases (see, Table 3).
Table (3): The GASC’s Wheat Tenders, July-September 2017
Tender
FAS Cairo forecasts ending stocks in MY 2017/18 at 3.75 MMT, a decrease of 11 percent from Post’s MY 2016/17 estimate of 4.15 MMT; which was revised upward from USDA’s official estimate of 3.95 million metric tons. The increase in MY 2016/17 ending stocks is due to lower FSI consumption.
The General Authority for Supply Commodities keeps normally a three-to-four month supply of stocks (including wheat) in the import pipeline, while an additional one-month supply of wheat transits to Egypt.
Wheat 2015/2016 2016/2017 2017/2018
Market Begin Year Jul 2015 Jul 2016 Jul 2017
Egypt USDA Official New Post USDA Official New Post USDA Official New Post
Feed and Residual 1400 1400 1400 1400 1300 1300
FSI Consumption 17800 17800 18300 18000 18700 18400
Total Consumption 19200 19200 19700 19400 20000 19700
Ending Stocks 4607 4607 3957 4157 3507 3757
Total Distribution 24361 24361 24207 24107 24057 23957
Yield 6.4286 6.4286 6.4286 6.4286 6.4286 6.4286
(1000 HA) ,(1000 MT) ,(MT/HA)
Corn
Production:
FAS Cairo forecasts corn production in MY 2017/18 at 6 MMT, largely unchanged from MY 2016/17. Planted area at 750,000 hectares similarly remains the same. Reportedly white corn planted area reaches 500,000 hectares, with yellow corn plantings accounting for the balance.
The government has outlined a national strategy to increase feed corn acreage; it aims to reach 1.1 million hectares by calendar year (CY) 2020. The strategy incorporates improved extension services, the
use of higher-yielding seed, the adoption of procurement price processes encouraging growers to make more timely decisions, and improved marketing channels.
The Ministry of Agriculture and Land Reclamation during this review period midwifed a contract between the Union of Poultry Producers (UPP), agricultural cooperatives, and the Egyptian Agriculture Bank. The contract requires the UPP to buy domestic corn at EGP 3,400/MT ($193/MT); this is the procurement price set in mid-July 2017 by the ministry.
This season the ministry established 500 extension fields across Egypt, showcasing new maize hybrids produced by the Agriculture Research Center (ARC), as well as demonstrating good agricultural practices needed for obtaining higher yields while decreasing post-harvest losses.
Consumption:
FAS Cairo forecasts corn consumption in MY 2017/18 at 15 MMT, up 3.4 percent from the MY 2016/17 estimate of 14.5 million metric tons. The MY 2016/17 estimate is revised downward from USDA’s official estimate by 4.1 percent due to a 70 percent increase in poultry feed prices. Domestic poultry feed (60-70 percent corn) prices have jumped from EGP 4,000/MT ($454/MT) prior to the November 2016 devaluation now to EGP 6,800/MT ($386/MT). Soybean meal prices have also jumped from EGP 4,000/MT ($454/MT) now to EGP 6,800/MT ($386/MT). Despite the drop in dollar value terms, the domestic price of commodities has become increasingly less affordable since the November 2016 devaluation.
Fish feed prices have increased by 75 percent in Egyptian pounds. The price of extruded feed for tilapia increased from EGP 4,000/MT ($454/MT) prior to the devaluation to now EGP 7,000/MT ($398/MT). Extruded feed for sea bass has increased from EGP 12,000 to over EGP 23,000 today. The high price of feed has led to a 40 percent increase in local fish prices.
The surge in grain and feed prices has driven inflation to record highs. The annual rate of inflation climbed to 32 percent in June 2017, versus 24 percent in June 2016. The Central Agency for Public Mobilization and Statistics (CAPMAS) in May 2017 reports that inflation is being driven by price increases for meat and poultry (up 38 percent), fish and seafood (up 55 percent), and bread and grains (up 32 percent).
Trade:
FAS Cairo forecasts imports in MY 2017/18 at 8.8 MMT, up 2.3 percent from Post’s MY 2016/17 estimate. Post is revising downwards MY 2016/17 imports to 8.6 MMT from USDA’s estimate of 9 million metric tons. We attribute the drop to foreign exchange challenges faced by importers prior to the November 2016 devaluation. Following the devaluation, prices have more than doubled in the domestic market. Imports have now slowed due to a reduction in the consumption rates by the poultry,
aquaculture, and dairy industries.
Egyptian importers are dissatisfied with U.S. corn’s quality, mainly the high percentage of broken kernels. Corn imports from October 2016 to July 31, 2017 reached 6.69 million metric tons. Ukraine (3.34 MMT), Argentina (2.2 MMT), and Brazil (475,000 MT) are Egypt’s top three corn suppliers. During this period, Egypt imported 219,000 MT of U.S.-origin corn.
Imports of Distiller’s Dried Grains with Solubles and Corn Gluten.
Imports (January-June 2017) of distiller’s dried grains with soluble (DDGS) have reached 87,600 metric tons. Imports of DDGS in CY 2016 reached 133,000 metric tons. The United States accounts for 99.4 percent of Egypt’s DDGS imports. Imports of corn gluten meal reached 47,200 MT in January-June 2017. Imports of corn gluten meal in CY 2016 reached 148,000 MT.
Both corn gluten meal and DDGS are used with poultry, dairy and beef cattle, and aquaculture rations. Prices of DDGS today in the local market are at EGP 4,300/MT ($244/MT). Prices for corn gluten meal today command EGP 12,400/MT ($704/MT). Prices of corn gluten meal and DDGS have increased by 100 percent because of the float of the Egyptian currency.
Stocks:
Post forecasts corn stocks at 2 MMT in MY 2017/18. The MY 2016/17 stock quantity is raised upward from USDA’s estimate by 5.7 percent driven by slower consumption growth
.
Corn 2015/2016 2016/2017 2017/2018
Market Begin Year Oct 2015 Oct 2016 Oct 2017
Egypt USDA Official New Post USDA Official New Post USDA Official New Post
Area Harvested 750 750 750 750 750 750
Beginning Stocks 2295 2295 2215 2135 2105 2225
Production 6000 6000 6000 6000 6000 6000
TY Imports 8776 8350 9000 8600 10000 8800
TY Imp. from U.S. 847 0 0 0 0 0
Total Supply 17071 16645 17215 16735 18105 17025
MY Exports 6 10 10 10 10 10
TY Exports 6 10 10 10 10 10
Feed and Residual 12450 12100 12700 12100 13400 12500
FSI Consumption 2400 2400 2400 2400 2500 2500
Total Consumption 14850 14500 15100 14500 15900 15000
Ending Stocks 2215 2135 2105 2225 2195 2015
Total Distribution 17071 16645 17215 16735 18105 17025
Yield 8 8 8 8 8 8
(1000 HA) ,(1000 MT) ,(MT/HA)
Rice:
Production:
FAS Cairo forecasts that Egypt’s milled rice production in MY2017/18 will decrease to 4.3 MMT from an estimated 4.8 MMT in MY 2016/17. The projected reduction is attributed to a decrease in the planted area dropping to 762,000 hectares in MY2017/18 from 850,000 hectares in MY 2016/17. Farmers are shifting to plant cotton or yellow corn due to the competitive procurement prices offered by the
government. Post estimates for MY 2016/17 rice production and planted area remain unchanged from USDA official numbers.
Farmers planting rice in MY 2017/18 outside the government’s allotment area of 451,920 hectares face fines of EGP 8,000/ hectare ($454/hectare) compared to EGP 5,328/hectare ($600/ hectare) prior to the November 2016 devaluation. According to a July 2017 report by the Ministry of Irrigation and Water Resources, satellite imagery of the delta revealed that 1.8 million feddans (762,000 hectares) were planted with rice, an increase of 68.6 percent over the government’s allotted area. Farmers are willing take the risk planting rice since it is the cash crop of choice; it is easy to cultivate, high yielding, and profitable.
Consumption:
FAS Cairo forecasts rice consumption at 4.25 MMT in MY 2017/18, similar to MY 2016/17 and in line with official USDA estimates. Rice is heavily consumed in the northern Delta and Suez Canal region, as well as in Cairo and Alexandria. Consumers in urban centers tend to purchase packaged rice, while consumers in rural areas rely more on unpackaged rice.
Domestic packaged rice sells for EGP 6.5/kilogram (kg) in public consumer complexes and at MOSIT outlets. Prices in the retail market range EGP 7-11/kg depending on the brand and quality. Unpackaged rice’s prices range between EGP 5-7/kg and sold mainly in rural villages. Paddy rice prices currently sells for EGP 3,800/MT ($216/MT) compared to EGP 5,200/MT ($295/MT) in March 2017.
The Minister of Supply on August 29, 2017, announced that the ministry will tender twice monthly for rice starting September 1, 2017. It seeks to purchase the new local crop based on market prices. The government’s subsidy program absorbs 70,000 MT of rice per month.
FAS Cairo forecasts Egypt’s broken rice exports in MY 2017/18 at 100,000 MT, contingent on the government permitting the resumption of exports. Despite the accumulation of larger than normal stocks in MY 2016/17, the government is continuing to restrict rice exports. We anticipate a clearer picture to emerge of whether restrictions might be eased following the MY 2017/18 (August-September) harvest. Potentially Egypt can export upwards of 500,000 MT of milled rice at about $600/MT where it not for the restrictions in place.
Efforts by the Agriculture Export Council and the Chamber of Cereal Industries urging the Ministry of Trade and Industry to reconsider its decision may lead to a resolution to resume broken rice exports. Post does not foresee Egyptian milled rice exports in the near future.
Stocks:
FAS Cairo forecasts that ending rice stocks in MY 2017/18 will reach 1.49 MMT, similar to post’s MY 2016/17 estimate, which was revised downward from USDA’s official estimate by 80,000 MT or 5.3 percent. The government’s ban on milled rice and broken rice exports were the main contributors to the large amount of stocks in MY 2016/17.
Rice, Milled 2015/2016 2016/2017 2017/2018
Market Begin Year Oct 2015 Oct 2016 Oct 2017
Egypt USDA Official New Post USDA Official New Post USDA Official New Post
Area Harvested 650 650 850 850 700 762
Beginning Stocks 924 924 924 854 1574 1494
Milled Production 4000 4000 4800 4800 4000 4300
Rough Production 5797 5797 6957 6957 5797 6232
Milling Rate (.9999) 6900 6900 6900 6900 6900 6900
MY Imports 100 80 150 140 50 50
TY Imports 116 80 150 140 50 50
TY Imp. from U.S. 0 0 0 0 0 0
Total Supply 5024 5004 5874 5794 5624 5844
MY Exports 200 200 100 100 100 100
TY Exports 200 200 100 100 100 100
Consumption and Residual 3900 3950 4200 4200 4250 4250
Ending Stocks 924 854 1574 1494 1274 1494
Total Distribution 5024 5004 5874 5794 5624 5844
Yield (Rough) 8.9185 8.9185 8.1847 8.1847 8.2814 8.1785