DEVELOPMENT AND EVALUATION OF SCIENCE AND TECHNOLOGY EDUCATION
PROGRAM USING INTERFEROMETRIC SAR
Y. Ito a, H. Ikemitsu b, K. Nango c
a
Dept. of Technology and Information Education, School of Natural and Living Sciences Education, Naruto University of Education
b
Course of Technology and Information Education, Graduate School of Education, Naruto University of Education
c
Course of Technology Education, College of Education, Naruto University of Education 748 Takashima, Naruto, Tokushima Pref. 772-8502, Japan - (a ito, b [email protected])
Technical Commission VI, WG VI/6
KEY WORDS: Education program, Earth observation, Interferometric SAR, Terrain change, Teaching guidance plan
ABSTRACT:
This paper proposes a science and technology education program to teach junior high school students to measure terrain changes by using interferometric synthetic aperture radar (SAR). The objectives of the proposed program are to evaluate and use information technology by performing SAR data processing in order to measure ground deformation, and to incorporate an understanding of Earth sciences by analyzing interferometric SAR processing results. To draft the teaching guidance plan for the developed education program, this study considers both science and technology education. The education program was used in a Japanese junior high school. An educational SAR processor developed by the authors and the customized Delft object-oriented radar interferometric software package were employed. Earthquakes as diastrophism events were chosen as practical teaching materials. The selected events indicate clear ground deformation in differential interferograms with high coherence levels. The learners were able to investigate the ground deformations and disasters caused by the events. They interactively used computers and became skilled at recognizing the knowledge and techniques of information technology, and then they evaluated the technology. Based on the results of pre- and post-questionnaire surveys and self-evaluation by the learners, it was clarified that the proposed program was applicable for junior high school education, and the learners recognized the usefulness of Earth observation technology by using interferometric SAR. The usefulness of the teaching materials in the learning activities was also shown through the practical teaching experience.
1. INTRODUCTION
Spaceborne synthetic aperture radar (SAR) has been utilized to observe almost the entire surface of the Earth in order to provide dynamic information to a variety of research areas (RSSJ, 2013). Such images that show the results of large-scale crustal movements caused by earthquakes, volcanic activities, and landslides are important teaching materials for protecting individuals and society from future disasters. Educational programs that create an understanding of topographic changes from both scientific and technical viewpoints are necessary for developing disaster prevention programs in countries in which there are many topographic changes.
Interferometric SAR technology provides a two-dimensional (2D) image that shows slight changes in the vast surface of the Earth by processing pairs of data observations from before and after a given event (Hanssen, 2001). Earth observation satellites equipped with SAR have been launched since the 1990s. Some SAR data is currently distributed free of charge on the Internet and thus can be easily used for educational programs. In addition, since the processing capacity of personal computers and the speed of Internet connections has greatly improved, school computer systems are often able to handle a large quantity of data and to communicate with external servers. Learners can process SAR data and create presentations that include many kinds of generated SAR images and interferograms. They can also perform step-by-step interferometric processing using pairs of SAR data. In an implementation for a junior high school in Japan, an educational SAR processor developed by the authors and the customized Delft object-oriented radar interferometric software package
were employed (Kampes et al., 2003; Ito et al., 2014). The presentation included images generated at each step, and the ground deformation was measured by counting the fringes shown by interferometry.
This study proposes a science and technology education program for teaching junior high school students how to use interferometric SAR to measure terrain changes. The objectives of the proposed program are to evaluate and use information technology by performing SAR data processing in order to measure ground deformation, and to incorporate an understanding of Earth sciences by analyzing interferometric SAR processing results. We present a teaching guidance plan and the detailed results of the use of the proposed program in a junior high school in Japan.
2. TEACHING GUIDANCE PLAN
The reasons for students to learn about using interferometric SAR processing are as follows:
(1) Learners will gain an understanding of the facts obtained from analysis and observations of various images produced by interferometric SAR processing.
(2) Learners will develop a way of thinking that incorporates both scientific and technical viewpoints.
(3) Learners will obtain fundamental knowledge and skills related to information technology.
When drafting the teaching guidance plan for the developed education program, we considered both science and technology education. In the field of science, the teaching plan includes topics related to “the composition and changes of the Earth” and “nature and humans.” In the field of technology, it includes The International Archives of the Photogrammetry, Remote Sensing and Spatial Information Sciences, Volume XLI-B6, 2016
topics related to “the technology of information processing.” These topics were stipulated by the 2008 Japanese curriculum standards for junior high school (MEXT, 2008a and 2008b). We note that “language activities” such as writing, presentation, and discussion are also incorporated in our program.
There are a total of eight classes in the teaching guidance plan, and sets of two 50-minute classes were conducted in a row. The developed teaching guidance plan is shown in Table 1; the text in italic and roman font correspond to educational topics in science and technology, respectively.
In the first two classes, the objective is for learners to develop an interest in crustal movements and Earth observation
technology. SAR and interferometric technology are introduced. The learners browse web pages of the Meteorological Agency, SAR data providers, and other relevant organizations. They use a worksheet to summarize the information they collect. In the third and fourth classes, the interferometric SAR processing system, which consists of server and client computers, is introduced. The learners then process interferometric SAR data by using terminal software with an SSH protocol to connect to a server computer containing an interferometric SAR software package. They transfer the produced images from the server to the client computer and add some of them to their worksheets. In the fifth and sixth classes, they develop materials for a presentation that summarizes the steps used to process interferometric SAR data. They develop an understanding of the
Class Learning contents Learning activities
1
- Recognize the learning contents in this unit by deepening understanding about basic principles and results of Earth observation technology, interferometric SAR, and related topics.
- Investigate large earthquakes and volcanic activities that occurred in recent decades, and from a list of teaching materials, select a case for evaluating terrain changes.
- Develop an interest in and understanding of Earth observation technology.
- Learn about synthetic aperture radar (SAR). - Understand basic principles of interferometric SAR.
- Browse results of interferometric SAR and understand the technology.
2
- Investigate recent terrain changes caused by large earthquakes, volcanic activities, and other events.
- Summarize the investigation results in a worksheet.
- From the list of teaching materials, select a case for evaluating terrain changes.
- Investigate the selected terrain changes in detail.
- Write the details learned about the terrain changes in a worksheet. - Review and fill in a self-evaluation sheet on the learning contents.
3
- Confirm pairs of SAR data corresponding to the selected event.
- Summarize the relationships between SAR data and date of occurrence, scale, area, and other observable data for the selected event. - Write reasons for selecting the event.
- Confirm the date of occurrence of the selected terrain changes. - Know how to use the web page of the organization providing the SAR
data.
- Insert SAR images on a worksheet by following an example layout.
4
- Confirm the pairs of SAR data observed before and after the date of occurrence, and describe the terrain changes in a worksheet.
- Compare the two images observed before and after the occurrence of the earthquake or other event, and add the observations to the worksheet. - Notice that the differences between the two images cannot be seen
directly, and recognize that information processing is necessary. - Review and fill in a self-evaluation sheet on the learning contents. 5 - Operate the software according to the
procedure indicated in the teaching materials, and perform interferometric SAR processing.
- Prepare to summarize the terrain changes and results of interferometric SAR processing as presentation materials that refer to specific examples.
- Learn how to use the interferometric SAR processing system.
- Perform interferometric SAR processing for the selected terrain changes.
6
- Transfer each image produced in interferometric SAR processing to the learner's client PC.
- Prepare to summarize the steps of interferometric SAR processing in the presentation materials.
- Transform the images by using image processing software.
- Review and fill in a self-evaluation sheet on the learning contents of the 5th and 6th classes.
7
- Summarize terrain changes and the results of interferometric SAR processing as the presentation material.
- Consider the relationship between terrain changes and results of interferometric SAR processing.
- Discuss each other’s presentation materials, and deepen understanding about the terrain changes and the measurement technology.
- Evaluate the usefulness of Earth observation and information technology with reference to the image examples of interferometric SAR processing.
- Summarize the steps of interferometric SAR processing as the presentation materials.
- Recognize the relationship between the deformation phase and the terrain changes.
- Find the noise in the deformation phase.
8
- Consider the relationship between the deformation phase and the terrain changes.
- Discuss what learners notice by viewing each other’s presentation materials.
- Create a presentation and have a discussion based on the prepared materials.
- Presentation and discussion time per group is about 10 minutes. - Evaluate usefulness of Earth observation and information technology
with reference to the image examples of interferometric SAR processing. - Finally, summarize the learning contents in this unit.
- Review and fill in a self-evaluation sheet on the learning contents. Table 1. Teaching guidance plan for science and technology education program
relationship between the fringes in the deformation interferograms and the changes in terrain. In the last two classes, they develop a deeper understanding of the topics by performing various language activities, including making a presentation and participating in a discussion. Based on the outcomes of the interferometric SAR processing, they evaluate the usefulness of both the Earth observations and the information technologies.
3. TEACHING MATERIALS
The most important teaching materials are the actual events used for the analysis. Deformation interferograms indicating the topographic changes caused by the selected events must have as clear fringes as possible. Pairs of SAR data enabling the processing of interference SAR must exist, and they must be available. Furthermore, we suggest that it can assist in the recognition of the potential for disaster prevention if the selected events occurred near the area in which the learners live. Table 2 shows a list of teaching materials that we selected based on the above criteria. All the events selected were earthquakes that occurred in Japan. There are multiple pairs of master and slave Single Look Complex (SLC) data observed before and after the selected event and satisfying the interferometric conditions. Deformation interferograms obtained by interferometric SAR processing are clear enough for the learners to easily identify the fringes. Internet map services, digital globes, and archives of Earth observation data are employed to enhance interest in the learning contents.
To make this more accessible to teaching environments, free software was employed as the interferometric SAR processor; we chose the Delft object-oriented radar interferometric software package (DORIS), since it is a popular and free open deformation interferogram, the coherence map, and the related images by referring to the in-house beginner manual. The digital elevation model (DEM) data provided by the Shuttle Radar Topography Mission (SRTM) was used for simulating the topographic phase image (Farr et al., 2007; JPL, 2016). Since slant-range coordinates are used in the interferograms and their related images, the final deformation interferograms are projected onto Universal Transverse Mercator (UTM) coordinates. The learners can measure the ground deformation using the radar illumination direction. The images generated by each processing step are then inserted into their worksheets and presentation materials.
Additional functions for eliminating the residual phase, the compensating topographic phase, and the error phase caused by radar delay due to vapor are implemented into the original DORIS. Each instructor prepares a pair of cropped SLC data that are then converted from Committee on Earth Observation Satellites (CEOS) format to the DORIS format by using the original DORIS format converter. The converter changes various kinds of observation parameters; for example, if the intervals between state vectors are more than 15 seconds, the Hermite method is used to interpolate them at 15-second intervals so that a more-accurate flattened interferogram is produced. Some older SAR data may have orbit information with large errors, although the state vectors recent satellite-equipped SAR is generally accurate enough for this purpose. However, exact orbit information is not necessarily provided if the observation was performed in response to an emergency request. Errors in the orbit information are estimated by creating an unwrapped deformation interferogram with a large number of looks. A clearer deformation interferogram is then generated by flattening the compensated state vectors. These functions were added to the original DORIS by the authors. The observation time along the azimuth and the range directions are
No. Event Date Epicenter Scale
Table 2. List of events chosen as the teaching materials
compensated based on the offsets between the simulated and the actual SAR amplitude. These offsets are estimated by using the area correlation method.
The slave SLC image is co-registered to the master SLC image by using a 2D polynomial model; the parameters are estimated by the area correlation method with oversampling between the master and the slave amplitude images. The deformation interferogram is produced by employing the compensating values for the baseline and the topographic phase after setting the number of looks. Generic Mapping Tools (GMT) (Sandwell et al., 2011) and the additional program are combined to generate the geocoded images with a standard phase color. Since only five simple and sequential commands are used, the learners can easily perform the interferometric SAR processing. These commands execute the initialization, estimation of offsets, resampling of the slave, production of interferometry and other images, and geocoding.
4. PRACTICAL TEACHING EVALUATION 4.1 Experimental Class
An experimental class that followed the teaching guidance plan shown in Table 1 was presented to students in the second year at a junior high school in Tokushima, Japan, in November 2014. This class was included in a technology class titled “Problem-based learning” during a period designated for integrated studies. There were thirteen students assigned to seven groups (either a pair or a single individual). The students completed pre- and post-questionnaire surveys on the learning contents, and at the end of each even-numbered class, they evaluated their own learning results.
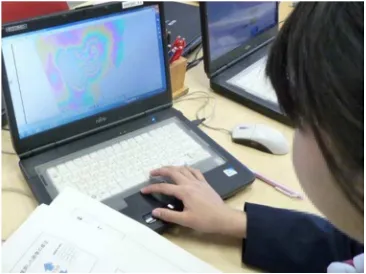
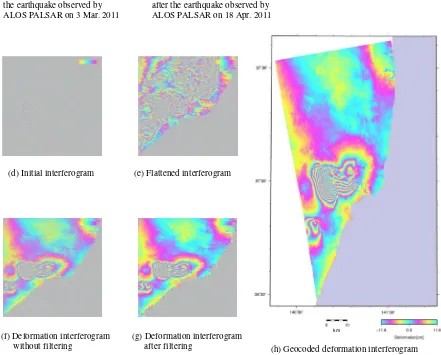
Figure 1 shows photographs of the learning activities of a student during the experimental class. Figure 1(a) shows a student confirming the patterns in a geocoded deformation interferogram displayed on the client PC, and Figure 1(b) shows the same student drawing fringes on the deformation interferogram by hand (these would then be counted and the color changes noted, and this information would then be used to determine the deformation value and its line-of-sight direction). The students first produced the master and the resampled slave amplitude images from before and after the event, respectively. They observed that the changes in the Earth's surface that were caused by the event could not be identified by comparing those amplitude images visually; see Figure 2 (a) and (b). After determining the coherence, an index that indicates the degree of interference, they then examined the generated coherence map, as shown in Figure 2 (c); the brightness is proportional to the degree of coherence. They noticed that areas where the surface frequently changed (such as the sea) were dark, and areas covered by artificial structures (such as buildings) were bright. Next, they made an initial interferogram, as shown in Figure 2 (d). They investigated this image in detail and confirmed that there were many thin fringes visible. They then produced a flattened interferogram by removing the phases caused by the relationship between the master and slave orbits, as shown in Figure 2 (e). They observed that the flattened interferogram was similar to a contour map. Next, they generated a deformation interferogram by eliminating the topographic phase, as shown in Figure 2 (f). They also generated a clear deformation interferogram by applying the phase filter to the original deformation interferogram; see Figure 2 (g). Finally, an image comparable to a topographical map was generated by geocoding
the filtered deformation interferogram and covering the monotone color of the sea area by using GMT.
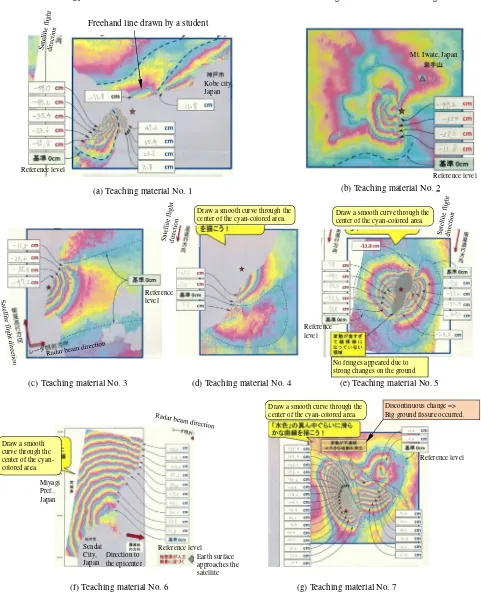
All groups successfully used the worksheet to analyze the deformation interferogram. Figure 3 shows the final learning outcomes written in the worksheets. The students drew many freehand lines around the center of the cyan-colored area, and they wrote in their worksheets the deformation values for the event, which were obtained by comparing the count to the reference level, as shown in Table 2. After counting the fringes in the deformation interferogram, they were able to visualize the terrain changes caused by the earthquakes. They noticed that the intensity of the topographic changes were related to the coarseness or fineness of the fringes in the deformation interferogram. The students were particularly interested in the fact that the damage caused by the earthquake was heaviest when there was a dense fringe in an urban area. Some of them understood that there was a special relationship between the fringe pattern and the location of the epicenter. Through studying the relation between the terrain changes and the deformation interferogram, the students gained an understanding of the usefulness of both Earth observations and interferometric SAR technologies. They were able to make presentations using the results written in their worksheets, and, while referring to the presentation materials, they were able to discuss with each other what they had learned. Finally, they interactively used computers and became skilled at recognizing the knowledge and techniques of information technology, and then they evaluated that technology.
(a) A student viewing a geocoded deformation interferogram that she generated by herself
(b) A student drawing fringes on a deformation interferogram and estimating the deformation and its direction by counting the number of fringes
Figure 1. Learning activities in the experimental class The International Archives of the Photogrammetry, Remote Sensing and Spatial Information Sciences, Volume XLI-B6, 2016
4.2 Evaluation of Learning Effects
There were many survey items in pre- and post-questionnaires, but here we consider those that are directly related to the learning objectives. Table 3 shows the mean, the standard deviation (SD), and the outcome of various statistical tests for these items. The items on the questionnaires asked the students to provide a self-evaluation using a four-point scale (1 to 4), where a larger number indicates a stronger affirmative answer. As shown in Table 3, following the lessons, except for Item 2, the means for the survey items were high, and except for Items 6 and 7, SDs were small. As a general tendency, most of the survey items that had low means in the pre-questionnaire had higher means in the post-questionnaire. In addition, we used Welch’s t-test to analyze the learning effects; the critical region
was set to 5%. There were statistically significant differences between the pre- and post-questionnaires for the means of Items 1, 3, 4, 8, and 9, which indicates that, for these items, there was a learning effect obtained from participating in the experimental class. On the other hand, there were no statistically significant differences between the pre- and post-questionnaires for the means of Items 2, 5, 6, and 7, which indicates that, for these items, there was no learning effect obtained. The mean for Item 3 was particularly high, indicating that the students valued the coordination between subjects. From these results, it seems that the students were able to gain scientific and technological knowledge that they were able to use to learn about topographic changes. On the other hand, we note that for the survey items related to student interest and knowledge about seismic intensity, the differences between the pre- and post-questionnaires was not statistically significant. The learning effects of the proposed
Figure 2. Learning results of interferometric SAR processing for analyzing terrain changes caused by event No. 7 in Table 2
(a) Master amplitude image before the earthquake observed by ALOS PALSAR on 3 Mar. 2011
(d) Initial interferogram
(f) Deformation interferogram without filtering
(b) Resampled slave amplitude image after the earthquake observed by ALOS PALSAR on18 Apr. 2011
(c) Coherence map
(g) Deformation interferogram after filtering
(e) Flattened interferogram
(C) Analysis by Naruto University of Education from PALSAR raw data of JAXA, METI (h) Geocoded deformation interferogram
km
education program using interferometric SAR were thus clarified by the results of statistical analysis.
5. CONCLUSIONS
In this paper, we present a practical teaching guidance plan for a science and technology class that uses interferometric SAR
processing and outcomes. The results of pre- and post-questionnaire surveys and self-evaluation by the learners show that the developed teaching guidance program was appropriate for junior high school education, and the students learned about the usefulness of Earth observation technology by using interferometric SAR. The usefulness of the improved DORIS and the selected teaching materials in the learning activities
Figure 3. Finished worksheets with freehand lines and deformation values written by a student; the red star indicates the epicenter, and the details of each of the teaching materials are listed in Table 2 Reference level
Mt. Iwate, Japan Freehand line drawn by a student
(b) Teaching material No. 2 (a) Teaching material No. 1
(c) Teaching material No. 3 (d) Teaching material No. 4 (e) Teaching material No. 5
(f) Teaching material No. 6 (g) Teaching material No. 7
Kobe city, Japan
Reference level
Reference level
Reference level
Reference level
Reference level
Direction to the epicenter Sendai
City, Japan Miyagi
Pref., Japan
No fringes appeared due to strong changes on the ground surface.
Draw a smooth curve through the center of the cyan-colored area.
Discontinuous change => Big ground fissure occurred.
Draw a smooth curve through the center of the cyan-colored area.
Draw a smooth curve through the center of the cyan-colored area.
Draw a smooth curve through the center of the cyan-colored area.
Earth surface approaches the satellite
were demonstrated by presenting an experimental class. The teaching guidance plan will be improved based on a time-series investigation of the learning effects from the self-evaluations in the even classes, and from a more detailed analysis of the worksheets and presentation materials produced by the students. Furthermore, we will add to the teaching materials for interferometric SAR processing. In particular, we will add more-varied data for large-scale crustal movements, and teaching materials for volcanic activity.
ACKNOWLEDGEMENTS
This research was partially supported by Japanese Grant-in-Aid for Scientific Research (C) 26381213. The authors are grateful to JAXA for providing the ALOS PALSAR data under the fourth ALOS research announcement program.
REFERENCES
Edited by the Remote Sensing Society of Japan (RSSJ), 2013. Remote Sensing: An Introductory Textbook, Maruzen Planet, Japan.
Farr, T. G., et al., 2007. The shuttle radar topography mission,
Reviews of Geophysics, 45, RG2004,
doi:10.1029/2005RG000183.
Hanssen, R. F., 2001. Radar Interferometry: Data Interpretation and Error Analysis, Kluwer Academic Publishers, Netherlands.
Ito, Y., Nii, H., and Takeichi, T., 2014. Interferometric SAR processing as a subject for science and technology education, 2014 IEEE International Geoscience and Remote Sensing Symposium Proceedings, pp.4520-4523, DOI: 10.1109/IGARSS.2014.6947497.
Jet Propulsion Laboratory (JPL), 2016. Shuttle Radar Topography Mission, http://www2.jpl.nasa.gov/srtm/index.html [Accessed 16 Mar. 2016].
Kampes, B. M., Hanssen, R. F., and Perski, Z., 2003. Radar interferometry with public domain tools, The 3rd International Workshop on ERS SAR Interferometry, p.6.
Ministry of Education, Culture, Sports, Science and Technology in Japan (MEXT), 2008a. The junior high school government guidelines for teaching, Science, http://www.mext.go.jp/ component/a_menu/education/micro_detail/__icsFiles/afieldfile /2011/04/11/1298356_5.pdf [Accessed 15 Mar. 2016].
Ministry of Education, Culture, Sports, Science and Technology in Japan (MEXT), 2008b. The junior high school government guidelines for teaching, Technology and home economics, http://www.mext.go.jp/component/a_menu/education/micro_det ail/__icsFiles/afieldfile/2011/04/11/1298356_9.pdf [Accessed 15 Mar. 2016].
Sandwell, D., Mellors, R., Tong, X., Wei, M., and Wessel, P., 2011. Open radar interferometry software for mapping surface deformation, Eos, Transactions American Geophysical Union, Vol.92, No.28, pp.234-235, DOI:10.1029/2011EO280002.
No. Survey item Pre-questionnaire Post-questionnaire Welch’s t-test
Mean SD Mean SD p-value t-value
1 Interest in the science learning contents of “The
Composition of and Changes in the Earth” 2.5 0.78 3.2 0.60 0.018* 2.55 2 Interest in the technology learning contents of
“Technology of information processing” 3.6 0.87 3.4 0.65 0.452 -0.77 3 Relationship between learning contents in
science and technology education 2.4 0.77 3.5 0.52 0.000* 4.49
4 Interest in measuring changes in terrain 2.6 0.87 3.2 0.60 0.048* 2.10
5
Interest in researching factors causing topographic changes based on results of investigating ground deformations caused by earthquakes or volcanic activity
3.1 0.86 3.3 0.75 0.474 0.73
6
Interest in disasters caused by topographic changes induced by earthquakes or volcanic activity
2.9 0.86 3.1 0.95 0.670 0.43
7 Interest in observing the surface of the Earth
using artificial satellites 3.1 0.49 3.2 0.60 0.629 0.49
8 Knowledge of the term “Remote sensing” 3.2 0.93 3.4 0.65 0.001* 3.94
9 Knowledge of the term “SAR” 1.3 0.85 3.2 0.60 0.000* 6.64
*Significant difference (Critical region: 5%) Table 3. Results of pre- and post- questionnaire surveys and statistical tests