ANALYSING AND QUANTIFYING VEGETATION RESPONSES TO RAINFALL WITH
HIGH RESOLUTION SPATIO-TEMPORAL TIME SERIES DATA FOR DIFFERENT
ECOSYSTEMS AND ECOTONES IN QUEENSLAND
M. Schmidta , T. Udelhovenb
a
Department of Science, Information Technology, Innovation and the Arts, Remote Sensing Centre, 4001 Brisbane, Australia – [email protected]
b
Remote Sensing and Geoinformatics, University of Trier, 54286 Trier, Germany - [email protected]
Commission VI, WG VI/4
KEY WORDS: Landsat, MODIS, NDVI, distributed lag models, time series
ABSTRACT:
Vegetation responses and ecosystem function are spatially variable and influenced by climate variability. The Spatial and Temporal Adaptive Reflectance Fusion Model (STARFM) was used to combine MODIS (Moderate Resolution Imaging Spectrometer) and Landsat TM/ETM+ (Thematic Mapper/ Enhanced Thematic Mapper plus) imagery for an 8 year dataset (2000-2007) at 30m spatial resolution with 8 day intervals. This dataset allows for a functional analysis of ecosystem responses, suitable for heterogeneous landscapes. Derived vegetation index information in form of the NDVI (Normalised Difference Vegetation Index) was used to investigate the relationship between vegetation responses and gridded rainfall data for regional ecosystems. A hierarchical decomposition of the time series has been carried out in which relationships among the time-series were individually assessed for deterministic time-series components (trend component and seasonality) as well as for the stochastic seasonal anomalies. While no common long-term trends in NDVI and rainfall data in the time period considered exist, there is however, a strong concurrence in the seasonally of NDVI and rainfall data. This component accounts for the majority of variability in the time-series. On the level of seasonal anomalies, these relationships are more subtle. The statistical analysis required, among others, the removal of temporal autocorrelation for an unbiased assessment of significance. Significant lagged correlations between rainfall and NDVI were found in complex Queensland savannah vegetation communities. For grasslands and open woodlands, significant relationships with lag times between 8 and 16 days were found. For denser, evergreen vegetation communities greater lag times of up to 2.5 months were found. The derived distributed lag models may be used for short-term NDVI and biomass predictions on the spatial resolution scale of Landsat (30m).
1. INTRODUCTION
The vegetative surface cover has an important function in the earth system (Steffen and Tyson 2001) which is linked via several feedback mechanisms to hydrological and climatological processes. Identifying and quantifying these linkages delivers important insight for environmental modelling, management and informed decision making.
Satellite earth observation data with high temporal repeat intervals such as AVHRR (Advanced Very High Resolution Radiometer) or MODIS (Moderate Resolution Imaging Spectroradiometer) deliver spatially dense information about the earth surface and are well-suited for monitoring continental scale surface processes.
Vegetation indices derived from earth observation systems have proved to be useful to describe surface vegetation behaviour (Tucker 1979). The most prominent of these is the Normalised Difference Vegetation Index (NDVI) which is proportional to the amount of photosynthetically active radiation absorbed by green vegetation (Asrar et al. 1984). Spectral information from the AVHRR sensor in channel 1 (0.58 to 0.68 micrometers) and
channel 2 (0.75 to 1.1 micrometers) are combined to formulate the NDVI as follows:
NDVI=(ch2-ch1)/ch1+ch2
The NDVI is widely used to monitor vegetation (Tucker 1979) and ecosystem processes (Pettorelli et al. 2005). For example, Lotsch et al. (2005) used AVHRR time series data (1981-1999) to monitor responses of terrestrial ecosystems to drought in the northern hemisphere. Nemani et al. (2003) have studied the climate-driven increase in global terrestrial net primary production using AVHRR data, building bioclimatic indices and vegetation growth limiting factors. Examples where NDVI and rainfall were related are widespread in the literature (e.g. Ecklundh, 1998, Anayamba & Tucker, 2005; Udelhoven et al., 2009; Schmidt et al., 2010a).
At regional or local scales are data with higher spatial resolution required. Landsat Thematic Mapper (TM) imagery have proven to be useful in many vegetation monitoring applications at regional scale (Xie et al, 2008, Danaher, 2010). A combination of MODIS and Landsat imagery via data fusion have successfully be used to establish a temporally dense (e.g.
8-day interval) time series of Landsat type imagery (Gao et al, 2006, Roy et al, 2008). On a regional level these data contribute to a better ecosystem understanding and an improved estimation of carbon fluxes for vegetation communities (Linderholm et al, 2006, Schmidt et al, 2012).
In this contribution we link a regular spaced (8-day interval) time series of MODIS-Landsat fused imagery via the STARFM algorithm (Gao et al, 2006) for a period of 7.5 years using 322 observations of NDVI imagery and rainfall surfaces. The data are first analysed classically with a lagged correlation and subsequently with a more complex distributed lag model including trend and noise removal. The objective of this contribution is a) to investigate if the synthetic high spatiotemporal NDVI time series and rainfall time series exhibit a significant correlation in a test region in an Australian Savanna and; b) investigate the influence of the seasonality of the correlation.
2. DATA AND METHODS
2.1 Data
Regional setting
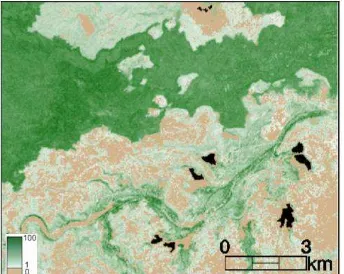
A 12 km x 10 km sample region in a typical Australian northern savanna region was chosen. The area includes homogeneous woody forests vegetation, grasslands and heterogeneous areas with a mixture of surface covers, such as a palustrine wetland and riparian vegetation. Regional ecosystem (RE) data of Queensland are generally mapped at 1:100,000 scale (http://www.derm.qld.gov.au/REDATA). The major forested communities in the test region are shown in Figure 1 and are mapped by RE data as a) low open-woodland to occasionally low open-forest of Eucalyptus shirleyi (silver-leaved ironbark), b) semi-evergreen vine thicket with many codominant species on young igneous rock, Woodland to open-woodland of
Eucalyptus platyphylla (poplar gum), Corymbia clarksoniana
(Clarkson's bloodwood), Corymbia tessellaris (Moreton Bay ash) and Eucalyptus tereticornis (bluegum). The northern part of the subset is part of the Great Basalt Wall national park and has undergone very little change in the recent history (e.g. no fire history).
Figure 1. Study area in a Landsat true color composite, superimposed is a subset of the regional ecosystem
classification.
Satellite imagery
Satellite imagery of the Landsat and MODIS sensors were utilised to create a 8-day regularly interval time series, see Schmidt et al (2012) for details.
Start date Stop date Num. of obs. Interval
MODIS 02/2000 09/2007 322 8-day
Landsat 12/1999 09/2007 90 irregular
STARFM 02/2000 09/2007 322 8-day
Rainfall 02/2000 09/2007 322 8-day
Table 1. Time span and resolution of the raster data used.
NDVI data were extracted from this time series of STARFM generated Landsat type imagery as a representation for vegetation greenness.
Rainfall data
Rainfall data were extracted form the SILO interpolated surfaces (Jeffery, et al., 2001) as 8-day rainfall totals.
Foliage Projective Cover
Foliage Projective Cover (FPC) data were extracted for the study region. FPC is defined as the horizontal percentage cover of photosynthetic foliage of all strata and provides a biophysically meaningful description of vegetation cover, particularly for Australian vegetation communities (Armston, et al. 2009).
Figure 2. FPC as a measure of overstorey foliage cover in the study area.
2.2 Methods
A lagged correlation analysis was performed on a per pixel basis of z-transfomed NDVI and rainfall data for the common time series from 02/2000-09/2007. This type of analysis is commonly applied, but leads in problems with significance assessment if two autocorrelated time-series are regressed are regressed against each other. In this case the ordinary least square (OLS) estimator results in a autocorrelated residual structure, which constitutes a severe violation of the assumption of OLS-regression, since the risk of a type I error in the significance assessment of (lagged) regression coefficients is increased.
Thus, in a second step of the analysis a distributed lag model has been applied, in which OLS-estimator was substituted by a generalized least square (GLS) parameter estimation. To this end were first long term trends and seasonal components were eliminated from both datasets and only seasonal anomalies were retained. Than a regression analysis in form of a distributed lag model (Udelhoven et al, 2009) is applied to the anomalies as follows using simple OLS-regression for parameter estimation:
where t is the time, a is the, bi are the regression coefficients at lag i.
In a second step an autoregressive moving average (ARMA) model is fitted to the error term to assess the temporal autocorrelation structure of the series. The next step is to filter the original time-series (NDVI and rainfall anomalies) using the identified ARMA-model. The last step is to repeat the OLS-regression of the anomalies. This results in a distributed lag model in which the residuals are “white noise” and to an unbiased assessment of the significance of the regression coefficients (Udelhoven et al., 2009).
A Durbin-Watson test was applied to detect the presence of a remaining autocorrelation in the time series.
3. RESULTS
A time series plot of rainfall and NDVI in a forested area (open woodland) displays the seasonality within the NDVI data.
Figure 3: Time series of rainfall (blue line) and NDVI (black line) for a location in an open woodland.
3.1 Simple lagged correlation
A smoothing filer with a window length of 5 was applied to both time series. The maximum correlation at the respective lag was reported on a per pixel basis (Figure 4).
Correlation Lag (orange=0, yellow=1,
red=2, white =4, black=neg.) Figure 4: Lagged correlation between rainfall and NDVI.
The response times lag times appear to have very little spatial pattern with generally quick vegetation response with a lag of 0. In the forested areas appear a lag of 1 and a lag of 2 along the riparian areas.
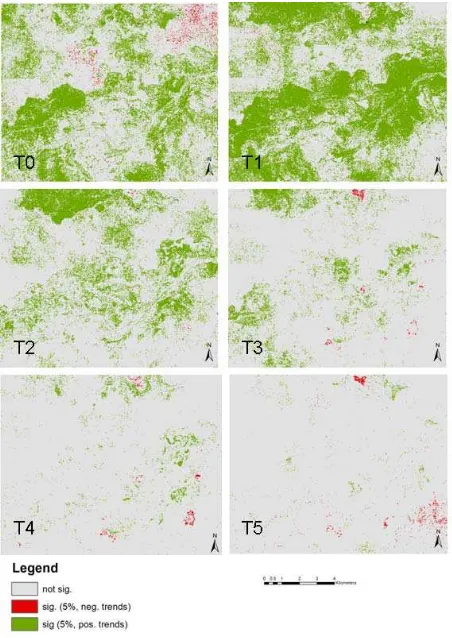
3.2 Distributed lag model
Raster layers of the 5% significance level demonstrate the difference in the response times in the different land types. In this 14 day aggregation it appears that no significant response of the NDVI exists after a lag period of 4 (56 days). In the grasslands or open woodlands with low tree cover appears a significant response at lag times of 0 to 3. The distinct pattern visible in Figure 3 between forest and grasslands are less pronounced, but visible in Figure 5 (T0 to T3).
Figure 5: NDVI vs Rainfall anomalies significance (t-test) at the 5% significance level of the regression coefficients at times T0 to T5.
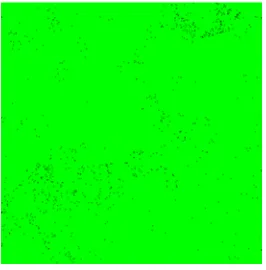
3.3 Test for autocorrelation
A simple test for temporal autocorrelation in the residual is the Durbin-Watson (DW) statistics. The outcome of this test is shown in Figure 6. A series without serial no autocorrelation results in a DW-value of 2.0. Smaller values (0 in the minimum) indicate positive autocorrelation whereas higher values (4.0 in the maximum) indicate negative autocorrelation. Figure 6 demonstrates that the residuals of the distributed lag model are indeed white noise using GLS-parameter estimation, except for singular, scattered pixels.
t t n tnt
a
b
RF
b
RF
b
RF
NDVI
1 2 1...
Figure 6: Durbin-Watson test – green means no significant autocorrelation (values between 1.8 and 2.2).
4. DISCUSSION AND CONCLUSIONS
4.1 Input data
The quality of the SILO interpolated surfaces is largely depending on the distribution and density of rainfall stations across the State. In remote areas, such as the study site, localised rainfall events might be missed or mis-represented. Hence the relationships described in this contribution could possibly improved with improved rainfall datasets.
The 8-day interval NDVI imagery are based on a data blending algorithm (STARFM) that merges coarse spatial scale imagery with higher resolution imagery. Despite that Schmidt et al. (2012) report good results with this method are potential biases and errors inherit in the dataset. NDVI it self is a vegetation index which has been used widely, but poses some problems so that other vegetation descriptions, such as outputs from s spectral mixture analysis (Schmidt & Scarth, 2009; Schmidt et al. 2010b) might give a more accurate representation of the vegetation behaviour.
4.2 Lagged correlation and distributed lag model
The results presented here show the general potential of utilising high temporal resolution imagery on a regional or local scale. However, is a study over a larger area desirable and potentially also the integration of other climatic variables such as temperature, water vapour content or potential evapotranspiration. The potential for non linear distributed lag models might be beneficial. The results presented here are work in progress and further analysis is required to draw solid conclusions.
References
Anayamb A., et al. 2001, NDVI anomaly patterns over Africa during the 1997/98 ENSO warm event. International Journal of Remote Sensing, 22, pp. 1847–1859.
Armston J. D. et al., 2009. “Prediction and validation of foliage projective cover from Landsat-5 TM and Landsat-7 ETMþ Imagery,” J. Appl. Remote Sens. 3, 033540, http://dx.doi.org/10.1117/1.3216031.
Danaher T. et al., 2010. “Remote Sensing of Tree-GrassSystems - theEasternAustralianWoodlands,” in Ecosystem Function in Savannas: Measurement and Modeling at Landscape to Global Scales, M.
J.Hill and N. P. Hanan, Eds., pp. 175–193, Taylor & Francis.
Eklundh L., 1998, Estimating relations between AVHRR NDVI and rainfall in East Africa at 10-day and monthly time scales. International Journal of Remote Sensing, 19, pp. 563–568.
Gao F. et al., 2006. “On the blending of the Landsat and MODIS surface reflectance: Predicting daily Landsat surface reflectance,” IEEE Trans. Geosci. Remote Sens. 44, 2207–2218, http://dx.doi.org/10.1109/TGRS.2006.873336.
Jeffrey S.J. et al., 2001. “Using spatial interpolation to construct a comprehensive archive of Australian climate data,” Environ. Model. Softw. 16, 309–330, http://dx.doi.org/10.1016/S1364-8152(01)00008-1 .
Linderholm, H.W. 2006. "Growing season changes in the last century," Agric. For. Meterol. 137, 1-14.
Nemani R.R. et al., 2003, Climate-driven increases in global terrestrial net primary production from 1982 to 1999. Science, 300, 1560-1563.
Pettorelli N., et al. 2005, Using the satellite-derived NDVI to assess ecological responses to environmental change. Trends in Ecology & Evolution, 20, 503-510.
Steffen W., and Tyson P., 2001, Global Change and the Earth System: A planet under Pressure.
Schmidt M., et al., 2010a. Use of lagged time series correlations to relate climate drivers and vegetation response, in Proceedings of the 15th Australasian Remote Sensing and Photogrammetry Conference, Alice Springs, Australia, 13-17 September 2010. (Eds.: Sparrow, B., and Bhalia, G.)
Schmidt M., el al 2010b. Fractional ground cover monitoring in Queensland for improved pastures and agricultural areas, in Proceedings of the 15th Australian Remote Sensing and Photogrammetry Conference, Alice Springs, Australia, 13-17 September 2010. (Eds.: Sparrow, B., and Bhalia, G.)
Schmidt M. and Scarth, P. (2009): Spectral mixture analysis for ground-cover mapping. In: Innovations in Remote Sensing and Photogrammetry. Jones, S., Reinke, K. (Eds.) Series: Lecture Notes in Geoinformation and Cartography. Series Editors: W. Cartwright, G. Gartner, L. Meng, M.P. Peterson, Springer Heidelberg, Dortrecht, London, New York, pp 349-359. DOI: 10.1007/978-3-540-93962-7
Schmidt M. et al., 2012 (in press): Long term data fusion for a dense time series with MODIS and LANDSAT imagery in an Australian Savanah. Journal of Applied Remote Sensing, Vol 6, xxxx; doi:xxxxx.
Tucker, C. J., 1979, Red and photographic infrared linear combinations for monitoring vegetation. Remote Sensing of Environment, 8, 127-150.
Udelhoven T. et al., 2009. Modelling the NDVI–rainfall relationship in Spain (1989–1999) using distributed lag models,” Int. J. Remote Sens., vol. 30.
Xie, Y et al., 2008, "Remote sensing imagery in vegetation mapping: a review," Journal of Plant Ecology 1, 9-23.