HYPERSPECTRAL REMOTE SENSING WITH THE UAS “STUTTGARTER ADLER”
-CHALLENGES, EXPERIENCES AND FIRST RESULTS
A. Buettnera,∗, H. P. Roesera a
Institute of Space Systems, University of Stuttgart, 70569 Stuttgart, Germany -(buettner, roeser) @irs.uni-stuttgart.de
KEY WORDS: Hyperspectral, Remote Sensing, Unmanned Aerial System, Precision Agriculture, Direct Georeferencing, Calibration
ABSTRACT:
The UAS “Stuttgarter Adler” was designed as a flexible and cost-effective remote-sensing platform for acquisition of high quality environmental data. Different missions for precision agriculture applications and BRDF-research have been successfully performed with a multispectral camera system and a spectrometer as main payloads. Currently, an imaging spectrometer is integrated in the UAS as a new payload, which enables the recording of hyperspectral data in more than 200 spectral bands in the visible and near infrared spectrum. The recording principle of the hyperspectral instrument is based on a line scanner. Each line is stored as a matrix image with spectral information in one axis and spatial information in the other axis of the image. Besides a detailed specification of the system concept and instrument design, the calibration procedure of the hyperspectral sensor system is discussed and results of the laboratory calibration are presented. The complete processing chain of measurement data is described and first results of measurement-flights over agricultural test sites are presented.
1 INTRODUCTION
Hyperspectral remote sensing data is of great interest in many different research topics and applications. It combines traditional 2D imaging remote sensing technology with classical spectroscopy and allows the acquisition of data with both, geometric and spec-tral high resolution. The large number of specspec-tral bands pro-vides the ability to derive biophysical and biochemical param-eters from the quasi continuous visible and near infra-red spec-trum (Haboudane et al., 2008), while the geometric resolution can be used for the creation of rectified image stripes. In the last decades, hyperspectral remote sensing was mainly performed with airborne sensors such as AVIRIS or HyMap, which are flown on manned aircraft (Green et al., 1998, Cocks et al., 1998). The development of compact and lightweight imaging spectrometers in the last few years offers the possibility to integrate such in-struments in small unmanned aerial systems (UAS) and closes the gap between time-consuming and spatially limited point mea-surements on the ground and complex and expensive flight cam-paigns with manned aircraft. The UAS “Stuttgarter Adler” is operated as a remote sensing platform at the Institute of Space Systems and can be equipped with different sensor systems like multispectral and thermal cameras (Kirchgaessner, 2012). The integration of an imaging spectrometer as hyperspectral payload extends the range of applications, but also comes along with lots of new challenges.
2 SYSTEM OVERVIEW
2.1 UAS “Stuttgarter Adler”
The UAS Stuttgarter Adler is a remote sensing platform, which was specially designed for acquiring high quality remote sens-ing data with great flexibility at comparatively low costs (Putze, 2012). The twin-engine configuration with two 2.0 kW electri-cal engines allows a take-off weight of 25 kg including a payload capacity of 4-5 kg, the wingspan adds up to 4.33 m. The aero-dynamic design accounts for stable flight at 12 - 15 m/s airspeed. Radio link and all control surfaces are constructed in redundant way so that no single point failure leads to loss of the aircraft. The integration of the motors in two nacelles provides enough
space for the integration of the payload in the fuselage. Take off and landing require a paved or grass runway of 150 m length and are performed manually with remote control, the measurement flight itself is controlled completely autonomous by an autopi-lot system based on the open source project “paparazzi” (Brisset, 2006). The LiPo batteries allow a total flight-time of up to 30 minutes, technical data of the UAV can be found in Fig.1.
Figure 1: UAS “Stuttgarter Adler” before take-off
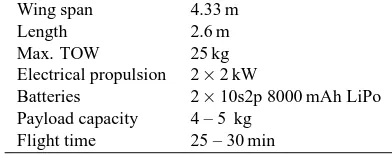
Wing span 4.33 m
Length 2.6 m
Max. TOW 25 kg
Electrical propulsion 2×2 kW
Batteries 2×10s2p 8000 mAh LiPo Payload capacity 4 – 5 kg
Flight time 25 – 30 min
Table 1: Technical data of the UAV
2.2 Hyperspectral Sensor System
on the entrance-slit of the spectrograph by a special fore-lens (OLE9 FORE LENS); a monochrome CCD-camera (PROSIL-ICA GE1900) is mounted on the back of the spectrograph to de-tect the radiance; the spectrograph itself (SPECIM IMSPECTOR V10E) disperses the light and focuses it on the CCD detector sur-face with a spectral resolution of 2.8 nm. The specification of the instrument is shown in Tab. 2.
Figure 2: Schematic of the imaging spectrograph
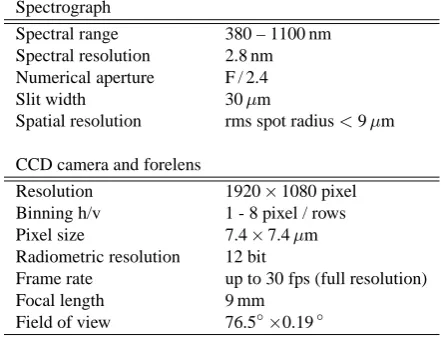
Spectrograph
Spectral range 380 – 1100 nm Spectral resolution 2.8 nm Numerical aperture F / 2.4
Slit width 30µm
Spatial resolution rms spot radius<9µm
CCD camera and forelens
Resolution 1920×1080 pixel
Binning h/v 1 - 8 pixel / rows
Pixel size 7.4×7.4µm
Radiometric resolution 12 bit
Frame rate up to 30 fps (full resolution)
Focal length 9 mm
Field of view 76.5◦×0.19◦
Table 2: Specification of the hyperspectral imager
The hyperspectral imager is working as a push broom line scan-ner, with the entrance slit oriented perpendicular to the flight di-rection. The constant movement of the UAV is used to scan an area in continuous stripes. Each single line is stored as a ma-trix image, which contains spectral information in one dimen-sion and spatial information in the other dimendimen-sion of the image sensor. The geometric rectification of the image stripes is a big challenge in operating a line scanner in an UAV. The small plat-form is susceptible to gusts of wind and much more unstable in comparison to large manned aircraft. For correct alignment and rectification of the recorded lines, the position and attitude of the sensor must be known with high precision. Therefore, additional sensors for position and attitude determination are mounted on the spectrograph. The position and attitude sensor system com-prises three-axis MEMS accelerometer, gyroscope and magne-tometer, a L1-GPS receiver providing raw measurement data and a barometer and thermometer as additional sensors for improving the height determination. The gyroscope used is an ITG-3200 triple-axes gyroscope from Invensense providing three integrated 16-bit ADCs for simultaneous sampling of the gyros. The celerometer is an Analog Devices ADXL345 digital triaxial ac-celeration sensor with measurement range up to 16 g, which was designed for low power consumer market. The 13-bit resoultion enables measurement of inclination changes smaller than 0.5◦. The Honeywell HMC5883L triple-axes sensor is used as digital compass in the hardware setup. The 12-bit ADC enables mea-surements with milligauss resolution, which lead to a heading ac-curacy of 1 - 2◦. An external professional grade GNSS-antenna from Tallysman is used for acquiring strong GPS signal and
im-proved multipath rejection. The inertial data is recorded with 100 Hz, while the GPS receiver provides raw data with 20 Hz up-date rate. A small microprocessor board is used for synchronous sensor readout via fast-mode i2c digital interface, a precise GPS pulse-per-second time-signal serves as common time basis. Since no real-time capability is required, a specially designed Extended Kalman Filter with smoothing techniques is used for sensor fu-sion of IMU and GPS data in the post-processing (Koerner, 2012). The information flow of the filter is shown in Fig. 3. The whole
Figure 3: Information flow of the extended Kalman filter
sensor system is fixed horizontally on a common mounting plate. An optical mirror reflects the incoming light to the forelens. EPP-foam is used for vibration isolation from the aircraft. The IMU is mounted directly on top of the spectrometer to keep the posi-tion and orientaposi-tion offset as constant and small as possible. The GPS-antenna is mounted on top of the aircraft right above the instrument for best reception of the GPS satellite signals. A com-pact PC with Linux operating system, Gigabit-Ethernet interface and solid-state disk for data storage is used as on-board payload computer. Custom software for configuration of the camera and recording of the image data was developed, which enables flexi-ble adjustments of different sensor parameters such as frame rate, binning, and exposure time for particular missions.
3 CALIBRATION AND CHARACTERIZATION
Radiometric and spectral calibration is performed in house in an optical laboratory. Different calibration equipment such as an integrating sphere, line emission lamps and a monochroma-tor are available for regular calibration in the laboramonochroma-tory between measurement campaigns. The whole system including mounting plate and mirror is calibrated together to account for possible dis-tortions of the additional components.
3.1 Radiometric Calibration
The main task of radiometric calibration is the determination of the coefficients for the conversion of raw data (DN) into physical units (spectral radiance, mW / m2
luminosity up to saturation level at different integration times. Dark signal is quantified in the laboratory for different temper-atures and integration times to characterize the dark signal non uniformity (DSNU). Noise equivalent spectral radiance (NESR) is determined by measuring the standard deviation of the dark sig-nal and can be used for sigsig-nal-to-noise-ratio (SNR) asig-nalysis. The radiometric calibration coefficient for the nadir pixel is shown in Fig. 4, the according NESR for an integration time of 1 ms is shown in Fig. 5. The spectral region above 1000 nm is strongly influenced by system noise due to the low quantum efficiency of the CCD-Sensor in this region and therefore discarded in further data analysis.
400 500 600 700 800 900 1000
0
Figure 4: Radiometric calibration coefficient
400 500 600 700 800 900 1000
0
Figure 5: Noise equivalent spectral radiance for 1 ms integration time
3.2 Spectral Calibration
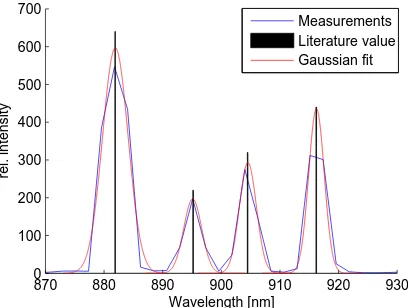
Spectral calibration is needed to successfully determine reflectance spectra or physical parameters of measurement targets. It de-scribes the response of the sensor to discrete light and is used to determine the centre wavelengths and spectral resolution for each spectral channel. The response function of each channel can be approximated with a Gaussian shaped curve, the spectral resolution is defined as the full width half maximum (FWHM) of the function. The peak response of the spectrometer to an infinitesimally narrow emission line describes the centre wave-length of each channel. Special line emission lamps with differ-ent gas fills are used to produce narrow, intense lines from the ex-citation of the gases. Measurements with HgAr– , Xe– and Ne– gas lamps provide emission lines, which cover the whole spectral range. The line width of the emission lines is much smaller than
the spectral resolution of the spectrograph and thus well suited for wavelength calibration (Chen, 1997). Figure 6 shows the re-sponse of the nadir channels to the Xenon lines, in Fig. 7 the 4 th order polynomial-fit for the wavelength calibration of the spectral channels is shown. The nominal spectral resolution of the spec-trograph is stated as 2.8 nm by the manufacturer. Results of mea-surements with line emission lamps and monochromator showed a FWHM between 3.2 nm an 4.7 nm, depending on the spectral channel. The 1080 spectral pixels of the CCD-Sensor are binned with the factor of 3 which leads to 331 spectral channels in the 380 - 1100 nm region with a spectral sampling interval of approx-imately 2.2 nm. Thus, the binning reduces the data volume and increases the SNR without loosing spectral information.
870 880 890 900 910 920 930
0
Figure 6: Measurement of Xenon lines
0 50 100 150 200 250 300 350
Figure 7: Wavelength calibration with line emission lamps
4 RESULTS AND DISCUSSION
4.1 Data processing
interpolation for the whole flight to derive reflectance values. Finally, geometric rectification and georeferencing have to be performed. Position and attitude of the aircraft is calculated in post-processing with 100 Hz. The beginning and end of each im-age stripe is triggered by the autopilot and marked with a GPS timestamp. A camera-timestamp is stored in every single line-image and used for connecting the line-images with the position and attitude of the UAS at each exposure. Based on the collinear equations, custom software was developed for direct georefer-encing of the image stripes in UTM coordinates on flat terrain or digital elevation model. The correction of boresight angles is im-plemented with a differential rotation matrix. Final data is stored in ENVI-compatible format and can be further processed with classical remote sensing software packets.
4.2 First flight tests and measurement flights
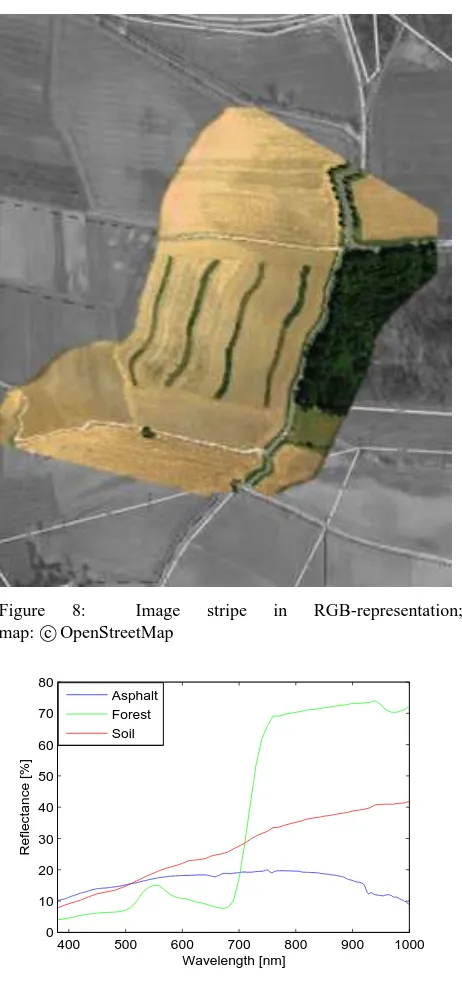
In early 2012, first flight tests were performed to prove the sys-tem under operational conditions. Parameters like frame rate, ex-posure time and flight speed were adapted to avoid gaps in im-age stripes. IMU and GPS measurements of the test flights were used for tuning of the Kalman-filter. In summer 2012, first mea-surement flights over agricultural test fields were performed. The flight altitude was 300 m above ground. A framerate of 20 fps and an average speed of 15 m/s lead to a ground sampling dis-tance of 0.5×1 m. The data was spatially resampled with nearest neighbour method to match a 1×1 m UTM grid. Figure 8 shows an openstreetmap aerial photo which is overlayed with a part of an hyperspectral image-stripe in RGB-representation. The hy-perspectral image section covers different areas like forest, bare soil or asphalt. Three pre-processed reflectance spectra, which were directly extracted from single pixels of the image in Fig. 8, are shown in Fig. 9. The vegetation reflectance spectrum dif-fers clearly from the other reflectance spectra and shows the typ-ical maximum in the green wavelength along with the significant red edge transition zone between visible and near infrared wave-length. These features provide the basis for further investigations like estimation of chlorophyll content, leaf area index or other biophysical parameters (Liu et al., 2004). Also, heterogeneities within one agricultural field are visible and can be utilized for estimating yields or variable-rate application of nitrogen.
5 CONCLUSION AND FUTURE WORK
The hyperspectral sensor system was chosen as a new payload to enable the recording of high spectral resolution imagery in the visible and near infrared spectrum, with high temporal flexibil-ity at low operational costs. The system could be successfully integrated in the remote sensing platform “Stuttgarter Adler” and showed the ability to generate detailed remote sensing data, which is useful for various applications in the field of precision farming. Based on calibration methods in the laboratory and reference field measurements, a complete processing chain was developed to generate a radiometric and spectral calibrated image. Photogram-metric methods were applied for direct georeferencing of the im-age stripes. First results show, that there are still geometric distor-tions which are not corrected properly. S-shaped errors, which are visible on straight lines like the street in Fig. 8, may result from limited accuracy of the MEMS-sensors. Further adaptions of the Kalman-Filter shall be investigated to minimize these errors. For absolute accuracy assessment, measurements with ground con-trol points and an additional matrix-camera, which is triggered parallel to the line scanner with the same frequency, shall be per-formed this summer.
In cooperation with the Institute of Crop Science of the Univer-sity of Hohenheim, hyperspectral remote sensing data shall be
Figure 8: Image stripe in RGB-representation; map: cOpenStreetMap
400 500 600 700 800 900 1000
0
Figure 9: Reflectance spectra for asphalt, forest and soil
used for the determination of spectral characteristics of winter wheat and compared with ground based measurements during the vegetation period 2013.
REFERENCES
Brisset, P., 2006. The Paparazzi solution. In: Micro Air Vehicle Conference 2006. See also
URL www.recherche.enac.fr/paparazzi/
papers_2006/mav06_paparazzi.pdf.
Chen, H., 1997. Remote sensing calibration systems: an intro-duction. Studies on geophysical optics and remote sensing, A. Deepak.
Green, R. O., Eastwood, M. L., Sarture, C. M., Chrien, T. G., Aronsson, M., Chippendale, B. J., Faust, J. A., Pavri, B. E., Chovit, C. J., Solis, M., Olah, M. R. and Williams, O., 1998. Imaging spectroscopy and the airborne visible/infrared imaging spectrometer (aviris). Remote Sensing of Environment 65(3), pp. 227 – 248.
Haboudane, D., Tremblay, N., Miller, J. and Vigneault, P., 2008. Remote estimation of crop chlorophyll content using spectral in-dices derived from hyperspectral data. Geoscience and Remote Sensing, IEEE Transactions on 46(2), pp. 423–437.
Kirchgaessner, U., 2012. Einsatz eines ferngesteuerten Klein-flugzeugs zur Erfassung von Umweltdaten. Dissertation, Univer-sity of Stuttgart.
Koerner, F., 2012. Design of a Kalman Filter for Tightly Coupled GPS/INS Integration. Diploma-thesis, University of Stuttgart.
Liu, J., Miller, J., Haboudane, D. and Pattey, E., 2004. Exploring the relationship between red edge parameters and crop variables for precision agriculture. In: Geoscience and Remote Sensing Symposium, 2004. IGARSS ’04. Proceedings. 2004 IEEE Inter-national, Vol. 2, pp. 1276–1279.
Putze, U., 2012. Auslegung und Instrumentierung eines fernges-teuerten Kleinflugzeuges fuer die Erdbeobachtung. Dissertation, University of Stuttgart.