AUTOMATIC ORIENTATION OF LARGE BLOCKS OF OBLIQUE IMAGES
E. Rupnika,∗, F. Nexb, F. Remondinob
a
GEO Department, Vienna University of Technology - [email protected] b3D Optical Metrology (3DOM) Unit, Bruno Kessler Foundation (FBK), Trento, Italy
(franex,remondino)@fbk.eu, http://3dom.fbk.eu
Commission WG III/4
KEY WORDS:Urban, Orientation, Automation, Bundle, Block, Multi-sensor, High resolution
ABSTRACT:
Nowadays, multi-camera platforms combining nadir and oblique cameras are experiencing a revival. Due to their advantages such as ease of interpretation, completeness through mitigation of occluding areas, as well as system accessibility, they have found their place in numerous civil applications. However, automatic post-processing of such imagery still remains a topic of research. Configuration of cameras poses a challenge on the traditional photogrammetric pipeline used in commercial software and manual measurements are inevitable. For large image blocks it is certainly an impediment. Within theoretical part of the work we review three common least square adjustment methods and recap on possible ways for a multi-camera system orientation. In the practical part we present an approach that successfully oriented a block of 550 images acquired with an imaging system composed of 5 cameras (Canon Eos 1D Mark III) with different focal lengths. Oblique cameras are rotated in the four looking directions (forward, backward, left and right) by 45◦with respect to the nadir camera. The workflow relies only upon open-source software: a developed tool to analyse image connectivity and Apero to orient the image block. The benefits of the connectivity tool are twofold: in terms of computational time and success of Bundle Block Adjustment. It exploits the georeferenced information provided by the Applanix system in constraining feature point extraction to relevant images only, and guides the concatenation of images during the relative orientation. Ultimately an absolute transformation is performed resulting in mean re-projection residuals equal to 0.6pix.
1 INTRODUCTION
The use of oblique images was first adopted in the 1920s for surveillance and reconnaissance purposes and during the last cen-tury it was mainly used for military applications. Only in the last decade oblique imagery has become a standard technology for civil applications, thanks to the development of airborne dig-ital cameras and in particular the development of multi-camera systems, as proposed by many companies (Leica RCD30, Pic-tometry, Midas, BlomOblique, IGI, UltraCam Osprey, etc.). The virtue of oblique photography lies in its simplicity of interpre-tation and understanding for inexperienced users. These qual-ities allowed the use of oblique images in very different appli-cations, such as monitoring services during mass events and en-vironmental accidents, (Petrie, 2008, Grenzd¨orfer et al., 2008, Kurz et al., 2007), building detection and reconstruction (Xiao et al., 2012), building structural damage classification (Nyaruhuma et al., 2012), road land updating (Mishra et al., 2008) and ad-ministration services (Lemmens et al., 2008). What is more, oblique imagery can provide a great improvement in city mod-elling (Wang et al., 2008) and in some cases it can serve as a good alternative to mobile mapping surveys or airborne LiDAR acquisitions. The reason is the density and the accuracy of point clouds that can be generated with matching techniques (Fritsch et al., 2012, Gerke, 2009, Besnerais et al., 2008). What is more, a filtered point cloud can be used to produce reliable meshes for visualization purposes (i.e. AppleC3).
So far, most prominent cities in the world have been covered with georeferenced oblique images and these flights are usually re-peated every few years to be always up-to-date (Karbo and Sim-mons, 2007). Abundance and practical utility of this data is ap-parent, however, automated processing is still a challenge. This is primarily because complex image configurations are imposed by the acquisitions and because of shortcomings of on-board direct orientation sensors that do not satisfy the strict requirements of
metric applications (point cloud generation, manual plotting). Although aerotriangulation has a long tradition, most of com-mercial solutions were designed only for nadir images (Jacobsen, 2008), hence cannot cope with different camera viewing angles and varying scale within images. Several papers dealing with the oblique images’ orientation have been already presented (Wiede-mann and More, 2012, Gerke and Nyaruhuma, 2009) proposing the use of additional constraints within bundle adjustment (rel-ative position between images, verticality of lines in the scene, etc.), or simply aligning the (not adjusted) oblique cameras to the (adjusted) nadir ones with the use of GNSS/IMU information. Merely a single contribution has succeeded to automatically ori-ent a large block of oblique images with a commercial software (Fritsch et al., 2012).
In this paper, a fully automatic methodology for simultaneous orientation of large datasets of oblique and nadir images is de-scribed. The presented workflow relies only upon open-source software: a developed tool to analyse image connectivity and Apero (Pierrot-Deseilligny and Clery, 2011) to orient the im-age block. The connectivity tool was developed to exploit the georeferenced information provided by the Applanix system in constraining feature point extraction to relevant images only, and guideing the concatenation of images during the relative orienta-tion.
2 THEORETICAL BACKGROUND
2.1 Least squares adjustment
Many measured quantities involved in Geomatics problems are random variables which normally assume different values accord-ing to the different (and repeated) measurements performed to obtain them. Therefore a set of measurements (or observations)l
can be expressed asl=l+vwithlthe adjusted measures andv
the residuals (or corrections) to the measures.
Behind each problem there is a mathematical model, composed of two parts: a functional model (it describes the geometric char-acteristics of the problem) and a stochastic model (it deals with the statistical properties of all the element involved in the func-tional model).
To increase the accuracy and provide an error check, the number of measured quantities (observations l) in the functional model is normally larger than the number of the unknowns - redundant measurements. Consequently we have an over-determined sys-tem and a solution of the problem is derived with a least squares adjustment. The least squares method minimizes an objective function (1), being the sum of the squares of the residuals (2) of the available observations.
c(x) =r(x)T
r(x) (1)
r(x) =y−f(x) (2)
There are different techniques by which least squares can be solv-ed. Firstly the model behind the problem must be identified with its number of observations, underlying parameters (unknowns) and the relationship between them. If the model is linear, the ob-jective function is quadratic and independent of unknowns there-fore it is convex. The solution is then obtained with direct meth-ods (Gauss elimination, Cholesky, QR, SVD, conjugate gradient) from the function’s gradient.
In case of non-linear least squares problems (e.g. collinearity model), it is practical to obtain linear equations. Linearization implies that approximate values for all parameters are known and the most optimal values are computed in an iterative framework such that with each iteration the estimates are updated and hope-fully closer to the real solution. However, the objective function is no more independent of the model parameters so there is no cer-tainty that it is convex. The existing algorithms for finding a min-imum of such functions differ in how the structure and derivatives of the this function are exploited (Nocedal and Wright, 2006). Es-sentially the difference is in how the unknowns are corrected from one iteration to the next. Within the photogrammetric commu-nity the most common approach is the iterative Netwon’s Method (i.e. Gauss-Markov method, not reviewed hereafter), whereas in other fields e.g. computer vision, Gauss-Newton or its ’cousin’ Levenberg-Marquadt are in use.
Popularity of the Newton-like methods lies in the fast conver-gence near the minimum. The disadvantage is that the worse the initial approximations, the more costful the iteration and the less guarantee that a global minimum is reached (Triggs et al., 2000). To combat this ambiguity, the standard Newton method is accom-panied by a step control policy that verifies whether convergence progresses along the descent direction. This combination of New-ton and search direction is the foundation for the Gauss-NewNew-ton method. It sometimes is referred to as approximated because it approximates the Hessian of the cost function.
f(x+dx) =f(x0) +Jdx (3) Let’s denote the relationship between observationsyand parame-ters asf(x). Setting (3) in (2) results in (4). Next, when inserted in (1) and equating its derivative to zero it will give (5) (Engels et al., 2006). Provided that the Jacobian is of full rank, the solution to (5) gives us the search direction. It becomes also clear from (5) that the left hand-side of the equation represents normal equa-tions i.e. the search direction is the solution of linear least squares and can be solved with direct algorithms. Once the direction is retrieved, an updatedx(a.k.a. Gauss-Newton step) is calculated with (6), where the scalarαis called the step length and is chosen according to specified conditions (Nocedal and Wright, 2006). The Levenberg-Marquadt method is a further modification of the Newton method. Here, the step generation is carried out by a trust-region method rather than line-search as in Gauss-Newton. The algorithm builds a spherical region around current parameter estimates and looks simultaneously for the direction and length of the step. On the contrary, line-search methods look independently for the direction andαcorresponding to the length (Nocedal and Wright, 2006). In practice, the normal equations in (5) are in-teractively augmented by a damping factor (7). Owing to that, the algorithm operates as the Gauss-Newton forλ→0, steepest descent direction forλ→ ∞, and something in-between for the remainingλvalues. The damping is raised if the cost (1) is not reduced, otherwise it is decreased. Through manipulation of the damping, rank-deficient Jacobians can also be handled (Lourakis and Argyros, 2005).
(JTJ+λI)dxLM=eJ λ >0
I−identity (7)
2.2 Multi-camera Bundle Block Adjustment
The Bundle Block Adjustment (BBA) in a multi-camera system must handle n different cameras with different interior (IO) and exterior orientations (EO). From a theoretical point of view, cam-era orientations can be retrieved in the following ways:
Orientation without constraints Each camera image is oriented using independent EO for each acquisition and common IO for a given camera. The design matrix is then a combination of classi-cal collinearity equations (in fact their derivatives):
Orientation with additional constraints The knowledge about reciprocal positions between images is integrated into the Bundle Block Adjustment. In particular, equations about the relative ro-tations and bases between cameras are added to the mathematical model. By doing so, not only we may lower the number of un-knowns in our system but also stabilize the whole image block. There is more than one way to include this information within the Bundle Block. A straightforward way is to express the collinear-ity equations for oblique cameras as a function of the nadir cam-era extended with respective displacements and rotations between image coordinate systems:
whereMis the rotation matrix from oblique to nadir image coor-dinate system,∆xn,∆yn,∆znare the displacements of camera projection centers,Zx, ZyandNas defined in equation (8). This approach is already familiar from multi-linear sensor ori-entation both on satellite and airborne platforms (Ebner et al., 1992). Such systems are calibrated prior to the acquisition and the BBA comes down to adjusting only the nadir looking lines, while treating the off-nadir ones as constants. An alternative is to introduce the constraints as observed unknowns and control their influence on the BBA (as well as their ultimately adjusted values) with appropriate stochastic properties.
Other methods (Gerke and Nyaruhuma, 2009) use additional con-straints such as scene concon-straints to improve the Bundle Block Adjustment.
Direct orientation of oblique images Nadiral images are orient-ed in the traditional Bundle Block Adjustment while orientation of oblique images is inferred from their known calibration. Com-pared to the previous methods, this approach is less accurate and the multi-sensor capabilities are not fully utilized. Even though calibration parameters are available, their stability over time is questionable. On the other hand, it delivers results using tra-ditional software therefore may be appreciated in applications with less stringent accuracy requirements (Wiedemann and More, 2012).
3 ORIENTATION
There are two orientation strategies available in Apero. Only rel-ative orientation is performed and the coordinate system is fixed arbitrarily, or the images are oriented relatively and then trans-formed to an absolute reference frame if external data exists i.e. ground control points (GCP), projection centers’ position, other knowledge about the scene (Pierrot-Deseilligny, 2012). In ei-ther case the Bundle Adjustment requires decent approximations for all unknowns. Initial approximations in Apero are computed with direct methods such as essential matrix and spatial resection (Pierrot-Deseilligny and Clery, 2011). They are far from optimal because they work independently on one, two or three images, not taking into account the full image block. The danger of in-consistent parameter estimates is therefore high, especially when difficult image configuration cases are handled.
The employment of wise image ordering for the initial solution is therefore crucial as it saves not only time but also the possibility to converge in a wrong solution or to diverge. The in-house de-veloped tool resolves this task.
Algorithm 1 illustrates the general scheme of the tool. The three main sub-tasks of the tool are: selection of image pairs suited for feature extraction; feature extraction; creation of image concate-nation queue. The core of the algorithm is the connectivity graph
input : images, IO, EO
output: A) img pairs.XML with image pairs
→inputf orSIF T
B) apero.XML with image concatenation queue
project3d()of all images on the mean ground (footprints);
2d kd-treecreation from all projection centers;
// images in the block = cameras * stations
fors= 1inno. of stations:
take footprints within a radius R from current station;
populate()with footprints,extract()connectivity;
forns= 1inall graph nodes: fores= 1inall graph edges:
ifoverlap>threshold:
// looking angle (LA)
if|nLAs −e LA
s |<threshold:
save(..)to img pairs.xml
save(..)to connectivity containerCC
TAPIOCA()- extract SIFT features; use img pairs.xml;
initialize()1stimage pair (masters);
concatenate(..)all possible images with1st masters;
// Main events - block concatenation
forcam= 1inall cameras: forimg= 1inall img in cam:
// cf. algorithm(2)
if concatenate(..):
updateORIset;
save(..)to concatenation queue in apero.xml; Algorithm 1:Pseudocode of image concatenation in initial orientation.
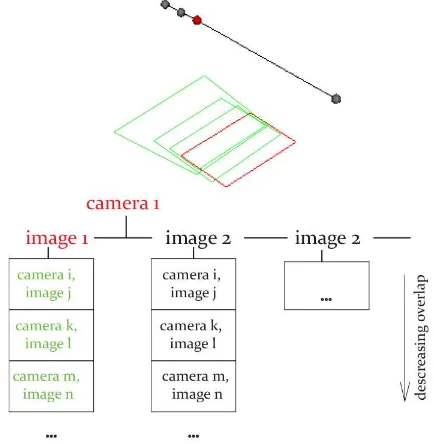
that stores information about the incidence of images’ footprints (projected on mean ground height). Incidence relationships are kept in aconnectivityContainerstruct, cf. algorithm 3, and are accessed via a multiindex key. For instance, if all links to an image are of interested, multiindexing allows to carry out a partial search across existing struct instances and returns all in-stances that include that image ordered by a descending overlap. Multiple indices are a very powerful feature ofboost libraryand allow for specification of complex data structures in a way most suitable for the application.
In step one links between images are created. To establish a link images are tested against overlapping area and camera look-ing direction. Nadir camera images can be ’tied’ to any image provided the overlap is satisfied and they do not have a common projection center. Oblique camera images can be ’tied’ to nadir images when overlap is satisfied, or oblique images under the ad-ditional condition that their looking directions are similar. The graphs’ creation works locally - for each aeroplanestation (at eachstationall cameras register the scene) a neighbourhood is selected to extract incidence relations between the footprints projected from thestationand other footprints in the neighbour-hood. For that purpose the algorithm uses a Kd-Tree that contains allstations, and at every position the neighbours within a search radius are retrieved (cf. Figure 1).
Figure 1: Neighbourhood selected for a given aeroplanestation. Projection centers inside the sphere will be used to evaluate a connectivity graph.
Any images that overlap with the first pair and for which enough SIFT features were extracted are oriented to the first pair. To re-main constant scale with respect to that pair, every image (slave) is ’tied’ with two images that were already oriented (masters). The main events then take place. As the algorithm moves along the flight trajectory (stations), for every image its links to images that have fulfilled prior imposed constraints are obtained. The result is a pair of iterators to the beginning and end of the list of links, a link being an object of theconnectivityContainer
class, see Figure 3 and Algorithm 2. Those elements for which the2nd
master could be found (camera1 imageias the1st mas-ter) are added to the concatenation queue. In order to be sure that images are interchangeably ’tied’ to nadir and oblique images, the latter is prioritized during the search for the2ndmaster. The described pipeline continues so long all the images in the block are ’tied’ to their master images. Figure 2 demonstrates the result. The developed tool creates the graph and manipulates it with the help ofboost libraries, specificallyboost geometry, boost poly-gonandboost multiindex(Boost libraries, 2013, Simonson and Suto, 2009), as well asThe Point Cloud Library(PCL, 2013).
input : image pair,CCcontainer,ORIset, SIFT output: image triplet, boolean return
// ORI - a set of already existing masters
fors= 1inCCinstances: checkimage pairinORI; if both non-oriented:
return(0); else:
set slave;// nonoriented
set master1;// oriented
// find most optimal master2
retrieve all instances of slave ’links’ fromCC
// iters - iterator to the first link
// itere - iterator to the last link whileiters6=itere:
if SIFT>threshold: if iters∩ORI:
return(1); (oblique priority optional)
iters++;
return(1);
Algorithm 2:Pseudocode ofconcatenate(...).
struct connectivityContainer{
camera1; image1;
camera2; image2;
overlap; // ratio of overlap to image area SIFT;}// number of common SIFT features
Algorithm 3:Connectivity container struct
Figure 2: Left: Blue dots represent oblique projection centers (PP), grey dots represent oblique and nadir PP; right: three stages of image block concatenation.
Figure 3: Up: result of a partial search on camera1 image1 (red), linked footprints are displayed in purple; down: the same but contained in a data structure.
4 PERFORMED TESTS
The tests were performed with a dataset over the city of Milano (Italy): the test areas included a dense urban neighbourhood with complex buildings and streets of different dimensions (cf. Figure 4). The block was acquired by the Midas-BlomOblique system composed of 5 cameras (Canon Eos 1D Mark III) with different focal lengths: the nadir camera with a 80 mm and the oblique ones with a 100 mm focal length. Oblique cameras were rotated in the four looking directions (forward, backward, left and right), 45◦with respect to the nadir.
A block of about 550 images extended across an area of 8 km in latitude and 3.5 km in longitude. The overlap between images ac-quired by the same camera was 80% along track and 50% across track. The system was accompanied by the Applanix GNSS/IMU that provided the first orientation of the images, sufficient for rough direct georeferencing but not accurate enough for image matching processes due to the persisting parallax problem be-tween images. The image block had no ground control so the rank deficiency in the final adjustment was removed thanks to the GNSS/IMU data.
Figure 4: Test area in the Milano urban neighbourhood (red rect-angle).
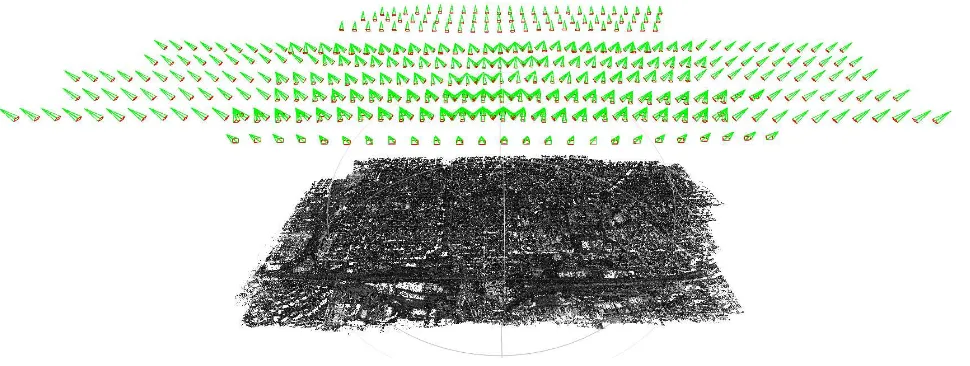
Figure 5: Detail of the relative oriented camera positions in the space.
the borders’ block) up to 46 (in the central part of the block) over-lapping images were identified and the tie points were extracted. Thanks to the connectivity check the time requested for the tie points extraction was reduced by about 15-20 times.
The pipeline described in the previous section was then adopted to establish images’ concatenation. Minimum overlap between images was set to 20% and cameras’ attitude could differ by max-imum 10◦to be regarded as similarly looking. The concatenation succeeded in linking all the images of the block. The relative orientation was then performed in Apero (no constraints between cameras’ positions and attitudes were introduced) resulting in the whole block being correctly processed (cf. Figure 5). The mean value of all image sigmas (square root of the weighted quadratic residuals) was equal to 0.5pix. The images were finally abso-lutely oriented exploiting the GNSS information and constrain-ing the images in their projection centres (IMU information
un-exploited). It was assumed that the GNSS solutions define the position of each image with respect to the eccentricity of the sys-tem with an accuracy of 10-15 cm and the observations’ weight-ing was set accordweight-ingly. The mean value of all image sigmas for the georeferenced result reached 0.6pix (cf. Figure 6).
5 CONCLUSIONS AND FUTURE DEVELOPMENTS
The multi-camera systems have shown to be a valid instrument for several applications. The interest for this kind of systems is greatly increasing in the last few years as it is highlighted by the increasing number of Geomatics companies that are now producing and commercializing multi-camera systems. Anyway, oblique image blocks differ from traditional ones in terms of ge-ometric image configurations and higher number of images to be processed. A conventional solution to allow photogrammet-ric processing in a quick and automated way has not yet reached maturity and remains a research topic.
In this paper, a new methodology to process large blocks of oblique images was presented. The benefits of the connectivity tool are twofold: in terms of computational time and success of the Bun-dle Block Adjustment carried out in Apero. The standard param-eters set in the connectivity algorithm are connected to the flight plan parameters and, for this reason, are stable for a great variety of flight configurations.
The mean re-projection residuals (image sigmas) of the BBA fell below a pixel size but no ground truth information was available and a complete assessment of the orientation quality (with ground control points and check points) was impossible. In the future, further investigations on this topic are forseen. Besides this, sev-eral tests will be performed in order to estimate the reliability of this methodology with other camera configurations and different test areas. The possibility to implement additional constraints in Apero’s BBA will be evaluated too. Lastly, the oriented images will serve as input in image matching processes in order to evalu-ate the reliability of this kind of images for dense 3D point cloud generation.
ACKNOWLEDGEMENTS
This work was funded by FFG Austrian Research Promotion Agen-cy Project No. 832011, the doctoral college Energy Systems 2030 (ENSYS2030) of Vienna University of Technology, ”CIEM Project” (co-founded Marie-Curie Actions 7th F.P. - PCOFOUND-GA-2008-226070, acronym ”Trentino Project”) and the 3M project
(co-founded Marie-Curie Actions FP7 PCOFOUND GA-2008 226070, acronym ”Trentino Project”, ”Incoming Team 2009”). The authors would like to thank Blom CGR S.p.A. (Parma, Italy) for providing the oblique imagery.
REFERENCES
Besnerais, G. L., Sanfourche, M. and Champagnat, F., 2008. Dense height map estimation from oblique aerial image se-quences. Computer Vision and Image understanding 109, pp. 204–225.
Boost libraries, 2013. http://www.boost.org. Homepage of boost C++ library.
Ebner, H., Kornus, W. and Ohlhof, T., 1992. A simulation study on point determination for the MOMS–02/D2 space project us-ing an extended functional model. International Archives of Pho-togrammetry and Remote Sensing 29(B4), pp. 458–464.
Engels, C., Stewnius, H. and Nistr, D., 2006. Bundle adjustment rules. In: Photogrammetric Computer Vision.
Fritsch, D., Kremer, J. and Grimm, A., 2012. Towards All-in-one Photogrammetry. GIM International 26(4), pp. 18–23.
Gerke, M., 2009. Dense matching in high resolution oblique air-borne images. International Archives of Photogrammetry, Re-mote Sensing and Spatial Information Science 38(Part 3/W4), pp. 77–82.
Gerke, M. and Nyaruhuma, A., 2009. Incorporating scene con-straints into the triangulation of airborne oblique images. In: High-resolution earth imaging for geospatial information, Inter-national Archives of Photogrammetry and Remote Sensing, Han-nover, Germany.
Grenzd¨orfer, G., Guretzki, M. and Friedlander, I., 2008. Pho-togrammetric image acquisition and image analysis of oblique imagery. The Photogrammetric Record 23(124), pp. 372–368.
Jacobsen, K., 2008. Geometry of vertical and oblique image com-bination.
Karbo, N. and Simmons, G., 2007. Aerial imagery from different angles. Professional Surveyor Magazine 27, pp. 8–11.
Kurz, F., M¨uller, R., Stephani, M., Reinartz, P. and Schr¨oder, M., 2007. Calibration of wide-angle digital camera system for near real time scenarios. In: High-resolution earth imaging for geospa-tial information, International Archives of Photogrammetry and Remote Sensing, Hannover, Germany.
Lemmens, M., Lemmen, C. and Wubbe, M., 2008. Pictometry: Potentials for land administration. In: International Federation of Surveyors, 6th FIG regional conference, San Jose, Costa Rica.
Lourakis, M. I. A. and Argyros, A. A., 2005. Is Levenberg-Marquardt the most efficient optimization algorithm for imple-menting bundle adjustment? In: Computer Vision, 2005. ICCV 2005. Tenth IEEE International Conference on, Vol. 2, pp. 1526– 1531.
Mishra, P., Ofek, E. and Kimchi, G., 2008. Validation of vector data using oblique images. In: Advances in Geographic Informa-tion Systems, 16th ACM SIGSPATIAL InternaInforma-tional Conference, Irvine, CA.
Nocedal, J. and Wright, S. J., 2006. Numerical Optimization. Springer Verlag.
Nyaruhuma, J., Gerke, M. and Vosselman, G., 2012. Verifica-tionof 3D building models using mutual information in airborne oblique images. In: ISPRS Annals of Photogrammetry, Remote Sensing and Spatial Information Sciences, Vol. I–3.
PCL, 2013. http://www.pointclouds.org. Homepage of PCLoint Cloud Library.
Petrie, G., 2008. Systematic aerial oblique photography using multiple digital cameras. VIII International Scientific & Techni-cal Conference. Porec. Croatia.
Pierrot-Deseilligny, M., 2012. MicMac, Apero, Pastis and Other Beverages in a Nutshell.
Pierrot-Deseilligny, M. and Clery, I., 2011. Open source bundle adjustment software for automatic calibration and orientation of a set of images. ISPRS Commission V Symposium, Image Engi-neering and Vision Metrology, Trento, Italy.
Simonson, L. and Suto, G., 2009. Geometry Template Library for STL-like 2D operations. http://www.boostcon.com.
Triggs, B., McLauchlan, P., Hartley, P. and Fitzgibbon, A., 2000. Bundle Adjustment – A Modern Synthesis. Lecture Notes in Computer Science 1883, pp. 298–372.
Wang, Y., Schultz, S. and Giuffrida, F., 2008. Pictometry’s pro-prietary airborne digital imaging system and its application in 3D city modelling. International Archives of Photogrammetry and Remote Sensing 10(B1), pp. 1065–1070.
Wiedemann, A. and More, J., 2012. Orientation strategies for aerial oblique images. In: International Archives Of Photogram-metry, Remote Sensing and Spatial Sciences, Vol. XXXIX-B1.