QUALITY IN PUBLIC SPACES: MONITORING GREEN AREAS IN MILAN
Franco Guzzetti, Alice Pasquinelli, Anna Privitera
Dept. of Architecture, Built Environment, Construction Engineering, Politecnico di Milano, Italy –
(franco.guzzetti, alice.pasquinelli, anna.privitera)@polimi.it
KEY WORDS: Green public spaces, GIS, GPS, Smart city
ABSTRACT:
The city of Milan gained a lot of experience in management and conservation of urban green spaces: the set goal is to come to a high quality standard of the green areas, to be realized not only downtown, but all over the city.
All the activities related to this issue has been outsourced to a specific Consortium through three-yearly contracts based on a Global Service model and the management structure implemented since 2004 has been set up on GIS technologies and open source applications: this structure has evolved over the years following an increasingly integration of the different operative phases and paying close attention to the update of the geographical data. With the contribution of the academic world and the support of technical experts in webGIS applications field, Milan today can count on a management system in which cartographical aspects are perfectly integrated with maintenance activities executed by operators on site and check inspections carried out by municipal controllers, ensuring a high level of the geo-database updating.
The focus now is on the arrangement of a performance monitoring system, aimed to control the achievement of the quality standard fixed by contract with the Consortium. In the research here introduced we want to describe how the unification of the workflows -related to the upkeep schedules on the one hand and to the control activities on the other hand- together with the use of GPS technologies contributed in improving efficiency in practical intervention in case of warnings sent by controllers, in daily works and data update, producing as a consequence an enhancement of the maintenance service provided.
In this way the “Green GIS” can now be used for further qualitative upgrade in management of green areas in Milan, with new challenges related to the concept of “smart city”.
1. INTRODUCTION
All the activities related to the management of green areas in Milan have been outsourced to a specific Consortium (COGES) through three-yearly contracts based on a Global Service model. This model can be described as a performance contract based on a set quality standard: the contractor which signs this contract has to provide all the necessary maintenance operations in order to guarantee the achievement of the quality standard for all the items related to the green areas (e.g. trees, bushes, meadows, urban furniture and playgrounds), respecting the timetable expected for each operation (e.g. a broken slide or seesaw has to be secured in 24 hours and replaced or repaired in 5 days). In this way, controls over the respect of this standard are an essential part of the contract.
This system requires a significant organization: 21,17 km2 of green areas, more than 245.000 trees, 25 municipal controllers checking dissimilarities in respect to standard over the areas, 7 companies forming the COGES consortium providing upkeep service, informatics support for interaction between the municipality, COGES and the citizens. For this reason since 2004 the Municipality of Milan has implemented a management system based on a thematic GIS.
2. EVOLUTION OF THE GREEN MANAGEMENT
SYSTEM
Before the beginning of the so called “Green Project” the Office in charge for Parks and Gardens used to coordinate and manage maintenance operations of green public spaces using three different tools: a CAD cartography, created through topographic survey of the green areas, and two databases, the
Picture 1 – Spatial localization of green areas in Milan
first one related to the trees and the planted surfaces, the second one related to the inspections and to the maintenance work. The first significant step toward a more efficient management of the green areas was the unification of these different tools in one GIS database: this “Green GIS” has been realized in order to clearly relate geometrical features with the International Archives of the Photogrammetry, Remote Sensing and Spatial Information Sciences,
respective information contained in the alphanumeric databases and is suitable for the continuous joined update. Information about items in the cartography have been organized following survey and representation technical specifications, developed starting from the different maintenance works that these objects requires.
At the very beginning of this project COGES complained about the creation of a green GIS as, from the consortium point of view, it was not strictly related to the green upkeep and GIS update was seen as a waste of time. After few years, the use of the GIS as a management system gave positive results in efficiency and in 2008 COGES asked to the Municipality (in charge for ordinary and extraordinary planning) to give up old paper report and to relate all operations programmed to the items in the GIS.
As soon as the GIS was structured, with the contribution of the software house R3-Gis, four browser applications were developed in order to allow the access to the data by the different users involved in the green management and maintenance. Through these apps it was possible to:
- manage the single areas (locality);
- schedule and plan the maintenance works, with direct link to the objects involved;
- manage the tree census and all upkeep and control activities over the woody heritage;
- monitor and manage playgrounds;
Picture 2 – The integrated management model
It is from maintenance and control activities over the green areas that the update flow is generated: if an upkeep operation involve a modification on the geometrical component or on the attributes of a feature (e.g. the planting of a new tree), the maintenance company in charge for that operation has to access to the database and produce the update required. In order to ensure the update of the green GIS, the payment of maintenance works is tied to the update itself, so if a new tree is planted, the
payment for that operation is made only after the localization of the new feature in the GIS.
Control and reporting activities about cases of dissimilarity with the quality standard (e.g. warning about a broken game in a playground) were still managed through a separate system, not connected to the GIS: this caused several difficulty in the correct identification of the objects and areas that warnings were referred to.
In 2011, in order to overcome these problems, COGES consortium and the Municipality of Milan decided that also control activities had to be connected to the green GIS: all warnings reported had to be linked to the corresponding items in the geo-database. This step represented an occasion for the unification of all application in a one browser software, able to manage the whole maintenance service in its entirety: in this way, maintenance activities, health control over trees, inspections over playgrounds, dissimilarity report are now manages through a unitary software that can guarantee continuous updates and allow predictive analysis aiming to a continuous improvement.
This integration allowed the unification of the workflows related to maintenance and control activities, improving efficiency in intervention over dissimilarities reported.
3. HANDHELD GPS FOR MANAGING AND CHECKING THE GREEN GIS
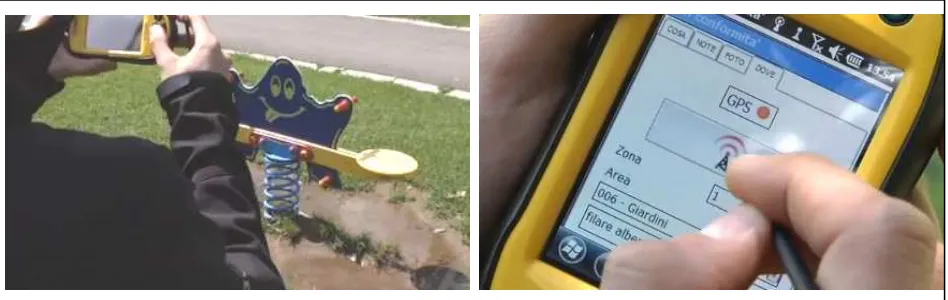
The innovative management model is based on the use of handheld GPS by the municipal controllers and by the COGES operators with the aim of highlighting dissimilarities: through these devices it is possible to acquire positional references and take high-resolution georeferenced pictures, useful for collecting information and evidences about dissimilarities International Archives of the Photogrammetry, Remote Sensing and Spatial Information Sciences,
carried out with the upkeep operators, in order to test the practicality of the solutions adopted.
From a management point of view it was decided not to directly modify the database during operation on site: upkeep operators, wich are not GIS operator, have to report their activies and eventual warnings using GPS devices through a predefined interface. At the end of the day, the handheld is synchronized to the GIS and update take place: the day after, handhelds are ready with the situation updated, with daily operation programmed and including eventual dissimilarity cases reported the day before to be fixed.
The GPS devices have been realized in order to guarantee a good use by non-expert operators and does not show any maps: the interface allow to insert a description of the problem noticed, take a picture of it and, through the GPS technology, collect spatial references about the object of interest with a positioning accuracy of 2-5 meters.
Once dissimilarities are detected, at the end of the day each operator/controller proceeds with synchronization of the data gathered with the features contained in the Green GIS: every information collected is uploaded to the GIS server, geographically located thanks to the coordinates acquired by the GPS and linked to a specific object in the database through the procedure described as follow.
First of all, for each dissimilarity the software create a buffer useful to identify the related object in the GIS. The width of the buffer depend on the precision of the survey operated and so
by the DOP (dilution of precision) value registered by the GPS during the survey: given that the precision level is inversely proportional to DOP registered, the higher is the DOP value, the larger the buffer will be.
The buffer produced allow to select the feature located near by the point where the problem was observed: from this selection, the software automatically identify the objects whose attributes are coherent with the kind of problem reported; so for example a dissimilarity about a playground will be linked to play object in the GIS placed within the boundary of the buffer.
At the end of this procedure three different situations can occur, depending on the precision of the GPS survey and on the positioning and data accuracy of the objects in the geo-database:
- an automatic detection of the correct object in the GIS;
- detection of two or more object in the GIS: in this case the operator has to choose the right object between those selected, using the information provided from the picture taken;
- none object is detected: also in this case the operator can identify the correct feature observing the picture, but this kind of problem could depend on a lack or an error in the geo-database.
After the link between dissimilarity warnings and feature in Green GIS is created, the controller filters the warning collected, checking if any maintenance activity, useful to overcome the problems reported, is already scheduled: in this case the warning reported are stored, as appropriate upkeep operations are already planned.
Otherwise, the dissimilarity reported becomes part of the maintenance activities scheduled, with different priority levels depending on the danger level detected.
In short, the management of dissimilarities involve these phases:
- detection of dissimilarities;
- linkage between dissimilarity warnings and features in the GIS, paying attention on the correct
identification of the objects in the geo-database; - analysis of the dissimilarities collected:
o checking if any other similar warnings were reported over the same objects;
o checking if any maintenance activity is already planned for the object highlighted; - activities schedule, organizing priorities according
with the danger level detected;
- execution and billing on account of activities executed.
Geo-referenced warnings together with the support provided by the picture taken in case of dissimilarity produce an integration of information over the same database and made inspections more objective, ensuring a better quality of the public green spaces, making easier to identify the problematic objects and reducing the redundant warnings as it was on the previous model.
The table show data and quantities of warnings collected through handheld GPS between May and August 2012.
Table 1 – Data over the experimentation period
As shown in the table, 70% of the warnings uploaded are automatically linked to univocal objects in the GIS, 5% requires the operator to choose the correct feature among those selected, in 25% of the cases the linkage requires a little more elaborate operation.
It is important to highlight that anomalies in the GIS do not affect the dissimilarity report procedure. In fact, in case of misalignment between warnings and features in the GIS, due to errors related to the attributes or lacks in the geometric component, warnings are linked to temporary object labeled as “object to be defined”. GIS specialists will verify and eventually update the database deleting temporary objects reported by the controllers.
In this way all dissimilarities detected and filtered become an update input of the database, which in turn is an integral part of the maintenance process and cases of misalignment between database and reality will tend to run out as corrections will be made thanks to the software described.
4. RESULTS AND CONCLUSIONS
The data model chosen, the quality of survey and the integration between operative tools with the cartography are key elements of the model implemented and give to the GIS a core role in green management, integrating in a single database all activities ran on the field. The hole innovation, in few months of experimentation, prove a good performance and improved the quality characteristics of the geographical data, as operative works are based on attributes and geometries existing in the GIS.
Thanks to the use of handheld GPS it has been possible to improve the informational, the positional and the temporal content of the Green GIS, and the system increased its interrogation and potential use as data available are always closer to the realty.
The way toward a higher efficiency in green management is not finished yet. A smart irrigation system based on the real need of water, and not on a scheduled timetable, could optimize the water supply, with advantages also from an economic point of view. This is just an example of the new challenges that the smart city will have to afford in order to improve the efficiency in use of scarce resources.
quantity %
Period of time (months) 4
Number of warnings reported 692
Dissimilarities deliverd reported 16.522
Daily amount of dissimilarities 100 to 250
Cases of automatic link between
warnings and GIS features 70% Cases of multiple detection: two or
more object 5%
Cases of non-detection 25%
Picture 4 – Warning reporting over a play
REFERENCES
Antonelli, A., Gusti, R., Guzzetti, F., Privitera, A., Viskanic P. 2012, Palmari GPS nella gestione e nel controllo del Gis del verde di Milano, 16° Conferenza Nazionale ASITA – Vicenza 6/9 Novembre
Cattaneo, N., Di Maria, F., Guzzetti., F., Privitera, A., Viskanic P. 2009, Milano: developments in the management of green areas through computerization, UDMS Annual (published by Taylor & Francis) Lubjana
Cattaneo N, Di Maria F, Guzzetti F, Privitera A, Viskanic P. (2008), “ Milano: l’aggiornamento del Gis del Verde”, MondoGIS,68: 51-55.
Cattaneo, N., Di Maria, F., Guzzetti., F., Privitera, A., Viskanic P. 2008, La gestione della banca dati delle aree verdi del comune di Milano attraverso l’aggiornamento continuo dei dati, 12° Conferenza Nazionale ASITA – L’Acquila 21/24 Ottobre
Cattaneo N, Di Maria F, Guzzetti F, Privitera A. (2007) Specifiche tecniche per il rilievo topografico delle aree verdi nell’ambito del Gis tematico del Comune di Milano – 11° Conferenza Nazionale ASITA – Torino 6/9 Novembre.
Di Maria F, Guzzetti F, Privitera A, Viskanic P. (2005), Progetto verde Milano: il censimento e la gestione del verde con strumenti WebGis - 9° Conferenza Nazionale ASITA – Catania 15/18 Novembre.