MULTICRITERIA ANALYSIS FOR SOURCES OF RENEWABLE ENERGY USING
DATA FROM REMOTE SENSING
L. Matejicek*
Institute for Environmental Studies, Charles University in Prague, Czech Republic [email protected]
KEY WORDS: Solar energy, Wind energy, Biomass potential, Small hydropower plants, GIS, Multicriteria analysis
ABSTRACT:
Renewable energy sources are major components of the strategy to reduce harmful emissions and to replace depleting fossil energy resources. Data from remote sensing can provide information for multicriteria analysis for sources of renewable energy. Advanced land cover quantification makes it possible to search for suitable sites. Multicriteria analysis, together with other data, is used to determine the energy potential and socially acceptability of suggested locations. The described case study is focused on an area of surface coal mines in the northwestern region of the Czech Republic, where the impacts of surface mining and reclamation constitute a dominant force in land cover changes. High resolution satellite images represent the main input datasets for identification of suitable sites. Solar mapping, wind predictions, the location of weirs in watersheds, road maps and demographic information complement the data from remote sensing for multicriteria analysis, which is implemented in a geographic information system (GIS). The input spatial datasets for multicriteria analysis in GIS are reclassified to a common scale and processed with raster algebra tools to identify suitable sites for sources of renewable energy. The selection of suitable sites is limited by the CORINE land cover database to mining and agricultural areas. The case study is focused on long term land cover changes in the 1985-2015 period. Multicriteria analysis based on CORINE data shows moderate changes in mapping of suitable sites for utilization of selected sources of renewable energy in 1990, 2000, 2006 and 2012. The results represent map layers showing the energy potential on a scale of a few preference classes (1-7), where the first class is linked to minimum preference and the last class to maximum preference. The attached histograms show the moderate variability of preference classes due to land cover changes caused by mining activities. The results also show a slight increase in the more preferred classes for utilization of sources of renewable energy due to an increase area of reclaimed sites. Using data from remote sensing, such as the multispectral images and the CORINE land cover datasets, can reduce the financial resources currently required for finding and assessing suitable areas.
* Corresponding author. This is useful to know for communication with the appropriate person in cases with more than one author.
1. INTRODUCTION
The concept of sustainability requires balanced conditions between energy, the economy, and environmental and social aspects. Future energy systems require an optimized solution among emissions, supply security and the market economy. Recent attention focused on global warming and fluctuations in energy prices caused by the great concentration of fossil resources in politically unstable regions have increased the interest in renewable energy and clean combustion technology. In order to achieve sustainability without compromising the potential for future generations, new analyses based on an energy-economic model and its application are needed on the scale of regional energy policies, renewable energy systems, and the regional environment.
2. ANALYSIS AND MODELLING
Spatio-temporal modelling and multicriteria analysis for regional energy planning and development have been used for a number of decades. Formerly, modelling tools were developed in response to the first oil embargo. Recently, global warming has become one of the most significant topics for decision makers. These models have been developed to predict the impact of increased CO2 concentrations on the climate and to present alternative economic strategies for minimizing
emissions. The optimization of energy systems requires both economic and environmental considerations. The more complex energy-economic models are not only numerical tools for predicting the future, but also management tools for decision-making that include information about environmentally sound technologies. They deal with multi-disciplinary fields that encompass the economy and the environment. Technological innovations and efficiency improvements implemented in these models can provide better optimizations on the local and global scale (Nakata, 2004).
2.1 Analysis and optimization techniques
intermittent nature. But integration of various renewable energy sources coupled with conventional fossil fuel-based sources can improve reliability in regular energy supply on a regional scale. Renewable energy sources by themselves are often extended to include an energy storage system that encompasses hybrid renewable energy sources, as their electricity generation capacity depends on location and time. In order to develop an efficient power grid, it is important for the regional authority to know the exact capacity of various renewable energy sources, because each renewable energy source has a different electricity generation capacity. Optimized deployment of renewable energy sources can reduce the operational and maintenance costs of the energy generating units. In general, cost minimization and power maximization under defined environmental and social restrictions are the two main objectives for development power supply grids. Many analyses and optimization techniques have been proposed for balancing these two objectives (Iqbal et al., 2014; Arnette and Zobel, 2012). Various studies have been published about the methods and tools used to evaluate the availability of renewable energy (Angelis-Dimakis et al., 2011; Long et al., 2013; Muselli et al., 1999; Wang and Koch, 2010; Inman et al., 2013; Calvert et al., 2013).
2.2 Remote sensing and GIS-based methods
The increasing attention paid to the role of small decentralized renewable energy developments can play an important role in the expansion of renewable energy sources and alter energy-consumption behavior through active community engagement. Remote sensing and GIS-based techniques are often used to develop a methodology for evaluation of the regional-scale potential for community-based renewable energy sources. This approach combines a range of technologies including hydro-power, wind-hydro-power, solar photovoltaic and bioenergy. Spatial analysis of satellite and aerial images together with existing map layers encompass a mix of localized renewable energy developments (Gormally et al., 2012). GIS can support multicriteria analysis and assessment for siting wind and solar farms (Janke, 2010) and biomass plants (Perpina, et al., 2013; Hohn et al., 2014; Zhang et al., 2011; Ahamed et al., 2011). It can also support the evaluation of potential renewable energy from installed developments in relation to solar and wind potential (Erdinc and Uzunoglu, 2012) and biomass potential from energy crops on a regional scale (Fiorese and Guariso, 2010; Thomas et al., 2013; Hammer et al., 2003; Larsson and Nilsson, 2005; Nygaard et al., 2010).
3. INPUT DATASETS
The described research was carried out to determine which land cover classes are affiliated with high solar, wind, hydro and biomass potential over a period of several decades. The remote sensing data and multicriteria GIS modelling techniques were used to identify sites that are suitable for solar farms, wind and biofuel production and small hydro energy plants. The input data layers were represented by satellite multispectral images captured by Landsat satellites in the 1985-2015 period.
3.1 The area of interest
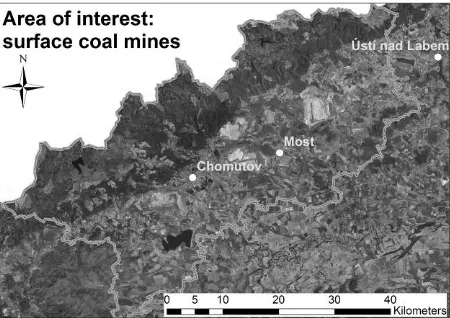
The area of interest encompasses surface coal mines in the northwestern region of the Czech Republic, where the impacts of surface mining and reclamation constitute a dominant force in land cover changes. The area covers approximately 1875
km2, Figure 1. Massive surface mining has been carried out regularly since the early 1970s. Environmental remediation has been performed at selected sites since the 1990s (Matejicek and Kopackova, 2010).
Figure 1. The area of interest, an area of surface coal mines in the northwestern region of the Czech Republic.
3.2 Available input datasets
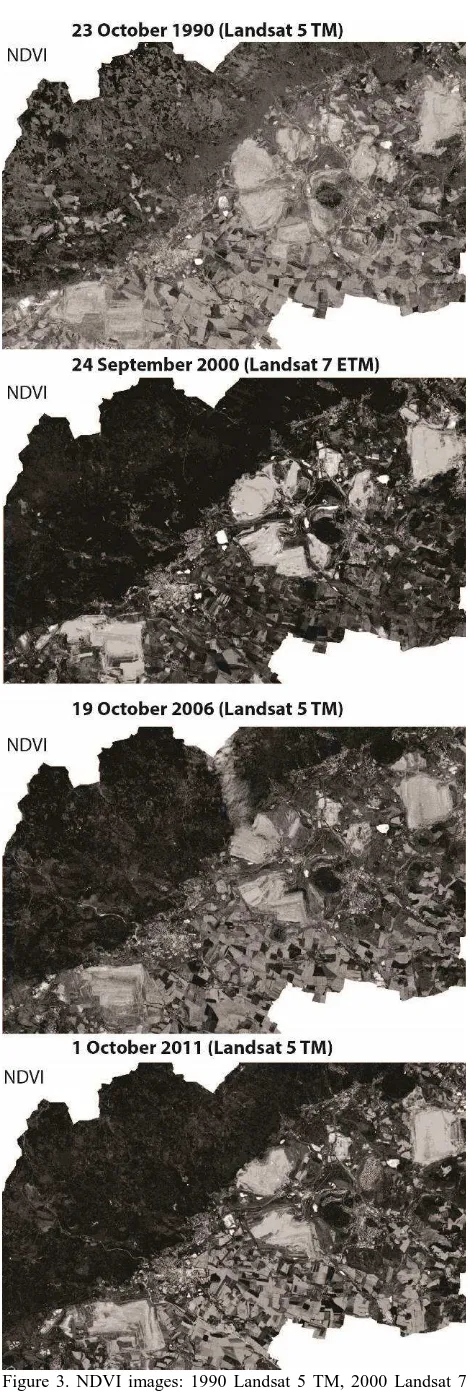
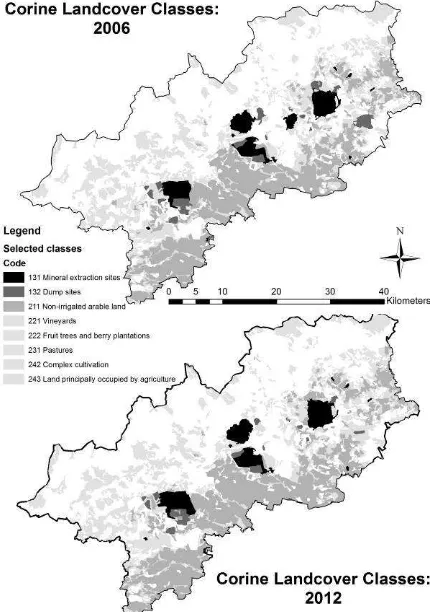
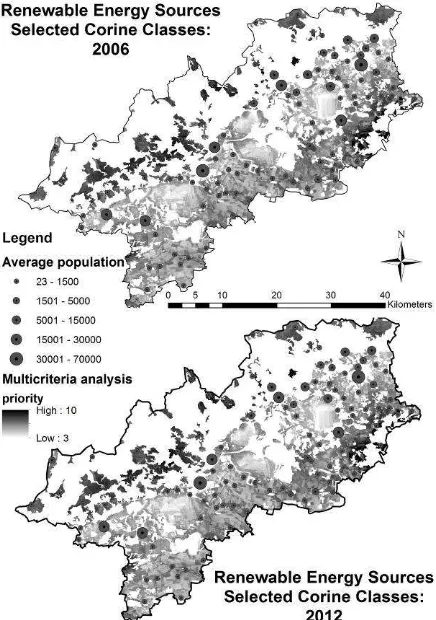
The satellite images were used to evaluate the biomass potential using the Normalized Difference Vegetation Index (NDVI). The images captured by Landsat satellites in 1990 (Landsat 5 TM), 2000 (Landsat 7 ETM+), 2006 (Landsat 5 TM) and 2011 (Landsat 5 TM) and corresponding NDVI layers are illustrated in Figure 2 and Figure 3. The satellite images are complemented by data from the CORINE (Coordination of information on the environment) land cover project for land cover mapping in 1990, 2000, 2006 and 2012, Figure 4 and Figure 5. The CORINE land cover nomenclature is used for selection of mineral extraction sites (1.3.1.), dump sites (1.3.2.) and all the agricultural classes (2.x.x.) that take priority over other land cover classes for utilization of renewable energy sources. Other important input spatial datasets are represented by estimation of the average wind speed above 10 meters over the surface and average solar energy per year, Figure 6. This is complemented by the mapping of weirs (Matejicek, 2014), which can be used for utilization of small hydro energy plants, and transport services, together with the population in regional cities that can be supplied by these sources of renewable energy, Figure 7.
4. RESULTS
Figure 2. Multispectral images: 1990 Landsat 5 TM, 2000 Landsat 7 ETM+, 2006 Landsat 5 TM and 2011 Landsat 5 TM.
Figure 4. Selected classes from the land cover datasets in CORINE for land cover mapping in 1990 and 2000.
Figure 5. Selected classes from the land cover datasets in CORINE for land cover mapping in 2006 and 2012.
Figure 6. Average solar energy per year and estimation of the average wind speed 10 meters above the surface.
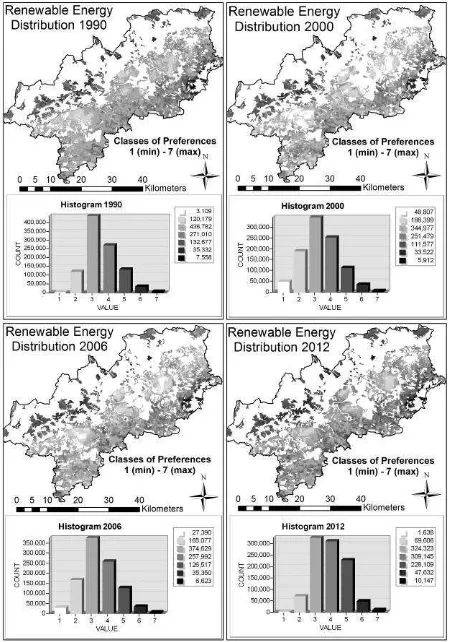
Figure 8. Moderate changes in mapping of suitable sites for utilization of renewable energy sources in 1990 and 2000.
Figure 9. Moderate changes in mapping of suitable sites for utilization of renewable energy sources in 2006 and 2012.
The reclassification of solar energy within a range of 1-10 is based on the yearly sum of global irradiation on horizontal inclined surface. The data presented by the Institute for Energy and Transport (IET) represent the 10-year average for the 1981-1990 period and all the data values are given as kWh m-2 (Šúri et al., 2007). The original data within the range 970-1010 kWh m-2 are divided into 10 equal intervals which are linked to the values (1-10) for multicriteria analysis.
Reclassification of the wind potential in the same 1-10 range is derived from the wind speed 10 meters above the surface. The original data are available through the Web Map Service (WMS) http://geoportal.gov.cz/web/guest/wms of the Czech National Geoportal managed by CENIA.
The hydro power is based on the location of weirs as potential sites for utilization of small hydro energy plants. Because of the high variability of surface water flows during the analysed period of 1985-2015, reclassification of the available hydro energy is based on the distance from the nearest small hydro energy plant. The grid of distances created for the whole region is reclassified within the same range of 1-10 for multicriteria analysis.
Reclassification of the biomass potential within the 1-10 range employs NDVI, which is used for a simplified estimate of the live green vegetation. A dense vegetation canopy tends to positive values. Reclassification of the biomass potential within the 1-10 range is used experimentally for a positive value 0-1. The negative values are appended to class 1. In order to reduce high seasonal variability, images from Landsat 5 TM and Landsat 7 ETM+ for 1990 (Landsat 5 TM: October 23), 2000 (Landsat 7 ETM+: September 24), 2006 (Landsat 5 TM: October 19) and 2012 (substituted by Landsat 5 TM: October 1) are used for NDVI calculation.
After establishing a common scale for reclassified datasets, the map algebra is used to combine them to rate each subarea in the grid of the region. The average values of four input classified datasets represent the rates for cells in the grid. In this step, the values of the input grids can be weighted in order to change the equal percentage influence. In the next step, the number of suitable sites is reduced by land cover classes from CORINE to mining sites and agricultural areas. The output grid indicates suitable locations for utilization of sources of renewable energy on a scale of preferences.
The case study is also focused on long term land cover changes in the 1985-2015 period. The multicriteria analysis for land cover classes from the CORINE database in 1990, 2000, 2006 and 2012 shows moderate changes in the mapping of suitable sites for utilization of selected sources of renewable energy in Figure 8 for 1990 and 2000 and in Figure 9 for 2006 and 2012.
The average population in Figure 10 for the studied 1985-2015 period indicates a potential demand for energy that can be supplied by utilization of renewable energy in the surrounding sites.
Figure 10. Mapping of the energy potential on the scale preference classes (1-7), where the first class is linked to minimum and the last class to maximum preference.
5. DISCUSSION
The southern part of the region has greater potential for solar development based on the yearly sum of global irradiation from a European solar radiation database. This part also contains the majority of agricultural flatland, which can be used for larger solar development. The density of settlements becomes applicable for this source of renewable energy. The middle part also contains a large area of surface mines with mine disposal and remediation sites.
Based on datasets for wind speed and the results of multicriteria analysis, highly preferable sites for small wind farms are located in the northwestern part of the region on the slopes of the Ore Mountains. The western part of the Ore Mountains includes the highest peak, Klinovec, with an altitude of 1,244 meters. While the mountains slope gently away in the northern part close to the German border, the southern slopes are steeper. The northern parts of the mountains with higher altitude are preferable for utilization of standalone wind turbines and small wind farms, but this area contains a minority of agricultural land cover classes and is sparsely populated.
The southern part of the Ore Mountains contains rather steep slopes with many small streams that form brooks and rivers in
the valleys in the middle part of the region. Many weirs in this part can be utilized for small hydro energy plants. In addition, the density of settlements creates a demand for electricity consumption and road networks to manage the hydro power systems. The accessibility of these sources of renewable energy is finally selected as a main factor for multicriteria analysis, due to the high seasonal variability of surface water flows on the southern part of the Ore Mountains.
Evaluation of biomass resources and their bioenergy potential can be approximated by the NDVI using data from remote sensing (Miura et al, 2006; Liu et al., 2012; Hwang et al., 2011). Based on CORINE land cover datasets, land cover classes in 1990, 2000, 2006 and 2012 were used for delineation of mineral extraction/dump sites and all agricultural classes, which were used as potential sources of renewable energy. Thus, other land cover classes, including forests with many small protected areas (nature reserves and natural monuments), were excluded from the multicriteria analysis. Images from Landsat satellites enable long term exploration (1990-2012) of the energy potential, which is important in relation to the massive surface mining activities and reclamation of post-mining areas. In spite of a weak link between NDVI and the biomass potential, long term monitoring by satellite images yields a wide range of information about landscape development and progress for utilization of renewable energy. It is less useful for highly variable biomass in agricultural sites, but can indicate the biomass potential of spontaneous vegetation in many areas following massive surface coal mining in the period of land remediation. Evaluation of biomass resources in the long term period by satellite images shows moderate variability, which is represented in Figure 10 by histograms of preference classes (Lasanta and Vicente-Serrano, 2012).
The results of multicriteria analysis yield mapping of the energy potential on a scale of a few preference classes (1-7). In order to demonstrate the variability of the accessible sites for sources of renewable energy, land cover changes based on the CORINE land cover database are used for delimitation of suitable land cover classes. Multicriteria analysis requires well-defined input variables and weights that logically influence the results. Thus, many improvements will be needed to adapt selected methods in the future. In the presented case study, the same weights have been used for multicriteria analysis for a basic insight, (Yue, et al., 2006; Troldborg et al., 2014).
At the present time, the most important source of energy is represented by fossil fuels, which are also distributed outside the region. In the future, the utilization of sources of renewable energy will be increasingly necessary. In addition, more complex multicriteria analysis will be required to meet the demands of investors, governmental agencies, and environmentalist. Classification derived from a minimum and maximum of the energy potential will have to be replaced by the real energy output for all the sources of renewable energy in order to estimate the total energy potential from these sources. The weights in the multiriteria analysis will also have to be accommodated to local social and economic needs. This approach must be based on local projects that can evaluate the financial input and profit together with environmental insight and other criteria (Dagdougui et al., 2011; Sarralde et al., 2015; Celik, et al., 2009; Grassi et al., 2012).
fully meet the energy requirements of the local population in this region. The combination of several sources of renewable energy based on local efficiency will be able to replace only part of the energy sources based on fossil fuels. However, after the coal reserves have been exhausted, economic, social and environmental factors will have to be re-evaluated in order to stabilize the economy of the region (Fais, et al., 2014; Arnold, 2015; Menegaki, 2013; Pereira et al., 2014)
6. CONCLUSION
The way in which energy is used will change in response to a number of fundamental challenges, such as access to efficient commercial energy sources, meeting the expanding and shifting energy market in an urbanized world, preventing pollution and minimizing avoidable risk by utilizing suitable technological solutions and reducing energy imports from politically unstable regions. In developing suitable energy-economic models for specific renewable energy purposes, it is important to employ a suitable tool to consider geographical regions, energy classification and economic parameters. In relation to the environment, environmentally friendly technologies can be more expensive than low-cost technology based on coal- or gas-fired plants. They are also dependent on liberalization of the energy markets and reconciliation of environmental goals. Using data from remote sensing, such as multispectral images complemented by NDVI and the CORINE database, in the multicriteria analysis for long term periods can reduce financial resources currently allocated toward finding and assessing suitable areas.
ACKNOWLEDGEMENTS
The modelling research was processed in the GIS Laboratory at the Faculty of Science, Charles University in Prague and was supported in the framework of FRVS project 131/2014/A/a. We are grateful to the Institute for Energy and Transport (IET) for presentation of solar radiation and photovoltaic electricity potential country and regional maps for Europe in the Joint Research Centre Science Hub of the European Commission. We would like to thank the national authorities, such as CENIA and T.G. Masaryk Water Research Institute, for regional spatial datasets.
REFERENCES
Ahamed, T., Tian, L., Zhang, Y., Ting, K. C., 2011. A review of remote sensing methods for biomass feedstock production. Biomass and Bioenergy, 35(7), 2455–2469.
Angelis-Dimakis, A., Biberacher, M., Dominguez, J., Fiorese, G., Gadocha, S., Gnansounou, E., … Robba, M., 2011. Methods and tools to evaluate the availability of renewable energy sources. Renewable and Sustainable Energy Reviews, 15(2), 1182–1200.
Arnette, A., Zobel, C. W., 2012. An optimization model for regional renewable energy development. Renewable and Sustainable Energy Reviews, 16(7), 4606–4615.
Arnold, U., 2015. Economic risk analysis of decentralized renewable energy infrastructures - A Monte Carlo Simulation approach. Renewable Energy, 77, 227–239.
Aslani, A., Wong, K.-F. V., 2014. Analysis of renewable energy development to power generation in the United States. Renewable Energy, 63, 153–161.
Blaschke, T., Biberacher, M., Gadocha, S., Schardinger, I., 2013. “Energy landscapes”: Meeting energy demands andhuman aspirations. Biomass and Bioenergy, 55, 3–16.
Calvert, K., Pearce, J. M., Mabee, W. E., 2013. Toward renewable energy geo-information infrastructures: Applications of GIScience and remote sensing that build institutional capacity. Renewable and Sustainable Energy Reviews, 18, 416-429.
Celik, A. N., Muneer, T., Clarke, P., 2009. A review of installed solar photovoltaic and thermal collector capacities in relation to solar potential for the EU-15. Renewable Energy, 34(3), 849– 856.
Dagdougui, H., Ouammi, A., Sacile, R., 2011. A regional decision support system for onsite renewable hydrogen production from solar and wind energy sources. International Journal of Hydrogen Energy, 36(22), 14324–14334.
Fais, B., Blesl, M., Fahl, U., Voß, A., 2014. Comparing different support schemes for renewable electricity in the scope of an energy systems analysis. Applied Energy, 131, 479–489.
Erdinc, O., Uzunoglu, M., 2012. Optimum design of hybrid renewable energy systems: Overview of different approaches. Renewable and Sustainable Energy Reviews, 16(3), 1412–1425.
Fiorese, G., Guariso, G., 2010. A GIS-based approach to evaluate biomass potential from energy crops at regional scale. Environmental Modelling and Software, 25(6), 702–711.
Gormally, M., Whyatt, J. D., Timmis, R. J., Pooley, C. G., 2012. A regional-scale assessment of local renewable energy resources in Cumbria, UK. Energy Policy, 50, 283–293.
Grassi, S., Chokani, N., Abhari, R. S., 2012. Large scale technical and economical assessment of wind energy potential with a GIS tool: Case study Iowa. Energy Policy, 45, 73–85.
Hammer, A., Heinemann, D., Hoyer, C., Kuhlemann, R., Lorenz, E., Müller, R., Beyer, H. G., 2003. Solar energy assessment using remote sensing technologies. Remote Sensing of Environment, 86(3), 423–432.
Höhn, J., Lehtonen, E., Rasi, S., Rintala, J., 2014. A Geographical Information System (GIS) based methodology for determination of potential biomasses and sites for biogas plants in southern Finland. Applied Energy, 113, 1–10.
Hwang, T., Song, C., Bolstad, P. V., Band, L. E., 2011. Downscaling real-time vegetation dynamics by fusing multi-temporal MODIS and Landsat NDVI in topographically complex terrain. Remote Sensing of Environment, 115(10), 2499–2512.
Inman, R. H., Pedro, H. T. C., Coimbra, C. F. M., 2013. Solar forecasting methods for renewable energy integration. Progress in Energy and Combustion Science, 39(6), 535–576
Janke, J. R., 2010. Multicriteria GIS modeling of wind and solar farms in Colorado. Renewable Energy, 35(10), 2228–2234.
Larsson, S., Nilsson, C., 2005. A remote sensing methodology to assess the costs of preparing abandoned farmland for energy crop cultivation in northern Sweden. Biomass and Bioenergy, 28(1), 1–6.
Lasanta, T., Vicente-Serrano, S. M., 2012. Complex land cover change processes in semiarid Mediterranean regions: An approach using Landsat images in northeast Spain. Remote Sensing of Environment, 124, 1–14.
Liu, J., Pattey, E., Jégo, G., 2012. Assessment of vegetation indices for regional crop green LAI estimation from Landsat images over multiple growing seasons. Remote Sensing of Environment, 123, 347–358.
Long, H., Li, X., Wang, H., Jia, J., 2013. Biomass resources and their bioenergy potential estimation: A review. Renewable and Sustainable Energy Reviews, 26, 344–352.
Matejicek, L., Kopackova, V., 2010. Changes in Croplands as a Result of Large Scale Mining and the Associated Impact on Food Security Studied Using Time-Series Landsat Images. Remote Sensing, 2(6), 1463–1480.
Matejicek, L., 2014. Integration of simulation models for watershed management and data from remote sensing in geographic information systems. Proceedings of the 7th International Congress on Environmental Modelling and Software, June 15-19, San Diego, California, USA.
Menegaki, A. N., 2013. Growth and renewable energy in Europe: Benchmarking with data envelopment analysis. Renewable Energy, 60, 363–369.
Miura, T., Huete, A., Yoshioka, H., 2006. An empirical investigation of cross-sensor relationships of NDVI and red/near-infrared reflectance using EO-1 Hyperion data. Remote Sensing of Environment, 100(2), 223–236.
Muselli, M., Notton, G., Poggi, P., Louche, A., 1999. Computer-aided analysis of the integration of renewable-energy systems in remote areas using a geographical-information system. Applied Energy, 63, 141–160.
Nakata, T., 2004. Energy-economic models and the environment. Progress in Energy and Combustion Science, 30(4), 417–475.
Nygaard, I., Rasmussen, K., Badger, J., Nielsen, T. T., Hansen, L. B., Stisen, S., … Togola, I., 2010. Using modeling, satellite images and existing global datasets for rapid preliminary assessments of renewable energy resources: The case of Mali. Renewable and Sustainable Energy Reviews, 14(8), 2359–2371.
Pereira, E. J. D. S., Pinho, J. T., Galhardo, M. A. B., Macêdo, W. N., 2014. Methodology of risk analysis by Monte Carlo Method applied to power generation with renewable energy. Renewable Energy, 69, 347–355.
Perpiña, C., Martínez-Llario, J. C., Pérez-Navarro, Á., 2013. Multicriteria assessment in GIS environments for siting biomass plants. Land Use Policy, 31, 326–335.
Sarralde, J. J., Quinn, D. J., Wiesmann, D., Steemers, K., 2014. Solar energy and urban morphology: Scenarios for increasing
the renewable energy potential of neighbourhoods in London. Renewable Energy, 73, 1–8.
Šúri, M., Huld, T., Dunlop, E. D., Ossenbrink, H., 2007. Potential of solar electricity generation in the European Union member states and candidate countries. Solar Energy, 81(10), 1295–1305.
Tafarte, P., Das, S., Eichhorn, M., Thrän, D., 2014. Small adaptations, big impacts: Options for an optimized mix of variable renewable energy sources. Energy, 72, 80–92.
Thomas, A., Bond, A., Hiscock, K., 2013. A GIS based assessment of bioenergy potential in England within existing energy systems. Biomass and Bioenergy, 55, 107–121.
Troldborg, M., Heslop, S., Hough, R. L., 2014. Assessing the sustainability of renewable energy technologies using multi-criteria analysis: Suitability of approach for national-scale assessments and associated uncertainties. Renewable and Sustainable Energy Reviews, 39, 1173–1184.
Wang, S., Koch, B., 2010. Determining profits for solar energy with remote sensing data. Energy, 35(7), 2934–2938
Yue, C. D., Wang, S. S., 2006. GIS-based evaluation of multifarious local renewable energy sources: A case study of the Chigu area of southwestern Taiwan. Energy Policy, 34(6), 730– 742.