Photosynthetically active radiation heterogeneity within a
monodominant Congolese rain forest canopy
Lee A. Vierling
a,∗, Carol A. Wessman
baInstitute of Atmospheric Sciences, South Dakota School of Mines and Technology, 501 E. St. Joseph Street, Rapid City, SD 57701, USA bDepartment of Environmental, Population, and Organismic Biology and Cooperative Institute for Research in Environmental Sciences
(CIRES), University of Colorado, Boulder, CO 80309-0216, USA
Received 9 August 1999; received in revised form 16 February 2000; accepted 18 February 2000
Abstract
Photosynthetic photon flux density (PPFD) regimes within vegetation canopies are intrinsically heterogeneous in time and space. Photosynthesis responds to changes in the intensity and temporal variability of PPFD in a non-linear way. Therefore, it is important to quantify PPFD heterogeneity at short time scales in order to better understand and assess plant–atmosphere carbon exchange from the scale of the individual leaf to the entire canopy. Here, we report the intensity and temporal heterogeneity of sunflecks at three heights within a 42 m tall, monodominant Gilbertiodendron dewevrei tropical rain forest canopy in central Africa over a 12-day measurement period. Overall, sunflecks occurred during an average of 0.7% of the total sample time and contained 9.5% of the total recorded energy. These values ranged in magnitude with canopy height, as did the average intensity of PPFD contained in sunflecks. Probability distributions of sunfleck intensities were positively skewed at all three measurement heights. The temporal separation of sunflecks was bimodal at all three measurement heights; for example, at 3 m above ground level (AGL), 85% of all sunflecks were separated by either less than 30 s (43%) or more than 32 min (42%). Sunflecks were clustered in time such that 68, 84, and 89% of all sunflecks at respective heights of 3, 24, and 34 m AGL fell within clusters where no more than 2 min of non-sunfleck PPFD separated temporally adjacent sunflecks. This, plus the fact that a large percentage of the time within the clusters is comprised of sunfleck-level PPFD, indicates that sunfleck clusters are of great importance for photosynthesis within the canopy. We discuss the data from this site in the context of recent measurements and models of dynamic photosynthesis and present some possible implications for photosynthetic processes within a dense tropical forest canopy. © 2000 Elsevier Science B.V. All rights reserved.
Keywords: Gilbertiodendron dewevrei; Light; Monodominant forest; PAR; Photosynthetically active radiation; PPFD; Spatial autocorrelation; Sunflecks; Sunfleck clusters; Tropical rain forest canopy
1. Introduction
Photosynthetic photon flux density (PPFD; mmol
photosynthetically active photons m−2s−1) regimes within vegetation canopies are intrinsically heteroge-neous in time and space. Many plant ecophysiological
∗Corresponding author. Fax:+1-605-394-6061.
E-mail address: [email protected] (L.A. Vierling)
processes respond non-linearly to changes in the in-tensity and temporal variability of PPFD. Therefore, accurately characterizing PPFD heterogeneity is im-portant to predict rates of photosynthesis within a canopy (e.g. Norman, 1982, 1993; Baldocchi and Harley, 1995; de Pury and Farquhar, 1997; Pearcy et al., 1997; Kirschbaum et al., 1998). In addition, because some species are genotypically suited for specific light regimes, understanding heterogeneity of
the PPFD regime within canopies may be important for assessing vegetation regeneration, growth, and succession (e.g. Pearcy, 1983; Oberbauer et al., 1993; Canham et al., 1994; Watling et al., 1997).
Over the past decade, much effort has been made to quantify the time-course of foliar carbon gain and to describe the biochemical dynamics of fo-liar photosynthesis during rapidly fluctuating PPFD conditions (e.g. Pearcy et al., 1985; Chazdon and Pearcy, 1986a, b; Kirschbaum and Pearcy, 1988a, b; Tinoco-Ojanguren and Pearcy, 1992; Kursar and Coley, 1993; Sassenrath-Cole et al., 1994; Val-ladares et al., 1997; Zipperlen and Press, 1997). These investigations have led to the development of physiologically-based models of dynamic photosyn-thesis that are applicable to assessing foliar carbon gain within plant canopies (Gross et al., 1991; Pearcy et al., 1997; Kirschbaum et al., 1998). Coupling such dynamic photosynthesis models with empirical field measurements of PPFD heterogeneity within a canopy is necessary to evaluate the contribution of middle-and under-story leaves to whole-canopy carbon gain. Because foliar photosynthetic induction state and ra-diation use efficiency (RUE; moles of carbon assimi-lated per mole of incident photons) vary according to the frequency and duration of sunflecks (short-lived, bright patches of PPFD; e.g. Pearcy et al., 1985; Chazdon and Pearcy, 1986a, b; Sharkey et al., 1986; Kirschbaum and Pearcy, 1988a, b; Sassenrath-Cole and Pearcy, 1994), these field measurements must be temporally explicit with time scales on the order of seconds to minutes.
Many studies have investigated various aspects of PPFD heterogeneity within natural and agricultural canopies (see reviews by Chazdon, 1988; Pearcy, 1990; Baldocchi and Collineau, 1994), but few stud-ies quantify the temporal variability of sunflecks at a fine enough scale to use in concert with dynamic models of foliar photosynthesis. In one such compre-hensive study, Pearcy et al. (1990) reported frequency distributions of the duration of sunflecks, the time between sunflecks, and sunfleck intensity at various heights within a soybean canopy. For studies within tropical rain forests, high time resolution PPFD data have been limited to measurements near ground level (Pearcy, 1983; Valladares et al., 1997). In order to better assess the time course of carbon exchange for leaves occurring within forest canopies, additional
measurements of temporal sunfleck variability are required not only near the ground, but also at height within the canopy. Such measurements may provide insight into the actual contribution of within-canopy leaves to whole-canopy carbon exchange with the atmosphere over longer (hourly to daily) time scales. The main objective of this study is to characterize the intensity and temporal heterogeneity of sunflecks at three heights within a central African tropical rain forest canopy. The measurements were made within a naturally-occurring, monodominant forest canopy comprised almost wholly of the leguminous, ever-green species Gilbertiodendron dewevrei (De Wild.) Leonard (Caesalpiniaceae). We report the PPFD mea-surements in the context of leaf photosynthesis and leaf area index (LAI; leaf area per unit ground area) at these three heights in order to relate the PPFD regimes to leaf ecophysiology and canopy structure. The PPFD records are analyzed in a similar fashion to those re-ported by Pearcy et al. (1990) in order to characterize components of light heterogeneity known to be impor-tant to temporal photosynthetic dynamics, including sunfleck intensity, sunfleck duration (e.g. Chazdon and Pearcy, 1986b), and the duration of the low-light inter-vals between sunflecks (Sassenrath-Cole and Pearcy, 1994; Valladares et al., 1997). For example, periods where sunflecks are closely clustered together in time are compared to unclustered sunflecks to investigate how the canopy PPFD regime may affect dynamic properties of photosynthesis such as induction state (e.g. Chazdon and Pearcy, 1986a, b) and amounts of post-sunfleck CO2fixation (e.g. Sharkey et al., 1986). A subset of the results are further analyzed with re-spect to changes in the above-canopy sky diffuse frac-tion (SDF; diffuse PPFD/total PPFD) to investigate how varying cloud and haze cover affects PPFD het-erogeneity within this forest.
2. Materials and methods
2.1. Site characteristics
between 30 November and 11 December 1996 on the periphery of Nouabalé-Ndoki National Park (hereto-fore referred to as ‘Ndoki’), in the northern portion of the Republic of Congo, central Africa (2◦12′N, 16◦24′E, elevation ∼350 m). A detailed climatology of the Ndoki region is given by Fontan et al. (1992). Forests of the Ndoki region are representative of the African rain forest biorne in that they contain mixed-species stands (∼150–175 species per ha) oc-curring adjacent to monodominant stands formed by members of the Caesalpiniaceac (e.g. Gérard, 1960; White, 1983; Moutsamboté et al., 1994). In these monodominant forests, one species commonly makes up >80% of the stem basal area (Gérard, 1960; Hart et al., 1989; Hart, 1990); G. dewevrei comprises 85% of the stem basal area at the Ndoki field site (Vierling, 1999). The causes of the co-occurrence of these ex-tensive monodominant stands alongside mixed forests are as yet unclear; they likely persist due to unique and complex combinations of ecological factors in-cluding intense competition for light (see Hart et al., 1989; Torti, 1998).
2.2. Instrumentation and sample scheme
2.2.1. PPFD measurements
We measured PPFD simultaneously at three differ-ent vertical levels within the canopy to assess sun-fleck dynamics with increasing canopy depth. Single rope techniques were used (e.g. Perry and Williams, 1981) to place sensors high within the canopy and to minimize human disturbance of the canopy light regime. PPFD measures at each level were attained using custom-built ceptometers, each consisting of a 1.8 m linear array of gallium arsenide phosphide pho-todiodes (GaAsP; Model G 1118, Hamamatsu Corpo-ration, Hamamatsu City, Japan; Gutschick et al., 1985; Pearcy, 1989) spaced 6 cm apart. Prior to placement in the canopy, each photodiode was calibrated under sun-light against a quantum sensor (Model 190SA, Li-Cor Corporation, Lincoln, NE). Each sensor was leveled and individually wired to an analog relay multiplexer (Model AM416, Campbell Scientific, Inc., Logan, UT) strapped to a tree branch, which was in turn wired to a multiple-channel data logger (Model CR10X, Camp-bell Scientific, Inc.) on the ground. The top of the canopy reached an approximately uniform height of 42 m. The top and middle ceptometers each contained
30 GaAsP photodiodes and were placed at 34 and 24 m AGL, while the bottom ceptometer contained 29 sen-sors placed at the height of 3 m AGL. Each ceptome-ter was supported by an aluminum boom and placed such that there were no large branches in line with the solar path within 5 m of the ceptometer. The location and orientation of each ceptometer were changed once every∼3 days over the 12-day period to increase spa-tial coverage at the three canopy heights. In addition, we gathered PPFD measurements at 1 m AGL using a quantum sensor mounted atop a motorized tram trav-eling back and forth along a 20 m long cable at a rate of 1 cm s−1.
Readings from each of the 89 ceptometer sensors were recorded once every 1.5 s (0.67 Hz). This sam-ple rate was chosen for two principal reasons. First, 1.5 s provided sufficient time for the data acquisition system to reliably sample all sensors and avoid alias-ing. Second, results from previous empirical studies yielded insights on the appropriate sampling rate to use. In a soybean canopy sunflecks with a dura-tion ≤1.6 s accounted for only 6.7% of the sunfleck PPFD (Pearcy et al., 1990), while the mean sunfleck length near the floor of an Australian tropical rain forest canopy was 50 s (Pearcy, 1988). Therefore, we surmised that in this forest canopy the value of the information gained using a larger number of sensors and a 1.5 s sample rate was likely to outweigh the alternative of fewer sensors and more rapid sampling. Measurements were acquired and continuously down-loaded to a laptop computer between sunrise and sunset; during the 12-day sample period, 93% of the daytime periods were successfully sampled.
During the sample period, sky conditions varied from clear to heavily overcast. Measurements of to-tal and diffuse PPFD were acquired from the top of a 60 m tall tower situated approximately 700 m west of the canopy site using two quantum sensors mounted upon a stationary shadow band platform oriented so that one sensor was shaded throughout the day (after Horowitz, 1969). These above-canopy measurements provided a reference point for the within-canopy ob-servations.
2.2.2. Ancillary measurements
along the vertical profile. Upward-looking, nearly hemispherical photographs of the canopy were ac-quired during overcast skies to quantify both LAI and the relative annual variability of canopy openness along the solar path. Hemispherical photographs were acquired using a camera (Pentax K-1000) fitted with a combination of a 19 mm wide-angle lens (Vivitar, Inc.) and a fish-eye conversion lens (Pro-Optics, Inc.) to produce an effective focal length of 8 mm. Lens distortion was characterized in the laboratory prior to field deployment. Hemispherical photographs were taken at 1, 2, 4, 8, 12, 16, 20, 24, 28, 32, and 36 m AGL, as well as at points adjacent to each ceptometer location using panchromatic film (T-MAX, ASA100, Kodak). For each photo, care was taken to level the camera and align the image with true north.
In situ measurements of foliar photosynthesis were made on leaves occurring near the three ceptometers (at heights of 30, 20, and 1 m AGL, respectively) using a Li-Cor 6400 portable photosynthesis system. Pho-tosynthesis measurements are described in detail in Vierling (1999). We analyzed the relation between net photosynthesis and PPFD in order to discern the ap-proximate light saturation point (the point above which additional light caused no appreciable increase in car-bon gain) at each canopy level. While previous studies have used various criteria for classifying sunflecks (see Chazdon, 1988), choosing a sunfleck threshold value near the photosynthetic light saturation point is use-ful for studies of foliar carbon gain at leaf and canopy scales because it helps to separate the photosynthetic activity of leaves at unsaturating PPFD from those pe-riods when photosynthesis is PPFD-saturated (see ap-plication of this idea in the canopy modeling efforts by Sinclair et al., 1976; Norman, 1982; de Pury and Farquhar, 1997).
2.3. Data processing
We analyzed the within-canopy PPFD measure-ments using a modified version of thebasicprogram
‘HISTO’ (R.W. Pearcy, unpublished work). Each raw PPFD data file was processed with respect to the sunfleck threshold value for the given layer. From each raw data file, the program calculates the total PPFD, the proportion of total PPFD contained within sunflecks, the peak and average intensities of PPFD during sunflecks, the duration of sunflecks, and the
time elapsed since the last sunfleck for each sensor. We calculated the probability distributions of all sun-fleck variables in order to assess the character of the PPFD heterogeneity within the canopy. In addition, we grouped the sunflecks into ‘clusters’ by evaluating the length of the low-light periods between the flecks and grouping those that occurred within a given time interval of one another into the same cluster (after Pearcy et al., 1990). We separately characterized clusters defined as two or more sunflecks contain-ing arbitrarily chosen low-light interval thresholds (LLITs) between them of no more than 1.5, 3, 4.5, 6, 7.5, 9, 15, 30, 45, 60, 90 and 120 s.
We calculated the spatial autocorrelation of the within-canopy PPFD data irrespective of sunfleck thresholds. These calculations were performed with an Interactive Data Language (IDL) computer routine (R.E. Kennedy, unpublished work) using algorithms presented by Isaaks and Srivastava (1989). Autocorre-lation calcuAutocorre-lations were performed for periods during which the sky diffuse fraction (SDF; diffuse PPFD above canopy/total PPFD above canopy) remained stable within the range classes of:<0.5 (mostly clear),
0.5–0.59, 0.6–0.69, 0.7–0.79, 0.8–0.89, 0.9–0.95, and >0.95 (overcast).
LAI was estimated using a multiple step digital anal-ysis of the hemispherical photographs. Using standard image processing software (ENVI; Research Systems, Inc.), we first masked obvious tree trunk and branch portions of the photograph, and then calculated the total gap fraction (i.e. open sky pixels/total pixels) in the unmasked portions of 10◦wide annular rings. These gap data were then input to a gap fraction radia-tive transfer inversion model (Norman and Campbell, 1989) to calculate LAI. Only the annular rings extend-ing to a zenith angle of 60◦ in the photograph were utilized in order to preclude possible errors associ-ated with transmission data from larger (near-horizon) zenith angles (after Chason et al., 1991).
with actual measurements of sunfleck activity using photodiodes (Chazdon and Field, 1987).
3. Results
3.1. PAR transmission, vertical LAI profile, and foliar photosynthesis
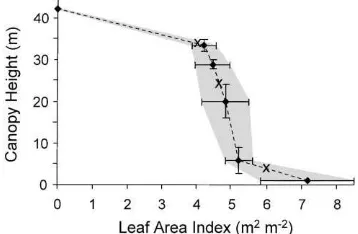
Photosynthetically active radiation (PAR) is highly depleted by the dense, continuous overstory foliage characteristic of monodominant G. dewevrei canopies (Louis, 1947). On a mostly clear day (Julian Day 345, 10 December 1996), the PPFD incident upon the three ceptometers registered 5.1, 5.1, and 2.0% of above-canopy PPFD at 34, 24, and 3 m AGL, respec-tively (Table 1). The low transmission of PAR even at the level of the top ceptometer directly relates to the fact that more than half of the G. dewevrei canopy LAI is contained in the upper 20% of the canopy height (Fig. 1). Thus, LAI≈4 even at the topmost ceptome-ter placement of 34 m AGL. The mean total LAI at the site, derived from five hemispherical photographs acquired at 1 m AGL, was 7.2. Over the entire 12-day measurement period, there was an average transmis-sion of only 1.2% to a canopy height of 1 m AGL. As a result, light-demanding lianas are sparse within the canopy except near forest gaps.
Rates of steady state net photosynthesis de-creased with increasing LAI depth, with average PPFD-saturated CO2 fixation rates of approximately 4.5, 3.5, and 1.5mmol CO2m−2s−1at heights of 30, 20, and 1.5 m, respectively (see Vierling, 1999). The point at which photosynthesis saturated with respect
Table 1
PPFD values above and at three levels within the Gilbertiodendron dewevrei forest canopy on a mostly clear day (Julian Day 345; 10 December 1996)a
Canopy height Energy received (mol Transmission % (m AGL) photons m−2 per day)
Above canopy 31.7 100
34 1.62 (0.16) 5.1
24 1.63 (0.29) 5.1
3 0.63 (0.06) 2.0
aMeasurements were successfully recorded during 98.6% of
the time between sunrise and sunset on this day. Values within parentheses represent standard deviations from the mean.
Fig. 1. Vertical distribution of LAI in G. dewevrei canopy. Cep-tometer placement heights within the canopy are denoted by the letter ‘X’. Frror bars depict one standard deviation of the mea-surements; the shaded zone shows the LAI range falling within one standard deviation as interpolated through the canopy.
to PPFD also varied with canopy height. By evaluat-ing the average photosynthetic light saturation points near the height of each ceptometer, we assigned sun-fleck PPFD threshold values to be 200mmol photons
m−2s−1 at the top and middle levels and 100mmol
photons m−2s−1in at the bottom level.
3.2. PPFD heterogeneity
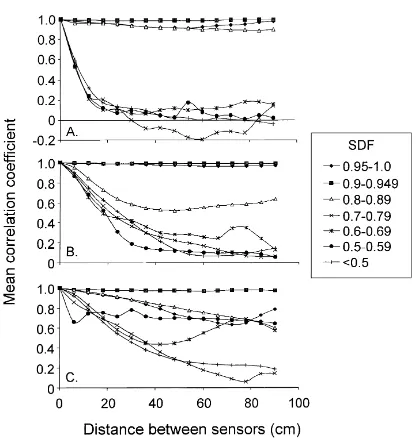
PPFD was very heterogeneous within the canopy over both the course of a day (Fig. 2) and over the course of the 12-day sample period. Autocorrelation calculations reveal that the spatial PPFD heterogene-ity within this canopy varied with respect to both sky diffuse fraction and canopy depth (Fig. 3). At 34 m AGL, there was a distinct difference between the spatial correlation of sensor measurements dur-ing times characterized by higher SDF (≥0.8) and those during low SDF (<0.8; Fig. 3A). While under
high SDF conditions the PPFD measurements at 34 m AGL remained highly correlated across a 90 cm sen-sor separation distance, during clearer skies the mean correlation coefficient dropped to 0.1–0.2 for sensors spaced only 18 cm apart. In general, the mean spatial correlation coefficients did not decrease as abruptly in the lower portion of the canopy compared to higher within the canopy (Fig. 3A–C).
Fig. 2. Daily tracks of PPFD above the canopy and at the three measurement heights within the canopy on 10 December 1996, a mostly sunny day. Plots at each level within the canopy show data from three arbitrarily chosen sensors positioned at 60 cm intervals along each ceptometer.
Fig. 3. Spatial auto-correlation of PPFD measurements with respect to sky diffuse fraction at (A) 34 m; (B) 24 m; and (C) 3 m AGL within the G. dewevrei canopy. Sensors were spaced 6 cm apart at each canopy height.
at each measurement height was comparable to that expected during other times of the year (Fig. 4). Of particular note is that at 24 m AGL, daily irradiance is relatively high when the sun tracks through the southern sky (including during the measurement time period), and then reaches relative minima during pe-riods when the sun tracks across the northern sky. This is due to the impact of a tree fall gap approxi-mately 100 m SW of the measurement location on the afternoon radiation regime at 24 m AGL.
Fig. 4. Annual course of irradiance reaching each of the three canopy layers. Values at each layer are scaled such that the max-imum value during the year equals 1. The open symbols denote the estimated daily irradiance at the midpoint of the 12-day sam-ple period. Dashed lines represent 2nd degree polynomial fits to the data.
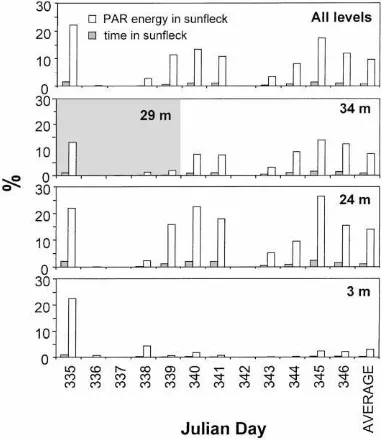
Fig. 5. Percent time and percent energy represented by sunflecks during the field experiment. ‘Average’ column is the average for all days at each level, with the exception of the ceptometer at 34 m, which was positioned below a tree branch at 29 m during the first 5 days of measurements (denoted by shading). The ‘Average’ column at 34 m shows the average of all days after Julian Day 339.
Fig. 6. Frequency distributions of (a) average PPFD and (b) peak PPFD reached within sunflecks at each of the three canopy heights. Numbers of sunflecks at each level denoted in figure legends. Insets show the low end (i.e. 100–200mmol photons m−2s−1) of the frequency distribution at 3 m in more detail.
2.4% of the time and 26% of the energy on Julian Day 345, while at the bottom ceptometer sunfleck activity ranged from zero to maxima of 0.9% of the time and 22% of the total PPFD on Julian Day 335.
The average PPFD contained in sunflecks also var-ied with canopy height (Fig. 6a). At 3 m AGL, 94% of all sunflecks contained an average PPFD between 100 and 200mmol m−2s−1. At 24 and 34 m (where PPFD
values below 200mmol m−2s−1 were not classified
as sunflecks), 45 and 52% of all sunflecks contained average PPFDs between 200 and 225mmol m−2s−1.
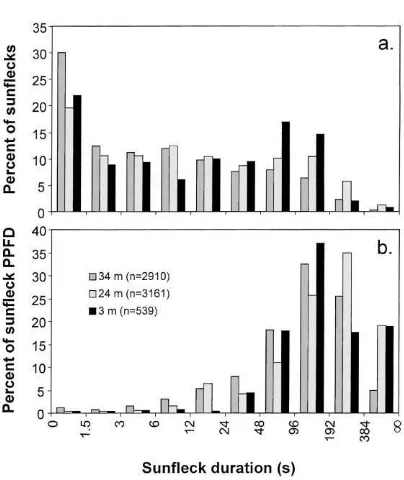
Fig. 7. Frequency distributions of sunfleck characteristics deter-mined from 30 sensors placed at 34 and 24 m AGL, and 29 sensors placed at 3 m AGL in a Gilbertiodendron dewevrei forest from the period 30 November–11 December 1996.
of sunflecks, respectively, peaked between 200 and 225mmol m−2s−1.
A greater percentage of sunflecks comprised longer duration classes with increasing canopy depth (Fig. 7a). While these data suggest that a large fraction of all sunflecks are short in duration, these short sunflecks, in sum, deliver a small proportion of total sunfleck PPFD to the forest understory (Fig. 7b). For example, at 34 m AGL sunflecks equal to or shorter than 12 s in duration accounted for only 6.4% of the total sunfleck PPFD, while those longer than 48 s accounted for 81%.
Fig. 8. Histograms depicting three time scales of the low-light period occurring prior to sunflecks at three levels within the G. dewevrei canopy.
In addition to sunfleck duration, the duration of the low-light interval between sunflecks can also substan-tially affect foliar carbon gain via mediation of the photosynthetic induction state of a leaf (Kirschbaum and Pearcy, 1988a; Sassenrath-Cole and Pearcy, 1994; Valladares et al., 1997). Histograms depicting the time between sunflecks in the G. dewevrei canopy show that sunflecks mostly occur either quite close to one an-other or are spaced out over long time periods (Fig. 8). The bimodal character of these data becomes more pronounced with depth in the canopy.
At levels higher in the canopy, progressively larger proportions of all sunflecks form clusters (Fig. 9a). The percentage of sunflecks contained within clus-ters reaches a plateau between the low-light interval thresholds (LLITs) of 15 and 30 s (Fig. 9a). To assess how efficiently leaves might utilize light within these sunfleck clusters for photosynthesis, we calculated the amount of time within each cluster that occurred as sunfleck. For all three layers, the mean amount of clus-ter time as sunfleck was quite high (∼97%) with an LLIT of 1.5 s (Fig. 9b). In general, at LLITs longer than 30 s, then the higher in the canopy, the less the time within each cluster is comprised of sunfleck. The mean duration of clusters defined by various LLITs is depicted in Fig. 9c.
Fig. 9. Plots of (a) the percentage of all sunflecks falling within sunfleck clusters; (b) the percentage of cluster time that is repre-sented by sunflecks; and (c) the mean cluster duration, each with respect to the maximum duration of the low-light interval between sunflecks used to group sunflecks into clusters. All measurements were made from 30 November–11 December 1996.
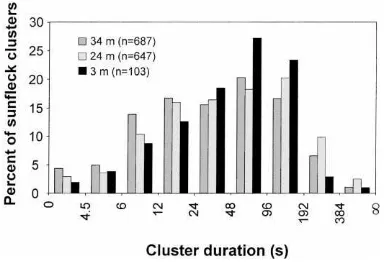
Fig. 10. Histogram of sunfleck cluster duration within the G. dewevrei canopy. A low light interval threshold (LLIT) of 4.5 s was used to define the clusters for which statistics are presented here.
three canopy heights there were more raw sunflecks of 1.5 s in duration than in any other duration class (Fig. 7a). Maximum frequencies for sunfleck clusters defined by an LLIT of only 4.5 s, however, occur at the 48–96 s class at the top and bottom ceptometer placements and at the 96–192 s class at the middle ceptometer (Fig. 10). The fact that this large shift in the frequency distribution occurs even at short LLIT durations (where, in the case of this example, with an LLIT of 4.5 s sunflecks comprise ∼95% of the cluster time; see Fig. 9b) suggests that the clustered occurrence of sunflecks is likely to significantly affect carbon gain within the canopy.
4. Discussion
4.1. Forest structure, available sunlight and sunfleck intensity
similar heights in other, mixed species tropical forests. The dense, continuous overstory formed by G. dew-evrei may play a role in the ability of this species to form monodominant forests.
The similar daily integrated amount of PAR re-ceived by the upper two ceptometers (Table 1), along with results of hemispherical photo and sunfleck anal-yses, provides additional insight as to how the struc-ture of the G. dewevrei forest affects the within-canopy PPFD regime. Although slightly more leaf area occurs above 24 m than above 34 m (Fig. 1), a tree fall gap approximately 100 m SW of the sample site allowed more PAR transmission to the 24 m level than to the 34 m level during the afternoon due to sun/gap/sensor geometry. The fact that the greatest percentages of time and energy represented by sunflecks occurred at 24 m AGL (Fig. 5) supports this idea. Frequency distri-butions of sunfleck intensity show that 24 m was also the level with the highest relative percentage of sun-flecks averaging and peaking above 450mmol m−2s−1
(Fig. 6); many of these high-intensity sunflecks oc-curred during sunny afternoon periods. Torquebiau (1988) reported similar effects of canopy structure on the vertical PAR gradient. The apparent ‘inversion’ of the PAR regime between the two upper layers in that Dipterocarp forest, whereby the deeper canopy level (at 65% of the canopy height) received higher daily in-tegrated PPFDs than the higher sensor (at 81% canopy height), was likely due to gaps at high zenith angles occurring between upper forest layer emergents.
The frequency distributions of sunfleck intensity at all three levels within the G. dewevrei canopy resem-ble those measured at other tropical rain forest un-derstory sites in that they are positively skewed (Fig. 6; Yoda, 1978; Pearcy, 1983; Chazdon and Fetcher, 1984; Chazdon, 1986; Chazdon et al., 1988; see also Baldocchi and Collineau, 1994). This, together with the fact that sunflecks at all three levels in this tall canopy contain small proportions of the above canopy PPFD (data not shown), indicate the strong influence of penumbra on the sunfleck regime. In contrast, sun-flecks in short canopies with large leaves relative to the size of the solar disk (i.e. crop canopies) possess PPFDs close to full sunlight (Pearcy et al., 1990).
The fact that the mean spatial correlation coeffi-cients do not decrease over distance as abruptly in the lower portion of the canopy compared to higher within the canopy (Fig. 3A–C) suggests that the PPFD regime
becomes more spatially homogeneous with increasing depth in this understory. This result is likely to arise from the increase of penumbral influences with depth in the canopy, because the spatial delineation between sunflecks and diffuse light becomes more ‘smeared’ with depth (Baldocchi, 1989). In addition, the trajec-tory of the mean spatial correlation coefficient became more decoupled from the SDF at greater canopy depth (Fig. 3). Therefore, deeper within the canopy, forest structure (i.e. canopy gap arrangement) likely plays an increasingly greater role than does sky clarity (par-ticularly during periods characterized by intermediate SDF) in influencing PPFD heterogeneity.
4.2. Temporal aspects of sunflecks and sunfleck clusters
The frequency distribution of sunfleck duration (Fig. 7a) is in relative agreement at all three canopy heights with that reported near the ground in a 10–20 m tall Hawaiian mixed evergreen forest (Pearcy, 1983). Pearcy (1983) determined that two-thirds of all sun-flecks (defined in his study as those measurements with a PPFD greater than 150mmol photons m−2s−1)
lasted less than 30 s and very few lasted longer than 5 min. The duration of the low-light interval between sunflecks, however, is markedly different between these two canopies. While in the Hawaiian forest only about 5% of the sunflecks were separated by longer than 16 min (Pearcy, 1983), in the present study up to 46% of the sunflecks were separated by at least this much time (Fig. 8c). The results at Ndoki agree more closely to findings by Valladares et al. (1997), who report that an average of 26.4% of the low-light in-tervals between sunflecks last longer than 4 min near the floor of a rain forest canopy on Barro Colorado Island, Panama (compared to 26% lasting longer than 4 min at 34 m, 33% at 24 m, and 53% at 3 m AGL at Ndoki). The sunfleck definition threshold used by Valladares et al. (1997), however, was 50mmol
With short time intervals between sunflecks, the mean time-integral of PPFD is likely to remain high, allowing understory leaves to maintain an elevated state of foliar photosynthetic induction. In their study, Valladares et al. (1997) found that more than 90% of the photosynthetic induction state remains after 120 s of low light following a sunfleck. Thus, carbon gain during clusters of sunflecks is likely to be similar to that during single sunflecks. The cluster characteris-tics calculated for Ndoki also support this notion be-cause even with a cluster low-light interval threshold (LLIT) of 120 s, the longest considered in this study, the mean fraction of cluster time represented by sun-flecks was 70, 79, and 82% at 34, 24, and 3 m AGL (Fig. 9b). In comparison, the mean fraction of clus-ter time represented by sunflecks in a soybean canopy with a cluster LLIT of only 2 s was 65% (Pearcy et al., 1990). These high sunfleck: cluster time propor-tions, as well as the fact that penumbra in this canopy cause more gradual changes of PPFD through time compared to the rapid full sun/full shade interplay of light in canopies with few penumbral effects (Pearcy et al., 1990), suggest that between clustered sunflecks the PPFD is likely to remain at levels nearer to sun-fleck PPFD values than to the PPFD of background diffuse light. This is of consequence for foliar carbon gain because the higher the PPFD during low-light intervals between sunflecks, the greater the mainte-nance of photosynthetic induction state (Chazdon and Pearcy, 1986b; Sassenrath-Cole and Pearcy, 1994).
4.3. Implications for ecophysiology from leaf to canopy scales
The ability of plants to utilize sunflecks for pho-tosynthesis depends on the intensity and temporal frequency of sunflecks due to the non-linear and hysteretic character of photosynthetic ecophysiology. Because of the great complexity of foliar carbon gain in spatially and temporally heterogeneous PPFD en-vironments, canopy photosynthesis models typically rely upon simplified characterizations of the rela-tionship between photosynthesis and PPFD. These simplifications fall into two categories. The first deals with the non-linearity of photosynthesis in response to light intensity. Many published canopy photosynthe-sis models now include radiative transfer subroutines that separate the components of direct (i.e. sunfleck;
photosynthetically saturating) and diffuse (unsaturat-ing) PPFD at arbitrary levels throughout the canopy (e.g. Norman, 1982; Baldocchi and Harley, 1995; Le-uning et al., 1995; de Pury and Farquhar, 1997) and calculate the net carbon assimilation during these two light classes separately. This approach minimizes the overestimation of canopy-level photosynthesis that often occurs when average PPFDs within the canopy are applied to the non-linear response function of photosynthesis (Norman, 1993). The second model simplification deals with the response of leaves to tem-poral PPFD heterogeneity. While two state-of-the-art temporally dynamic models describing photosyn-thetic fluctuations at the leaf level have recently been published (Pearcy et al., 1997; Kirschbaum et al., 1998), much work remains to scale these dynamic models to the canopy level. A vital yet difficult step in accomplishing this scaling task lies in accurately characterizing the probability distributions of tempo-ral sunfleck activity at various layers in the canopy. To our knowledge, no canopy photosynthesis models presently include such a routine.
et al., 1985; Chazdon and Pearcy, 1986b; Kirschbaum and Pearcy, 1988a; Valladares et al., 1997). Uninduced leaves, however, have been found to possess signifi-cantly lower SUEs than steady state predictions, even for sunflecks lasting up to 80 s (Valladares et al., 1997). Because understory leaves possess various states of photosynthetic induction and experience disparate sunfleck regimes over the course of a day, a relevant question with regard to the impact of dynamic under-story carbon gain on temporally static canopy scale photosynthesis models is: do the conditions favoring high SUE (i.e. relatively high induction state and sun-flecks <10 s in duration) significantly outweigh/fall
short of the conditions favoring low SUE when inte-grated for all understory leaves over the course of a day? In other words, does the integrated daily SUE within a vegetation canopy significantly depart from the steady state assumption whereby SUE=100%?
The results from Ndoki provide some insight on this question. First, approximately half of the sun-flecks occurring at all three canopy heights were sep-arated by a low-light interval less than 30 s in length (Fig. 8c). Thus, the induction loss between these sun-flecks would likely be minimal (see Sassenrath-Cole and Pearcy, 1994; Valladares et al., 1997). However, because a substantial proportion of sunflecks were also separated by low-light intervals greater than 32 min long (particularly at 3 m AGL), it is likely that many leaves in the understory possess low induction states for much of the day.
Whether these partially induced leaves are able to photosynthesize at rates significantly higher than the steady-state predicted SUE of 100% depends largely on the duration of the sunfleck. Valladares et al. (1997) found that fully-induced understory leaves exhibited SUEs near 100% during 20 s and longer sunflecks, while uninduced leaf SUEs ranged between 50–60% for a 20 s sunfleck. While we found that 54–73% of all sunflecks were shorter than 20 s in duration, a high percentage of these sunflecks were clustered closely in time. Therefore, the actual photosynthetic SUE likely depends upon the duration of these clusters. Clus-ters can possess high time-averaged PPFDs for much longer periods than do individual sunflecks.
Few studies have quantified the influence of heterogeneous PAR regimes on foliar photosynthesis and how estimates of predicted carbon gain assuming steady state photosynthesis differs from actual,
dynamic carbon gain. In one laboratory study, Pearcy et al. (1997) found that by assuming steady state pho-tosynthesis, actual carbon gain was overestimated by 11.5–24.4% for induced shade leaves of the Australian rain forest understory species Alocasia macrorrhiza. For uninduced leaves, the steady state model over-estimated carbon gain by 38.1–50.8% (Pearcy et al., 1997). Similar experiments using leaves and canopy light regimes for soybeans failed to yield a signif-icant difference between the actual carbon gained and that predicted using a steady state model (Pearcy et al., 1997). In a field investigation, Pfitsch and Pearcy (1989) studied the carbon gain of the redwood forest understory plant Adenocaulon bicolor and found that on sunny days the measured carbon gain was 20–30% less than that predicted using a steady state photo-synthesis model under the measured sunfleck regime at the microsite. This suggests that limitations due to low photosynthetic induction state may outweigh the enhancement of carbon gained due to post-sun fleck CO2 fixation for that plant. At the canopy scale, re-cent comparisons of a canopy CO2 exchange model lacking a temporally dynamic component of photo-synthesis with tower flux data show that the model performs quite well under a broad range of weather conditions for a temperate mixed forest (Baldocchi and Harley, 1995; Baldocchi, 1997), suggesting that the omission of a temporally dynamic description of within-canopy photosynthesis does not bias the model in that ecosystem. Additional model/tower comparisons in other vegetation types are necessary to understand the influences of temporally dynamic photosynthesis on canopy–atmosphere CO2exchange.
Acknowledgements
Society provided invaluable logistical support to en-able the work at Ndoki. W. Bradley, R. Chazdon, J. Fox, R. Hendershot, and R. Pearcy all helped in de-veloping the field instrumentation. C. Crandall ably assisted with manuscript preparation. This project was made possible through funding from NSF Research Training Grant BIR-9413218, Sigma Xi, University of Colorado Grant programs, and EPA STAR Graduate Fellowship U-915021-01-0.
References
Baldocchi, D.D., 1989. Turbulent transfer in a deciduous forest Tree Physiol. 5, 357–377.
Baldocchi, D.D., 1997. Measuring and modelling carbon dioxide and water vapour exchange over a temperate broad-leaved forest during the 1995 summer drought. Plant, Cell Environ. 20, 1108–1122.
Baldocchi, D.D., Collineau, S., 1994. The physical nature of solar radiation in heterogeneous canopies: spatial and temporal attributes. In: Caldwell, M.M., Pearcy, R.W. (Eds.), Exploitation of Environmental Heterogeneity by Plants. Academic Press, San Diego, CA, pp. 21–71.
Baldocchi, D.D., Harley, P.C., 1995. Scaling carbon dioxide and water vapour exchange from leaf to canopy in a deciduous forest. II. Model testing and application. Plant, Cell Environ. 18, 1157–1173.
Canham, C.D., Finzi, A.C., Pacala, S.W., Burbank, D.H., 1994. Causes and consequences of resource heterogeneity in forests: interspecific variation in light transmission by canopy trees. Can. J. For. Res. 24, 337–349.
Chason, I.W., Baldocchi, D.D., Huston, M.A., 1991. A comparison of direct and indirect methods for estimating forest canopy leaf area. Agric. For. Meteorol. 57, 107–128.
Chazdon, R.L., 1986. Light variation and carbon gain in rain forest understorey palms. J. Ecol. 74, 995–1012.
Chazdon, R.L., 1988. Sunflecks and their importance to forest understorey plants. Adv. Ecol. Res. 18, 1–63.
Chazdon, R.L., Fetcher, N., 1984. Photosynthetic light environments in a lowland tropical rain forest in Costa Rica. J. Ecol. 72, 553–564.
Chazdon, R.L., Field, C.B., 1987. Photographic estimation of photosynthetically active radiation: evaluation of a computerized technique. Oecologia 73, 525–532.
Chazdon, R.L., Pearcy, R.W., 1986a. Photosynthetic responses to light variation in rainforest species. I. Induction under constant and fluctuating light conditions. Oecologia 69, 517–523. Chazdon, R.L., Pearcy, R.W., 1986b. Photosynthetic responses
to light variation in rainforest species. II. Carbon gain and photosynthetic efficiency during lightflecks. Oecologia 69, 524–531.
Chazdon, R.L., Williams, K., Field, C.B., 1988. Interactions between crown structure and light environment in five rain forest Piper species. Am. J. Bot. 75 (10), 1459–1471.
Delmas, R., Druilhet, A., Cros, B., Durand, P., Delon, C., Lacaux, J.P., Brustet, J.M., Serca, D., Guenther, A., Greenberg, J., Baugh, W., Harley, P., Klinger, L., Ginoux, P., Brasseur, G., Zimmerman, P., Gregoire, J.M., Janodet, E., Tournier, A., Perros, P., Marion, T., Gaudichet, L., Cachier, H., Ruellan, S., Masclet, P., Cautenet, S., Poulet, D., Bouka-Biona, C., Nganga, D., Tathy, J.P., Minga, A., Loemba-Ndembi, J., 1999. Experiment for regional sources and sinks of oxidants (EXPRESSO): an overview. J. Geophys. Res. 104 (33), 30609–30624.
de Pury, D.G.G., Farquhar, G.D., 1997. Simple scaling of photosynthesis from leaves to canopies without the errors of big-leaf models. Plant, Cell Environ. 20 (5), 537–557. Fontan, J., Druilhet, A., Benech, B., Lyra, R., Cros, B., 1992. The
DECAFE experiments: overview and meteorology. J. Geophys. Res. 97, 6123–6136.
Gérard, P., 1960. Étude écologique de la forêt dense à Gilbertiodendron dewevrei dans la region de l’Uelé. Publications de l’institut national pour l’etude agronomique du Congo, Sér. Sci., 87, Brussells.
Gross, L.J., Kirschbaum, M.U.F., Pearcy, R.W., 1991. A dynamic model of photosynthesis in varying light taking account of stomatal conductance, C3-cycle intermediates, photorespiration and RuBisCO activation. Plant, Cell Environ. 14, 881–893. Gutschick, V.P., Barron, M.H., Waechter, D.A., Wolf, M.A., 1985.
Portable monitor for solar radiation that accumulates irradiance histograms for 32 leaf-mounted sensors. Agric. For. Meteorol. 33, 281–290.
Hart, T.B., 1990. Monospecific dominance in tropical rain forests. Trends Ecol. Evol. 5, 6–11.
Hart, T.B., Hart, J.A., Murphy, P.B., 1989. Monodominant and species-rich forests of the humid tropics: causes for their co-occurrence. The Am. Naturalist 133, 613–633.
Horowitz, J.L., 1969. An easily constructed shadow-band for separating direct and diffuse solar radiation. Solar Energy 12, 543–545.
Isaaks, E.H., Srivastava, R.M., 1989. Applied Geostatistics. Oxford University Press, New York.
Kirschbaum, M.U.F., Pearcy, R.W., 1988a. Gas exchange analysis of the fast phase of photosynthetic induction in Alocasia macrorrhiza. Plant Physiol. 87, 818–821.
Kirschbaum, M.U.F., Pearcy, R.W., 1988b. Concurrent measurements of oxygen and carbon dioxide exchange during lightflecks in Alocasia macrorrhiza (L.) G. Don. Planta 174, 527–533.
Kirschbaum, M.U.F., Kuppers, M., Schneider, H., Giersch, C., Noe, S., 1998. Modelling photosynthesis in fluctuating light with inclusion of stomatal conductance, biochemical activation and pools of key photosynthetic intermediates. Planta 204, 16–26. Kursar, T.A., Coley, P.D., 1993. Photosynthetic induction times in shade-tolerant species with long and short-lived leaves. Oecologia 93, 165–170.
Leuning, R., Kelliher, F.M., De Pury, D.G.G., Schulze, E.-D., 1995. Leaf nitrogen, photosynthesis, conductance and transpiration: scaling from leaves to canopies. Plant, Cell Environ. 8, 1183–1200.
Yangambi, Deuxieme Partie. Institut national pour l’étude agronomique du Congo Beige, Brussells, pp. 902–915. Moutsamboté, J.-M., Yumoto, T., Mitani, M., Nishihara, T., Suzuki,
S., Kuroda, S., 1994. Vegetation and list of plant species identified in the Nouabalé-Ndoki forest, Congo. Tropics 3, 277– 293.
Norman, J.M., 1982. Simulation of microclimates. In: Hatfield, J.L., Thomason, I.J. (Eds.), Biometeorology in Integrated Pest Management. Academic Press, New York, pp. 65–99. Norman, J.M., 1993. Scaling processes between leaf and
canopy levels. In: Ehlringer, J.R., Field, C.B. (Eds.), Scaling Physiological Processes: Leaf to Globe. Academic Press, New York, pp. 41–76.
Norman, J.M., Campbell, G.S., 1989. Canopy structure. In: Pearcy, R.W., Ehlringer, J., Mooney, H.A., Rundel, P.W. (Eds.), Plant Physiological Ecology: Field Methods and Instrumentation. Chapman & Hall, London, pp. 301–325.
Oberbauer, S.F., Clark, D.B., Clark, D.A., Rich, P.M., Vega, G., 1993. Light environment, gas exchange, and annual growth of saplings of three species of rain forest trees in Costa Rica. J. Trop. Ecol. 9, 511–523.
Pearcy, R.W., 1983. The light environment and growth of C3 and C4 tree species in the understory of a Hawaiian forest. Oecologia 58, 19–25.
Pearcy, R.W., 1988. Photosynthetic utilisation of lightflecks by understory plants. Aust. J. Plant Physiol. 15, 223–238. Pearcy, R.W., 1989. Radiation and light measurements. In: Pearcy,
R.W., Ehlringer, J., Mooney, H.A., Rundel, P.W. (Eds.), Plant Physiological Ecology: Field Methods and Instrumentation. Chapman & Hall, London, pp. 97–116.
Pearcy, R.W., 1990. Sunflecks and photosynthesis in plant cano-pies. Annu. Rev. Plant Physiol. Plant Mol. Biol. 41, 421–453. Pearcy, R.W., Osteryoung, K., Calkin, H.W., 1985. Photosynthetic responses to dynamic light environments by Hawaiian trees. Plant Physiol. 79, 896–902.
Pearcy, R.W., Gross, L.J., He, D., 1997. An improved dynamic model of photosynthesis for estimation of carbon gain in sunfleck light regimes. Plant, Cell Environ. 20, 411–424. Pearcy, R.W., Roden, J.S., Gamon, J.A., 1990. Sunfleck dynamics
in relation to canopy structure in a soybean (Glycine max (L.) Merr.) canopy. Agric. For. Meteorol. 52, 359–372.
Perry, D.R., Williams, J., 1981. The tropical rainforest canopy: a method providing total access. Biotropica 13 (4), 283–285. Pfitsch, W.A., Pearcy, R.W., 1989. Daily carbon gain by
Adenocaulon bicolor (Asteraceae), a redwood forest understory
herb, in relation to its light environment. Oecologia 80, 465–470.
Sassenrath-Cole, G.F., Pearcy, R.W., 1994. Regulation of photosynthetic induction state by the magnitude and duration of low light exposure. Plant Physiol. 105, 1115–1123. Sassenrath-Cole, G.F., Pearcy, R.W., Steinmaus, S., 1994. The role
of enzyme activation state in limiting carbon assimilation under variable light conditions. Photosynthesis Res. 41, 295–302. Sharkey, T.D., Seemann, J.R., Pearcy, R.W., 1986. Contribution
of metabolites of photosynthesis to post illumination CO2
assimilation in response to lightflecks. Plant Physiol. 82, 1063–1068.
Sinclair, T.R., Murphy, C.E., Knoerr, K.R., 1976. Development and evaluation of simplified models for simulating canopy photosynthesis and transpiration. J. Appl. Ecol. 13, 813– 829.
Tinoco-Ojanguren, C., Pearcy, R.W., 1992. Dynamic stomatal behavior and its rote in carbon gain during lightflecks of a gap phase and an understory Piper species acclimated to high and low light. Oecologia 92, 222–228.
Torquebiau, E.F., 1988. Photosynthetically active radiation environment, patch dynamics and architecture in a tropical rainforest in Sumatra. Aust. J. Plant Physiol. 15, 327–342. Torti, S.D., 1998. Causes and consequences of tropical
monodominance. Ph.D. Dissertation, University of Utah, Salt Lake City, UT.
Valladares, F., Allen, M.T., Pearcy, R.W., 1997. Photosynthetic responses to dynamic light under field conditions in six tropical rainforest shrubs occurring along a light gradient. Oecologia 111, 505–514.
Vierling, L.A., 1999. Light heterogeneity and gas exchange dynamics above and within a monodominant Congolese rain forest canopy. Ph.D. Dissertation, University of Colorado, Boulder, CO.
Watling, J.R., Ball, M.C., Woodrow, I.E., 1997. The utilization of lightflecks for growth in four Australian rain-forest species. Funct. Ecol. 11, 231–239.
White, F., 1983. UNESCO/AETFAT/UNSO Vegetation map of Africa. Descriptive memoir and map. UNESCO, Paris. Yoda, K., 1978. Three-dimensional distribution of light intensity
in a tropical rain forest of West Malaysia. Malaysia Nature J. 30 (2), 161–177.