POINT CLOUD ANALYSIS FOR UAV-BORNE LASER SCANNING WITH
HORIZONTALLY AND VERTICALLY ORIENTED LINE SCANNERS – CONCEPT AND
FIRST RESULTS
M. Weinmann∗, M. S. M¨uller, M. Hillemann, N. Reydel, S. Hinz, B. Jutzi
Institute of Photogrammetry and Remote Sensing, Karlsruhe Institute of Technology (KIT) Englerstr. 7, D-76131 Karlsruhe, Germany
(martin.weinmann, markus.mueller5, markus.hillemann, stefan.hinz, boris.jutzi)@kit.edu, [email protected]
Commission II, WG II/4
KEY WORDS:Unmanned Aerial System, Laser Scanning, Multi-Sensor, Point Cloud, Feature Extraction, Scene Interpretation
ABSTRACT:
In this paper, we focus on UAV-borne laser scanning with the objective of densely sampling object surfaces in the local surrounding of the UAV. In this regard, using a line scanner which scans along the vertical direction and perpendicular to the flight direction results in a point cloud with low point density if the UAV moves fast. Using a line scanner which scans along the horizontal direction only delivers data corresponding to the altitude of the UAV and thus a low scene coverage. For these reasons, we present a concept and a system for UAV-borne laser scanning using multiple line scanners. Our system consists of a quadcopter equipped with horizontally and vertically oriented line scanners. We demonstrate the capabilities of our system by presenting first results obtained for a flight within an outdoor scene. Thereby, we use a downsampling of the original point cloud and different neighborhood types to extract fundamental geometric features which in turn can be used for scene interpretation with respect to linear, planar or volumetric structures.
1. INTRODUCTION
The acquisition, processing and interpretation of point cloud data are of great importance for various applications in photogramme-try, remote sensing and computer vision. Exemplary applications include, but are not limited to
• the modeling and analysis of urban scenes, e.g. in terms of 3D city modeling (Lafarge and Mallet, 2012), seman-tic point cloud interpretation (Niemeyer et al., 2014; Wein-mann, 2016), tree detection (Gorte et al., 2015; Weinmann et al., 2017) or urban accessibility analysis (Serna and Mar-cotegui, 2013), and
• the modeling and analysis of natural environments, e.g. in terms of tree detection (Reitberger et al., 2009; Ferraz et al., 2012), tree species classification (Korpela et al., 2009; Vauhkonen et al., 2014b) or biomass estimation (Vauhkonen et al., 2014a).
For both scenarios, applications typically focus on the use of air-borne laser scanning (ALS), terrestrial laser scanning (TLS) or mobile laser scanning (MLS) systems to acquire point cloud data (Wehr and Lohr, 1999; Baltsavias, 1999a,b; Vosselman and Maas, 2010). Depending on the used system, the acquired point clouds reveal significantly differing characteristics with respect to point density, range measurement accuracy and the level-of-detail with which data about the observed scene is acquired.
Recent developments towards low-cost solutions for data acquisi-tion with improved flexibility and efficiency resulted in backpack laser scanning (BLS) systems (Lauterbach et al., 2015; R¨onnholm et al., 2016). Such systems allow exploring environments where standard vehicle-based MLS systems cannot be used, at the cost
∗Corresponding author
of a (slightly) decreased measurement accuracy. However, sim-ilar to TLS/MLS systems, the ground-based acquisition suffers from capturing the lower parts of objects (e.g. fac¸ades or the lower part of foliage), while upper parts (e.g. roofs or the upper part of foliage) are mainly occluded as e.g. shown in Figure 1. In contrast, ALS systems mainly capture the upper parts of objects (e.g. roofs or the upper part of foliage), while the lower parts (e.g. fac¸ades or the lower part of foliage) are often occluded. Conse-quently, it would be desirable to acquire data from low (and pos-sibly varying) altitudes using an unmanned aerial vehicle (UAV) and therefore involve UAV-borne laser scanning (UAV-LS) sys-tems. This in turn imposes constraints on the used scanning de-vice as a lightweight dede-vice is required.
ALS
UAV-LS
TLS
In this paper, we focus on UAV-borne laser scanning using mul-tiple line scanners as shown in Figure 2. This is motivated by the fact that UAV-LS systems are typically equipped with one line scanner. However, if the line scanner scans along the vertical di-rection and perpendicular to the flight didi-rection, the point density strongly depends on the speed with which the UAV moves. For high speeds, a low point density can be expected. If one would use a line scanner which scans along the horizontal direction, the point density becomes higher, but only data at a certain height is acquired (which would e.g. be useful for avoiding collisions with obstacles). For acquiring objects, a varying altitude of the UAV would be required to obtain a dense sampling. To combine both aspects, we use two line scanners, one scanning along the vertical direction and one scanning along the horizontal direction with respect to the UAV. To analyze the acquired data, we rely on the use of geometric features which are typically involved in the interpretation of ALS data (Niemeyer et al., 2014; Blomley and Weinmann, 2017), TLS data (Hackel et al., 2016) and MLS data (Munoz et al., 2009; Br´edif et al., 2014; Weinmann, 2016). In summary, the main contributions of this paper are
• the presentation of a concept for UAV-borne laser scanning with multiple scanning devices,
• the use of a UAV of typeDJI Matrice 100which in turn is equipped with two line scanners of typeHokuyo UTM-30LX for 3D mapping, and
• a qualitative analysis of the acquired point cloud data to coarsely reason about the local environment of the sensor platform.
After briefly summarizing related work in Section 2, we provide details on the proposed unmanned aerial system in Section 3. Fo-cusing on the exemplary application of UAV-borne scene acquisi-tion and interpretaacquisi-tion, we subsequently describe our methodol-ogy which allows an appropriate description of local point cloud characteristics and thus a coarse interpretation of the acquired data in Section 4. We provide first results in Section 5 and dis-cuss our findings in detail in Section 6. Finally, in Section 7, we conclude our paper and also provide an outlook on future work.
2. RELATED WORK
The key characteristics of the proposed system address UAV-borne data acquisition and the use of laser scanning devices. Based on the acquired data, we intend to derive a coarse analysis of the observed scene. Accordingly, we briefly describe a variety of systems used for UAV-borne data acquisition (Section 2.1) and approaches that have been proposed for the automated analysis of acquired point cloud data (Section 2.2).
2.1 Data Acquisition
Unmanned aerial systems (UASs) have meanwhile become a powerful tool for capturing spatial information as they are rel-atively cheap, easy-to-handle and easy-to-transport to the survey-ing field. Furthermore, they allow data acquisition in areas that cannot be entered with ground-based systems, e.g. because of damage or disasters.
In general, a UAS consists of a UAV used as sensor platform and some sensors used for data acquisition. Nowadays, UAVs are typically equipped with a digital camera delivering images that can for instance be used for scene monitoring, 3D mapping of the environment or localization of the platform. To facilitate the
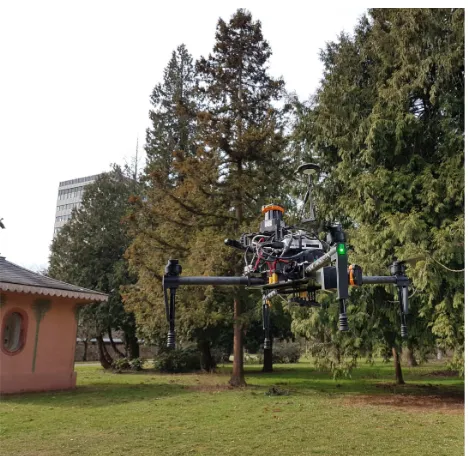
Figure 2. Data acquisition with the proposed unmanned aerial system for UAV-borne laser scanning with horizontally and verti-cally oriented line scanners.
estimation of its movement, a UAV can furthermore be equipped with an inertial measurement unit (IMU) and a global position-ing system (GPS) or global navigation satellite system (GNSS) receiver. Due to the progress in miniaturizing technology, UAV-borne data acquisition can meanwhile also involve laser scanning devices.
Among the early approaches towards UAV-borne laser scanning, Nagai et al. (2009) presented a UAV-borne 3D mapping system equipped with an IMU, a GPS receiver, two digital cameras, two infrared cameras and a laser scanner. While the IMU and the GPS receiver allow a localization of the UAV, the digital and in-frared cameras simultaneously allow acquiring radiometric infor-mation. The latter can for instance be used to derive the nor-malized difference vegetation index (NDVI) which is of impor-tance for several environmental applications. However, the total weight of these components is more than7kg, and for this
rea-son a larger, helicopter-like UAV was used which was able to operate for a duration of about1h. According to the
specifica-tions, the total weight of the used platform was about330kg and,
consequently, the complete system is neither a low-cost solution nor easy-to-bring to the surveying field. Focusing on rapid close-range monitoring, Choi and Lee (2011) proposed to use a smaller UAV equipped with an IMU, a GPS receiver, two digital cameras and a laser scanner to obtain orthophotos and even a digital ele-vation model (DEM) of high quality. In total, the whole system used for data acquisition had a weight of about10kg and
there-fore still a relatively large UAV was required due to the heavy payload. Similarly, a UAS involving an IMU, a GPS receiver, a camera and a laser scanner was used by Wallace et al. (2012), but their system was particularly designed towards low costs and increased flight times. The latter were about several minutes for a relatively heavy payload of up to2.8kg and hence only
rela-tively short flights were possible with this UAS. The UAS used by Conte et al. (2013) for airborne terrain mapping even involved an IMU, a GPS receiver, a compass and a multi-echo lidar sensor. The total weight of these components was more than4kg which
While early approaches towards UAV-borne laser scanning are characterized by a relatively heavy payload requiring the use of a larger UAV as sensor platform, particularly the development of lightweight systems has been in the focus of research in recent years. Besides allowing for longer flights, such systems can also be expected to allow capturing larger 3D environments with sig-nificantly lower costs. Designing a lightweight UAS means that lightweight devices are required for all relevant components, at the cost of a slight decrease in accuracy. In this regard, a vari-ety of lightweight solutions for IMU, GPS receiver and camera are meanwhile available and widely used. In contrast, finding a suitable laser scanner remained a major challenge for a long time. With the single-line laser scanners Hokuyo UTM-30LX andHokuyo UTM-30LX-EW, lightweight laser scanning devices (210g without cable) became available which meet these
require-ments. Such a device even allows recording multiple reflections as well as their corresponding intensity values for each transmit-ted laser pulse. Representing a line scanner performing distance measurements in a plane, such a device is well-suited for naviga-tion of ground vehicles in indoor environments with flat ground. To allow acquiring 3D data of the local surrounding of the sen-sor platform, a translation and/or a rotation of the sensen-sor platform would be required.
Early UASs involving a line scanner have for instance been used within indoor environments to obtain distance measurements in a plane around the UAV (Bachrach et al., 2009; Grzonka et al., 2009) which can be of great interest for avoiding collisions with obstacles. For acquiring 3D scans and thus allowing omnidirec-tional obstacle perception as well as flight trajectory estimation, Droeschel et al. (2013) and Holz et al. (2013) utilized an actu-ator for continuously rotating aHokuyo UTM-30LX-EWdevice. Focusing on mapping and monitoring purposes in outdoor envi-ronments, Kuhnert and Kuhnert (2013) proposed a lightweight UAS involving an IMU, a GPS receiver, a digital camera and a line scanner, for which a relatively small UAV with a payload of about1.5kg was used as sensor platform. As line scanner,
aHokuyo UTM-30LXwith range measurements up to30m was
tested as well as a more expensiveSICK LD-MRS-400001with range measurements up to200m. Thereby, both devices had an
angular resolution of0.25◦. Furthermore, Roca et al. (2014) used a UAS with a maximum payload of1.5kg. Their UAS involved
an IMU, a GPS receiver and a line scanner of typeHokuyo UTM-30LX. With a focus on accurately reconstructing the flight tra-jectory as e.g. required for accurate point cloud georeferencing, Jozkow et al. (2016) presented a UAS equipped with a variety of IMUs and GPS receivers as well as a digital camera and a line scanner. For the latter, the Velodyne HDL-32Eand Velo-dyne VLP-16devices with a weight of about1kg and0.8kg have
been tested. These devices reveal a better performance than the Hokuyo UTM-30LXdevice, yet at the cost of more weight and a more expensive solution for 3D mapping. Recently, Hillemann and Jutzi (2017) presented a UAS involving an IMU, a GPS re-ceiver, a multi-camera-system and a line scanner for analyzing the surrounding of the UAV.
In this paper, we investigate the use of multiple line scanners for data acquisition via UAV-borne laser scanning. More specif-ically, we use a UAS involving an IMU, a GNSS receiver and twoHokuyo UTM-30LX line scanners. The latter are oriented in horizontal and vertical direction with respect to the UAV. For 3D mapping in terms of densely sampling object surfaces in the local surrounding of the UAV, a flight maneuver should contain variations in altitude and (partial) rotations around the vertical direction with respect to the UAV.
2.2 Scene Interpretation
Once data have been acquired, an automatic analysis of the data is desirable. Thereby, the RGB imagery can for instance be used for the 3D reconstruction of the considered scene (Lucieer et al., 2012) or for the estimation of the pose of the UAV (M¨uller et al., 2017). However, many applications rely on the use of different types of sensors delivering different types of data to solve a de-sired task. In such a case, the different types of data (e.g. RGB imagery, thermal imagery, multi-/hyperspectral imagery or 3D point clouds) have to be fused, i.e. co-registered, with a sufficient accuracy. In this regard, Lucieer et al. (2012) proposed to fuse RGB imagery, multispectral imagery and thermal imagery. On the one hand, this allows obtaining a high-resolution digital ter-rain model (DTM) and, on the other hand, conclusions about the location and extent of healthy moss in the scene as well as about areas of potentially high water concentration can be drawn. An-other example for data fusion is given with UAV-borne 3D map-ping involving a camera and a lightweight line scanner, where optical and laser scanner data have to be fused to create a tex-tured 3D reconstruction of the scene (Jutzi et al., 2013, 2014).
In this paper, we focus on the analysis of the data acquired with the two line scanners. For this purpose, the eigenvalues of the 3D structure tensor are typically used to either describe the distinc-tiveness of specific shape primitives (Jutzi and Gross, 2009) or to derive local 3D shape features (West et al., 2004; Pauly et al., 2003) on a per-point basis. The latter option has been analyzed in detail in (Weinmann et al., 2015; Weinmann, 2016) for clas-sifying mobile laser scanning data, where different options for neighborhood selection were considered as the basis for feature extraction. We make use of both neighborhood selection and fea-ture extraction approaches presented in the aforementioned liter-ature and released athttps://www.ipf.kit.edu/code.php.
3. UNMANNED AERIAL SYSTEM
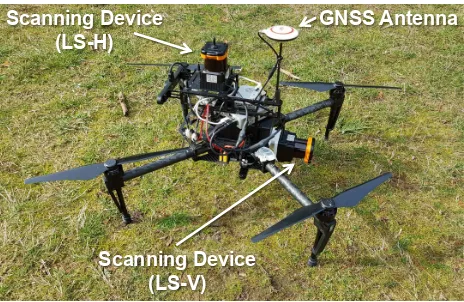
In this section, we describe the purpose-made UAS for UAV-borne laser scanning in detail. Thereby, we focus on the involved unmanned aerial vehicle (Section 3.1) and the used laser scanning devices (Section 3.2). As shown in Figure 3, the used laser scan-ning devices are oriented perpendicular to each other so that one device scans along the horizontal direction while the other one scans along the vertical direction to increase the mapping perfor-mance.
3.1 Unmanned Aerial Vehicle
As UAV, we use aDJI Matrice 100with aDJI Manifoldon-board processing unit to store the captured data. The quadcopter is able to carry a payload of 1kg with a maximum take-off weight of 3.6kg.
3.2 Laser Scanning Devices
To obtain accurate and dense 3D measurements from the envi-ronment, our UAS is equipped with two line scanners of type Hokuyo UTM-30LX (Figure 3). One line scanner (LS-H) scans in the horizontal direction, whereas the other (LS-V) scans in the vertical direction. Typical applications for such a setup might in-clude supporting camera-based SLAM or mapping by using laser scanners only.
Scanning Device (LS-V)
GNSS Antenna Scanning Device
(LS-H)
Figure 3. Overview on the proposed unmanned aerial system for UAV-borne laser scanning: the system involves a laser scanner scanning in the horizontal direction (LS-H) and a laser scanner scanning in the vertical direction (LS-V).
ofλ = 905nm and the laser safety class is 1. The scanning
devices have an angular resolution of0.25◦and allow measure-ments within a Field-of-View (FoV) of270◦. The range mea-surement accuracy is specified with30mm for distances between 0.1m and10m, and the maximum measurement distance is30m.
The specified pulse repetition rate is43kHz (i.e.,40scan lines
are captured per second). With its tiny size of62mm×62mm ×87.5mm and low weight of210g, theHokuyo UTM-30LXis well-suited for UAV-borne scene monitoring and 3D mapping.
4. METHODOLOGY
The proposed methodology for interpreting the acquired point cloud data comprises a downsampling of the acquired point cloud data (Section 4.1), the subsequent extraction of fundamental geo-metric features (Section 4.2) and a qualitative classification based on the extracted features (Section 4.3).
4.1 Downsampling
During data acquisition, certain cases may occur which have a detrimental effect on data analysis, e.g. in terms of scene interpre-tation. Such a case is given for periods where the UAV performs almost no movements, as the point density at certain areas will in-crease drastically. This in turn significantly affects the extraction of geometric features which typically relies on the consideration of a certain number of points within a local neighborhood as, be-cause of the extremely high point density, the absolute size of the local neighborhood becomes quite small and thus inappropriate to conclude about the local 3D structure.
To avoid such effects, we apply a voxel-grid filter (Theiler et al., 2014) to roughly even out variations in point density. Thereby, we first define the voxel sizesand then partition the 3D scene
into respective voxels. For each voxel, we only keep the center of gravity instead of all points that are within the voxel.
4.2 Feature Extraction
Based on the voxel-grid-filtered point cloud, we focus on extract-ing geometric features describextract-ing local point cloud characteris-tics. Thereby, we define a local neighborhood for each 3D point by considering theknearest neighbors, where the scale parameter
kis selected in different ways:
• The first option for selecting the scale parameterkis given
by choosing a fixed value for the scale parameter that re-mains identical for all 3D points of the point cloud as pro-posed in (Weinmann et al., 2013). As we aim at estimating the coarse structure of a considered scene, we may assume that selecting a scale parameter ofk = 50for each point
yields sufficiently large neighborhoods allowing to coarsely describe the local 3D structure.
• The second option for selecting the scale parameter k is
given by choosing an optimal valuekoptfor each 3D point individually viaeigenentropy-based scale selectionas pro-posed in (Weinmann et al., 2015).
Based on the recovered local neighborhoods, we proceed with deriving the 3D structure tensor, i.e. the 3D covariance matrix, which is determined for each point and its respectiveknearest
neighbors. The statements about the local structure can then be made by using the three eigenvaluesλjof the 3D structure tensor
(λ1 ≥λ2 ≥λ3 ≥0) and considering the three dimensionality
features of linearityLλ, planarityPλand sphericitySλ(West et
al., 2004; Demantk´e et al., 2011):
Lλ = λ1−λ2
To analyze the captured point clouds, we focus on distinguishing between linear (1D) structures, planar (2D) structures or volu-metric (3D) structures. This can be achieved by considering the three dimensionality features of linearityLλ, planarityPλand
sphericitySλ. Due to the normalization byλ1, the dimensional-ity features sum up to1and the feature with the highest value
in-dicates the dominant behavior (Weinmann and Jutzi, 2015). The benefit of such a qualitative classification is that no training data is required to train a respective classifier (and possibly tune its internal settings).
5. EXPERIMENTAL RESULTS
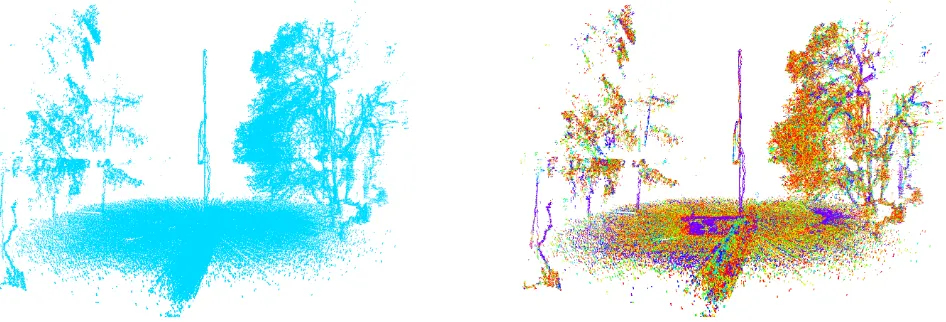
To test the capabilities of our UAS, we used it for data acquisi-tion within the scene shown in Figure 2. We performed a flight which was characterized by a take-off along the vertical direc-tion, a rotation of the UAV around the vertical axis and a landing maneuver in vertical direction. The point clouds acquired with the two involved line scanners during this flight are depicted in Figure 4, and they clearly reveal the benefit of using horizontally and vertically oriented line scanners. While the horizontally ori-ented line scanner densely samples lots of returns from the tree crowns during the flight, the vertically oriented line scanner ac-quires object surfaces in different directions of the UAS but with a lower point density.
To coarsely reason about the local environment of the sensor plat-form, we perform a qualitative analysis of the acquired point cloud data. The point cloud acquired with the horizontally ori-ented line scanner contains about 1.44M points, whereas the
point cloud acquired with the vertically oriented line scanner con-tains about5.29M points. To sample the scene as dense as
Figure 4. Point clouds acquired with the horizontally oriented line scanner (left) and with the vertically oriented line scanner (right). Note that the point density in the tree crowns is significantly higher on the left, whereas the scene coverage is larger on the right.
Figure 5. Visualization of the number of points within the local neighborhood when using thek= 50nearest neighbors (left) and when
using thekoptnearest neighbors selected via eigenentropy-based scale selection (right): the color encoding indicates neighborhoods with10or less points in red and reaches via yellow, green, cyan and blue to violet for100and more points.
frame using the relative orientation between the involved line scanners. Then, we apply a voxel-grid filter partitioning the scene into voxels with a side length ofs = 0.1m to roughly even out
extreme variations in point density. This results in about310k
re-maining 3D points, i.e. only about4.60% of the memory required
for storing the original data.
Focusing on the downsampled point cloud, we first derive a local neighborhood for each 3D point by considering the neighborhood typeNk=50comprising thek= 50nearest neighbors on the one hand and the neighborhood typeNkoptcomprising thekopt
near-est neighbors selected via eigenentropy-based scale selection on the other hand. The general behavior of the size of the derived neighborhoods is visualized in Figure 5, and it reveals a trend towards smaller neighborhoods when using eigenentropy-based scale selection. On the basis of the extracted local neighbor-hoods, we extract the three dimensionality features of linearity
Lλ, planarityPλand sphericitySλwhose general behavior for the considered scene is illustrated in Figure 6. This figure also contains a visualization of the dominant behavior of each point and thus reveals if a 3D point is characterized by either a linear (1D), a planar (2D) or a volumetric (3D) behavior.
6. DISCUSSION
The presented concept of UAV-borne laser scanning using mul-tiple line scanners represents a trade-off between ALS and
MLS/TLS. In comparison to ALS with a few tens of measured points per m2, a sampling of the considered scene with a sig-nificantly higher point density can be expected. Furthermore, not only data corresponding to the upper parts of objects are ac-quired. In comparison to TLS/MLS, a sampling of the consid-ered scene with a high point density is given as well, yet a lower range measurement accuracy can be expected due to the use of lightweight devices. Furthermore, not only data corresponding to the lower parts of objects are acquired. In contrast to both ALS and TLS/MLS, UAV-borne laser scanning even allows for data acquisition from varying altitudes reaching up to several tens of meters above ground. Appropriate flight maneuvers should hence result in an adequate sampling of object surfaces in the local sur-rounding of the UAV.
A visualization of the acquired point cloud data clearly reveals the benefit of using horizontally and vertically oriented line scanners for data acquisition. Both devices sample data with complemen-tary aspects (Figure 4): one device is used to densely sample lots of returns from the tree crowns, whereas the other device is used to obtain a high scene coverage, yet with a lower point density. The vertical structure in the center of all depicted visualizations does not correspond to parts of the considered scene. Instead, it corresponds to a part of the UAV that has been scanned continu-ously and thus indicates the performed flight trajectory.
neigh-Figure 6. Behavior of the dimensionality features of linearityLλ(Row 1), planarityPλ(Row 2) and sphericitySλ(Row 3) for the
neighborhoodsNk=50(left) andNkopt(right): the color encoding indicates high values close to1in red and reaches via yellow, green,
cyan and blue to violet for low values close to0. The maximum value of these features indicates the dominant behavior of a 3D point
borhoods tend to yield a more characteristic behavior with re-spect to linear, planar or volumetric structures (Figure 6). For a rather qualitative classification with respect to linear, planar and volumetric structures, the neighborhoodNk=50 comprising the
k = 50nearest neighbors seems to be favorable, because the
respectively derived dimensionality features are more distinctive and the dominant behavior appears much smoother than when us-ing the neighborhoodNkoptderived via eigenentropy-based scale
selection. The latter favors a smaller neighborhood size for the considered data (Figure 5). This might be due to the fact that the range measurement accuracy is in the order of a few centime-ters for the involvedHokuyo UTM-30LXline scanners. Thus, the measurement noise is higher than when using terrestrial or mobile laser scanners, and it seems to have a negative impact on a data-driven selection of the optimal neighborhood size. To reduce the impact of noisy measurements, using a larger voxel size would be required which runs at the cost of a reduced point density.
Finally, involving a voxel-grid filter based on voxels with a side length of0.1m resulted in only about4.60% of the memory
re-quired for storing the original data. Thus, a significant increase in efficiency can be expected when performing subsequent tasks on the downsampled point cloud. In the scope of this work, we used a parallelized, but not fully optimized Matlab implemen-tation which is run on a standard laptop computer (Intel Core i7-6820HK,2.7GHz,4cores,16GB RAM). When using the
neigh-borhoodNk=50, we observed a processing time of15.37s for feature extraction. When using the neighborhoodNkopt, we
ob-served processing times of216.22s and18.45s for
eigenentropy-based scale selection and feature extraction, respectively.
7. CONCLUSIONS
In this paper, we have presented a concept and a system for UAV-borne laser scanning using multiple line scanners for 3D map-ping. Our system is represented by aDJI Matrice 100quadcopter equipped with horizontally and vertically orientedHokuyo UTM-30LXline scanners. To demonstrate the capabilities of our un-manned aerial system, we have presented first results obtained for a flight within an outdoor scene. Thereby, the focus has been put on interpreting the acquired point cloud data with respect to lin-ear, planar or volumetric structures while investigating the impact of point density as well as the behavior of fundamental geomet-ric features for different neighborhood types. The derived results clearly reveal the high potential of UAV-borne laser scanning us-ing multiple line scanners.
In future work, we plan to use the presented unmanned aerial system for 3D mapping of larger environments and develop a framework with a particular focus on extracting objects such as trees, buildings and cars from the acquired data. This framework certainly includes other types of features and classification ap-proaches, and it might also involve the consideration of multi-scale neighborhoods and the use of spatial regularization tech-niques or segmentation approaches. In this regard, a more com-prehensive and quantitative analysis of the acquired data would be desirable. This might also involve a manual annotation of ex-emplary point clouds to evaluate the performance of different ap-proaches via comparison to reference labelings.
References
Bachrach, A., He, R. and Roy, N., 2009. Autonomous flight in unknown indoor environments.International Journal of Micro Air Vehicles1(4), pp. 217–228.
Baltsavias, E. P., 1999a. Airborne laser scanning: basic relations and for-mulas.ISPRS Journal of Photogrammetry and Remote Sensing 54(2-3), pp. 199–214.
Baltsavias, E. P., 1999b. Airborne laser scanning: existing systems and firms and other resources.ISPRS Journal of Photogrammetry and Re-mote Sensing54(2-3), pp. 164–198.
Blomley, R. and Weinmann, M., 2017. Using multi-scale features for the 3D semantic labeling of airborne laser scanning data. In:ISPRS An-nals of the Photogrammetry, Remote Sensing and Spatial Information Sciences, Wuhan, China.
Br´edif, M., Vallet, B., Serna, A., Marcotegui, B. and Paparoditis, N., 2014. TerraMobilita/IQmulus urban point cloud classification bench-mark. In:Proceedings of the IQmulus Workshop on Processing Large Geospatial Data, Cardiff, UK, pp. 1–6.
Choi, K. and Lee, I., 2011. A UAV-based close-range rapid aerial moni-toring system for emergency responses. In:The International Archives of the Photogrammetry, Remote Sensing and Spatial Information Sci-ences, Z¨urich, Switzerland, Vol. XXXVIII-1/C22, pp. 247–252.
Conte, G., Kleiner, A., Rudol, P., Korwel, K., Wzorek, M. and Doherty, P., 2013. Performance evaluation of a light-weight multi-echo lidar for unmanned rotorcraft applications. In:The International Archives of the Photogrammetry, Remote Sensing and Spatial Information Sci-ences, Rostock, Germany, Vol. XL-1/W2, pp. 87–92.
Demantk´e, J., Mallet, C., David, N. and Vallet, B., 2011. Dimensionality based scale selection in 3D lidar point clouds. In:The International Archives of the Photogrammetry, Remote Sensing and Spatial Infor-mation Sciences, Calgary, Canada, Vol. XXXVIII-5/W12, pp. 97–102.
Droeschel, D., Schreiber, M. and Behnke, S., 2013. Omnidirectional per-ception for lightweight UAVs using a continuously rotating 3D laser scanner. In:The International Archives of the Photogrammetry, Re-mote Sensing and Spatial Information Sciences, Rostock, Germany, Vol. XL-1/W2, pp. 107–112.
Ferraz, A., Bretar, F., Jacquemoud, S., Gonc¸alves, G., Pereira, L., Tom´e, M. and Soares, P., 2012. 3-D mapping of a multi-layered Mediter-ranean forest using ALS data. Remote Sensing of Environment121, pp. 210–223.
Gorte, B., Oude Elberink, S., Sirmacek, B. and Wang, J., 2015. IQPC 2015 Track: Tree separation and classification in mobile mapping lidar data. In:The International Archives of the Photogrammetry, Remote Sensing and Spatial Information Sciences, La Grande Motte, France, Vol. XL-3/W3, pp. 607–612.
Grzonka, S., Grisetti, G. and Burgard, W., 2009. Towards a navigation system for autonomous indoor flying. In: Proceedings of the IEEE International Conference on Robotics and Automation, Kobe, Japan, pp. 2878–2883.
Hackel, T., Wegner, J. D. and Schindler, K., 2016. Fast semantic seg-mentation of 3D point clouds with strongly varying density. In:ISPRS Annals of the Photogrammetry, Remote Sensing and Spatial Informa-tion Sciences, Prague, Czech Republic, Vol. III-3, pp. 177–184.
Hillemann, M. and Jutzi, B., 2017. UCalMiCeL – Unified intrinsic and extrinsic calibration of a multi-camera-system and a laserscanner. In:
ISPRS Annals of the Photogrammetry, Remote Sensing and Spatial In-formation Sciences, Bonn, Germany.
Holz, D., Nieuwenhuisen, M., Droeschel, D., Schreiber, M. and Behnke, S., 2013. Towards multimodal omnidirectional obstacle detection for autonomous unmanned aerial vehicles. In:The International Archives of the Photogrammetry, Remote Sensing and Spatial Information Sci-ences, Rostock, Germany, Vol. XL-1/W2, pp. 201–206.
Jozkow, G., Toth, C. and Grejner-Brzezinska, D., 2016. UAS topo-graphic mapping with Velodyne lidar sensor. In:ISPRS Annals of the Photogrammetry, Remote Sensing and Spatial Information Sciences, Prague, Czech Republic, Vol. III-1, pp. 201–208.
Jutzi, B., Weinmann, M. and Meidow, J., 2013. Improved UAV-borne 3D mapping by fusing optical and laserscanner data. In:The International Archives of the Photogrammetry, Remote Sensing and Spatial Informa-tion Sciences, Rostock, Germany, Vol. XL-1/W2, pp. 223–228.
Jutzi, B., Weinmann, M. and Meidow, J., 2014. Weighted data fusion for UAV-borne 3D mapping with camera and line laser scanner. Interna-tional Journal of Image and Data Fusion5(3), pp. 226–243.
Korpela, I., Ørka, H. O., Maltamo, M., Tokola, T. and Hyypp¨a, J., 2009. Tree species classification using airborne lidar – Effects of stand and tree parameters, downsizing of training set, intensity normalization, and sensor type.Silva Fennica44(2), pp. 319–339.
Kuhnert, K.-D. and Kuhnert, L., 2013. Light-weight sensor package for precision 3D measurement with micro UAVs e.g. power-line monitor-ing. In: The International Archives of the Photogrammetry, Remote Sensing and Spatial Information Sciences, Rostock, Germany, Vol. XL-1/W2, pp. 235–240.
Lafarge, F. and Mallet, C., 2012. Creating large-scale city models from 3D-point clouds: a robust approach with hybrid representation. Inter-national Journal of Computer Vision99(1), pp. 69–85.
Lauterbach, H. A., Borrmann, D., Heß, R., Eck, D., Schilling, K. and N¨uchter, A., 2015. Evaluation of a backpack-mounted 3D mobile scan-ning system.Remote Sensing7(10), pp. 13753–13781.
Lucieer, A., Robinson, S., Turner, D., Harwin, S. and Kelcey, J., 2012. Using a micro-UAV for ultra-high resolution multi-sensor observa-tions of Antarctic moss beds. In: The International Archives of the Photogrammetry, Remote Sensing and Spatial Information Sciences, Melbourne, Australia, Vol. XXXIX-B1, pp. 429–433.
M¨uller, M. S., Urban, S. and Jutzi, B., 2017. SqueezePoseNet: Image based pose regression with small convolutional neural networks for UAS navigation. In:ISPRS Annals of the Photogrammetry, Remote Sensing and Spatial Information Sciences, Bonn, Germany.
Munoz, D., Bagnell, J. A., Vandapel, N. and Hebert, M., 2009. Contex-tual classification with functional max-margin Markov networks. In:
Proceedings of the IEEE Conference on Computer Vision and Pattern Recognition, Miami, USA, pp. 975–982.
Nagai, M., Chen, T., Shibasaki, R., Kumagai, H. and Ahmed, A., 2009. UAV-borne 3-D mapping system by multisensor integration. IEEE Transactions on Geoscience and Remote Sensing47(3), pp. 701–708.
Niemeyer, J., Rottensteiner, F. and Soergel, U., 2014. Contextual classifi-cation of lidar data and building object detection in urban areas.ISPRS Journal of Photogrammetry and Remote Sensing87, pp. 152–165.
Pauly, M., Keiser, R. and Gross, M., 2003. Multi-scale feature extraction on point-sampled surfaces.Computer Graphics Forum22(3), pp. 81– 89.
Reitberger, J., Schn¨orr, C., Krzystek, P. and Stilla, U., 2009. 3D seg-mentation of single trees exploiting full waveform lidar data. ISPRS Journal of Photogrammetry and Remote Sensing64(6), pp. 561–574.
Roca, D., Armesto, J., Lag¨uela, S. and D´ıaz-Vilari˜no, L., 2014. Lidar-equipped UAV for building information modelling. In:The Interna-tional Archives of the Photogrammetry, Remote Sensing and Spatial Information Sciences, Riva del Garda, Italy, Vol. XL-5, pp. 523–527.
R¨onnholm, P., Liang, X., Kukko, A., Jaakkola, A. and Hyypp¨a, J., 2016. Quality analysis and correction of mobile backpack laser scanning data. In: ISPRS Annals of the Photogrammetry, Remote Sensing and Spatial Information Sciences, Prague, Czech Republic, Vol. III-1, pp. 41–47.
Serna, A. and Marcotegui, B., 2013. Urban accessibility diagnosis from mobile laser scanning data. ISPRS Journal of Photogrammetry and Remote Sensing84, pp. 23–32.
Theiler, P. W., Wegner, J. D. and Schindler, K., 2014. Keypoint-based 4-Points Congruent Sets – Automated marker-less registration of laser scans. ISPRS Journal of Photogrammetry and Remote Sensing96, pp. 149–163.
Vauhkonen, J., Næsset, E. and Gobakken, T., 2014a. Deriving airborne laser scanning based computational canopy volume for forest biomass and allometry studies.ISPRS Journal of Photogrammetry and Remote Sensing96, pp. 57–66.
Vauhkonen, J., Tokola, T., Packal´en, P. and Maltamo, M., 2014b. Iden-tification of Scandinavian commercial species of individual trees from airborne laser scanning data using alpha shape metrics.Forest Science
55(1), pp. 37–47.
Vosselman, G. and Maas, H.-G., 2010. Airborne and terrestrial laser scanning. Whittles Publishing, Dunbeath, UK.
Wallace, L. O., Lucieer, A. and Watson, C. S., 2012. Assessing the fea-sibility of UAV-based lidar for high resolution forest change detec-tion. In:The International Archives of the Photogrammetry, Remote Sensing and Spatial Information Sciences, Melbourne, Australia, Vol. XXXIX-B7, pp. 499–504.
Wehr, A. and Lohr, U., 1999. Airborne laser scanning – An introduction and overview.ISPRS Journal of Photogrammetry and Remote Sensing
54(2-3), pp. 68–82.
Weinmann, M., 2016.Reconstruction and analysis of 3D scenes – From irregularly distributed 3D points to object classes. Springer, Cham, Switzerland.
Weinmann, M. and Jutzi, B., 2015. Geometric point quality assessment for the automated, markerless and robust registration of unordered TLS point clouds. In:ISPRS Annals of the Photogrammetry, Remote Sens-ing and Spatial Information Sciences, La Grande Motte, France, Vol. II-3/W5, pp. 89–96.
Weinmann, M., Jutzi, B. and Mallet, C., 2013. Feature relevance assess-ment for the semantic interpretation of 3D point cloud data. In:ISPRS Annals of the Photogrammetry, Remote Sensing and Spatial Informa-tion Sciences, Antalya, Turkey, Vol. II-5/W2, pp. 313–318.
Weinmann, M., Jutzi, B., Hinz, S. and Mallet, C., 2015. Semantic point cloud interpretation based on optimal neighborhoods, relevant features and efficient classifiers. ISPRS Journal of Photogrammetry and Re-mote Sensing105, pp. 286–304.
Weinmann, M., Weinmann, M., Mallet, C. and Br´edif, M., 2017. A classification-segmentation framework for the detection of individual trees in dense MMS point cloud data acquired in urban areas.Remote Sensing9(3), pp. 277:1–277:28.