FROM TLS SURVEY TO 3D SOLID MODELING FOR DOCUMENTATION OF BUILT
HERITAGE: THE CASE STUDY OF PORTA SAVONAROLA IN PADUA.
A. Guarnieri a , F. Fissore a, A. Masiero a, A. Vettore a
a
CIRGEO-Interdept. Research Center for Geomatics, University of Padova, Italy [email protected]
KEY WORDS: Laser scanning, Solid Modeling, Cultural Heritage, BIM, Multimedia documentation
ABSTRACT:
It is a matter of fact that 3D visualisation and proper documentation of cultural objects helps to preserve the history and memories of historic buildings, archaeological sites and cultural landscapes, and supports economic growth by stimulating cultural tourism. Preservation, visualisation and recreation of valuable historical and architectural objects and places has always been a serious challenge for specialists in the field. Today, the rapid developments in the fields of close-range photogrammetry, terrestrial laser scanning (TLS) and computer vision (CV) enable to carry out highly accurate 3D models so as to be extremely effective and intuitive for users who have stringent requirements and high expectations. In this note we present the results of the survey and 3D modeling of an ancient gate, Porta Savonarola, located within the remains of the medieval town walls surrounding the historical city center of Padua, Italy. The work has been undertaken within the framework of the project “Walls Multimedia Museum” (WMM) promoted by the local private association “Padua Walls Committee”. The goal of the project was to develop a prototype of an “extended” virtual museum, spreaded along most interesting locations of the town walls. The survey of the ancient gate was performed with a Leica C10 and P20 terrestrial laser scanners. Once the acquired scans were properly merged together, a solid model was generated from the global point cloud, and plans and elevations were extracted from it for restoration purposes. A short multimedia video was also created for the “Walls Multimedia Museum”, showing both the outer and inner part of the gate. In the paper we will discuss all the steps and challenges addressed to provide the 3D solid model of Porta Savonarola from the TLS data.
1. INTRODUCTION
In the last decade improvements in surveying techniques (e.g. Terrestrial Laser Scanning-TLS, close range photogrammetry) and in digital data processing and management have allowed to collect different kind of information about a Cultural Heritge object. Whether it is a simple statue, a small artifact, a fragment or a whole ancient building or archeological site, current digital technology provides the users (scholars, professionals or wider audience) many instruments to analyze, study and explore the historical good. For example, through the generation of multi-resolution digital 3D models, geometrical, spatial, radiometric and multispectral contents of investigated objects can be captured and stored in digital form for documentation and conservation purposes. Three-dimensional modelling and representation through laser scanner surveys is a widely used method in the field of architecture and cultural heritage. It is well known that TLS technique not only provides information about the geometry of the object of interest, but also it enables to extrapolate information abut the state of conservation directly in a 3D environment. Moreover, in last years the integration between laser scanning technology and photogrammetry has also proven to be a very effective methodology to provide high-resolution 3D models of heritage sites and cultural artifacts. Through this approach, the geometry and appearance of real objects can be recorded with high level of detail and accuracy. Several works published so far have demonstrated how Cultural Heritage (CH) can greatly benefit from 3D modeling applied to object or historical/ archaeological site analysis, documentation, preservation and restoration (Barber et al., 2001; Guarnieri et al., 2004; Beraldin et al., 2005; Remondino et al., 2008). For instance, working in a 3D environment allows to digitally remove unwanted elements from the model and to view the
object/site in his correct historical context. Virtual restoration can be used to improve the knowledge of a site without resorting to interventions often traumatic for the original artifact. Furthermore, CH can also benefit from the use of Virtual Reality (VR) and its integration with Hypermedia and Computer Vision (CV). The advantages of using these technologies include the virtual reconstruction of buildings, sites or objects that no longer or only partially exist, the simulation of viewpoints not available in the real world, the direct interaction with virtual reproductions of artifacts, thus eliminating the risk of degradation. Virtual Reality environments created around such 3D models represent very often an easy way to give accessibility to CH among a wide variety of users.
Today the integration between Geomatics techniques and CV tools enable professionals to carry out highly accurate 3D models so as to be extremely effective and intuitive for users who have stringent requirements and high expectations. 3D visualisation and proper documentation of cultural objects helps to preserve the history and memories of historic buildings, archaeological sites and cultural landscapes, and supports economic growth by stimulating cultural tourism association “Padua Walls Committee” (www.muradipadova.it), which has been involved for 40 years in studying, preserving and promoting this important urban heritage site. The goal of the project was to develop a prototype of an “extended” virtual museum, spreaded along most interesting locations of the town
walls. In this note we will discuss all the steps and challenges addressed to provide the 3D solid model of Porta Savonarola from the TLS data.
The remainder of the paper is organized as follows. In section 2 a short overview of Porta Savonarola and the historical and architectural context of the Padua city walls is presented. Then in section 3 we describe the approach adopted to survey the ancient gate with terrestrial laser scanners. This leads to a discussion on employed data processing techniques in section 4 and on procedure for solid modeling from TLS data in section 5. Finally in section 6 the paper ends with a short discussion and some concluding remarks.
2. THE STUDY SITE: PORTA SAVONAROLA
The Walls of Padua are a complex of defensive works around the Italian city of Padua, designed to defend it from hostile attack. It was built in 4 phases, ranging form the roman epoch to the 16th century. The actual aspect of the walls dates back to the first half of the ‘500, it is almost entirely preserved and winds for a circuit of about 11 km, with 20 bastions and six gates. The city walls were erected after Padua, in 1509 during the War of the League of Cambrai, was temporarily occupied by the Maximilian of Austria imperial troops. The city was soon released, but the danger induced the Venice Senate to order the walls' complete overhaul. Begun in 1523 by Bartolomeo d'Alviano, Serenissima's general captain, the work was continued by Michele Sammicheli, and in 1544 could be considered completed. The defensive system complex, ordered on walls and formidable ramparts, excellent for the military architecture of the time, mades Padua, in the opinion of contemporaries, an impregnable city (Figure 1).
Nearly all the walls’ gates survive still today, including Porta Savonarola, located in the southern part of the walls. This gate is dedicated to Antonio Savonarola, winner of Ezzelino da Romano ad Arlesega. This splendid work, which plays on color contrasts between the Istria stone and gray trachyte, was built by Giovan Maria Falconetto in 1530. On the outer part of the west side of the gate, a frieze showes the Lion of Saint Mark, symbol of the Venetian Republic (Figure 2).
Figure 2: View of west side of Porta Savonarola.
3. DATA ACQUISITION
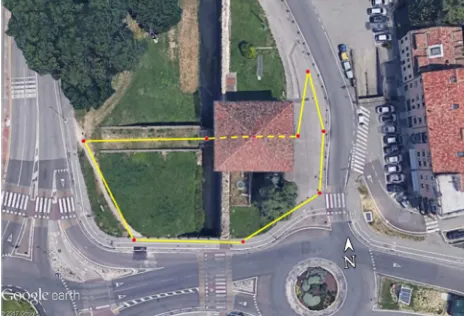
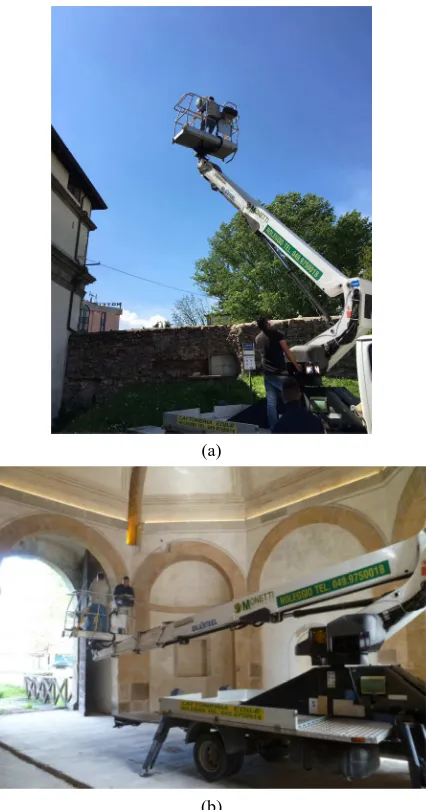
On april 2016 Porta Savonarola was fully surveyed on three days with two terrestrial laser scanners: a Leica C10 and a Leica P20 (Figure 3). The former, a pulsed laser ranging sensor, was employed to measure the whole building, except a subroof space. A closed traverse around and through ancient structure was established as basic platform on which to build the global 3D model (Figure 4). Scans acquired from traverse stations were covering the “first level” of the gate (see Figure 1), while a second set of “free scans” covering the “second level” and the outer roof were acquired with a crane truck (Figures 5a, 5b). Since no targets could be stitched to the inner and outer walls of the gate, in order to merge together both laser datasets some surrounding buildings were also included in the scans. We also set different levels of overlap between adjacent scans, namely: 30%-50% for the traverse-based scans, while 50%-70% for those captured from the “free” stations.
Figure 3: Leica C10 (left) and P20 (right) laser scanners.
Figure 4: The traverse established with the Leica C10 TLS. Figure 1: Map of the 16th century city walls of Padua.
Second level
First level
(a)
(b)
Figure 5: Leica C10 survey of the exterior (a) and interior (b) of Porta Savonarola from the crane-truck.
On average from each laser station we acquired scans with a spatial resolution of about 1 cm. Following a few initial tests, we deemed this value the most appropriated for the extraction of plans, profiles and elevations from the 3D solid model of the gate. Some details, like firezes on the outer walls, were surveyed with a resolution of 5 mm. Positions of the traverse vertices were measured by the C10 laser scanner using specific Leica target poles (Figure 6).
Inside Porta Savonarola a narrow passage, located in the “second level” of the structure, runs around the inner walls up to a wide subroof. Since this hidden part of the gate is not open to the tourists, it was of interest to the “Padua Walls Committee” to produce a 3D model of this environment as well. To this aim we decided to use a Leica P20 laser scanner, given its higher scanning speed (1Mil pts/sec) and higher measurement accuracy (3mm @ 50m) wrt. the Leica C10 (50k pts/sec and 6mm @ 50m, respectively). Because the lack of proper illumination would have required a time expensive lighting solution, no additional RGB data were acquired with the P20, as conversely done with the C10. P20 scans were collected with a spatial resolution of 6mm @ 10m and a “Quality level” of 3, which denotes the number of repeated measurements on the same point (Leica P20 Field manual).
Figure 6: Leica target pole used for the traverse with the C10.
The survey of Porta Savonarola took two days with the Leica C10 and just half a day with the P20. Most of the time was spent to set up the C10 laser scanner between subsequent traverse stations and to repeat some scans from the aerial platform, because of excessive vibrations due to the wind while scanning outdoor (Figure 5a). The advantage of the very high measuring speed offered by the P20 could only be partially exploited. Indeed the narrow space of the walkway, located inside the subroof of the structure, caused some difficulty while moving from a laser station to the next one, thus slowing down the surveying activities.
4. DATA PROCESSING
The data acquired with the C10 were processed in Leica Cyclone software. At first each scan was carefully filtered in order to remove unwanted objects like vegetation, parts of nearby buildings, vehicles and others unnecessary elements. Then the traverse was rebuilt and adjusted, generating in this way a set of pre-aligned scans. Such pre-alignment was furtherly refined with Cyclone built-in variant of the well known ICP algorithm (Besl and McKay, 1992). With this approach, traversing enabled us to add further constraints into the registration step, and thus to strength the alignment among the scans. The ICP was then repeatedly applied in order to align the scans captured from the “free” stations to those of the traverse. Here, matching points were manually selected by the operator, as no a priori information about spatial relationships between the datasets were available (each C10 “free” station was defined in a different local reference frame, depending on the spatial orientation of the laser sensor). In this step data from surrounding buidlings were also used to enforce the geometrical relationship between overlapping scans.
The ICP algorithm was also applied to register the P20 scans. Given the high level of overlap between the collected point clouds, just a few matching points needed to be manually selected to provide to the ICP a sufficient good initial guess of the spatial transformation between each scan pair. Again, these approximate pairwise alignments were furtherly refined by global registration.
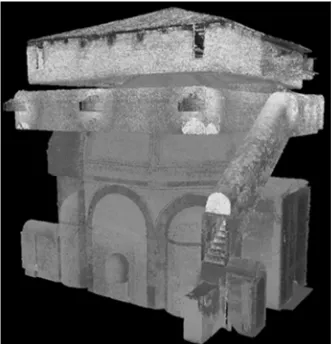
At the end, the registered C10-dataset and P20-dataset were merged together by running the ICP on common points selected on overlapping areas. The resulting global point cloud was properly decimated with an average 1 cm spatial resolution, using an octree-based sampling filter implemented in CloudCompare software. A very geometrically accurate global 3D model was then achieved, consisting of about 38 Mil. of points, of which 32 Mil. belonging to the C10 dataset and 6 Mil.
to the P20 dataset. Examples of the point clouds generated from both laser scanners are shown in figures 8 and 9 respectively.
(a)
(b)
Figure 8: View of west side (a) and east side (b) of the 3D model generated from C10 scans. Point colored with RGB data.
Figure 9: View of the hidden part of Porta Savonarola captured with the Leica P20 TLS. Points colored on grayscale according
to recorded intensity data.
5. SOLID MODELING
In this section we illustrate the procedure adopted to create a solid model of Porta Savonarola on the basis of the global point cloud derived from C10 and P20 TLS measurements.
Basically, all the processing was done in Autodesk Revit modeling software. An intermediate step in Autodesk Recap was however required in order to convert the .PTS file of the global subsampled 3D model, output by CloudCompare, in a suitable format to be imported in Revit. In this environment the TLS point cloud was sectioned in several horizontal levels, or layers, whose positions were defined in correspondance of clearly recognizable architectural changes of the structure (figure 10). This preliminary step was required, as all objects created in Revit need to be assigned to a specific layer. In building design such approach allows the user to modify the height of a floor and its assigned objects whithout the need to change them one by one.
The basic structure of the gate was created in a second step by generating the main walls. To this end a library of “walls” objects implemented in Revit was employed: related parameters (such size and thickness) were derived from the laser point cloud. In particular, profiles of the walls were defined by tracing curves or lines along respectives edges identified on the laser cloud.
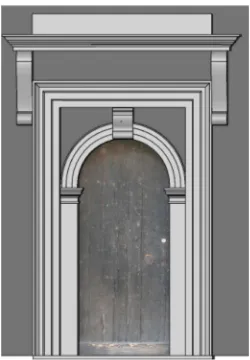
More complex and time expensive work has required the modeling of the architectural details of the builfing, such as columns, openings, niches, capitals and the 3D solid reconstruction of the wooden beam structure of the subroof. In all these cases the same following procedure was applied. Basically for each architectural detail we extracted a basic profile, consisting of a set of lines, from the global point cloud. Then this initial dataset was furtherly processed as “family” object in Revit. In this particular software environment, some level of extrusion was applied to the basic lines and others solid geometries were added to recover the original object 3D shape. In a few cases, as for example the capital and the opening shown in figure 11 and 12 respectively, the final object was the result of the composition of several nested “families” of shapes. As last step, each detail was set on the proper place in the solid model of the gate using the socalled “hosting” technique. Each main wall of the structure was considered as a “host” of the modeled architectural detail, which was then manually placed in the wall according to its position in the point cloud. This way, using a wall as “host” enabled us to constraint the displacement of the object to a planar surface instead of a 3D space, thus allowing only three degrees of freedom (two translations and one rotation on the plane of the surface wall).
Figure 10: Layer subdivision of the global TLS point cloud in Revit.
Figure 11: Solid model of a capital.
Figure 12: Solid model of an opening of Porta Savonarola.
Plans and elevations were also easily extracted from the solid model for restoration purposes (figure 13) and a video was created for the Padua “Walls Multimedia Museum”, showing both the inerior and exterior of the gate. In this regard, the use of 3D sections from the solid model enabled a more realistic visualisation and better comprehension to the WMM visitors of the internal structure of the gate.
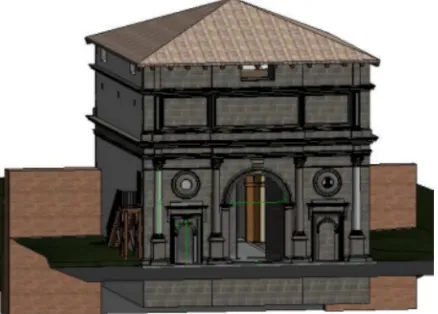
A global view of the resulting solid model of Porta Savonarola is shown in figures 14 and 15
Figure 13: Example of vertical profile of Porta Savonarola extracted from the solid model.
A further advantage of using Revit is that the output of this modeling software can be used for BIM (Building Information Modeling) applications. Indeed Revit allows to assign each model’s object a number of attributes related to its geometrical structure, composition and other properties, even in the form of documents. This way a solid model created in Revit can be employed for Heritage BIM (HBIM) applications aimed at the documentation, conservation and restoration of the historical good. In order to simplify this activities, it is essential to have reliable and informative spatial data. The current state-of-the-art approach to collecting, organising and integrating survey data of an existing building into a single data structure is to model it using BIM tools (Eastman, 2008).
BIM represents the process of development and use of a computer generated model to simulate the planning, design, construction and operation of a building. The resulting model, a building information model, is a data-rich, object-oriented, intelligent and parametric digital representation of the building, from which views and data appropriate to various users’ needs can be extracted and analysed to generate information that can be used to make decisions and to improve the process of delivering the building (Azhar, 2011).
Figure 14: Cross section along the east-west direction of the textured solid model of Porta Savonarola. The inner vault, the hidden passage and wooden subroof are clearly visible.
Nowadays, BIM technology allows to use in integrated way in the same environment advanced parametric modelling tools, functional intelligence, and object attributes. Furthermore, BIM technology enables different operators to work on the same object exploiting new interoperability standards: the different operators involved in the project can update and modify the BIM model according to their needs. Then, effect of the changes can be immediately evaluated by other users (Barazzetti et al., 2015).
Figure 15: Front view of the east side of the textured solid model of Porta Savonarola.
6. CONCLUSIONS
In this paper we have presented all the steps addressed for the survey and solid modeling from terrestrial laser scanning data of the historical structure of Porta Savonarola, an ancient gate of the 16th century, located within the city walls of Padua (Italy). The work was undertaken by CIRGEO within the framework of the project “Walls Multimedia Museum” (WMM) promoted by a local private association, “Padua Walls Committee”, which has been involved for 40 years in studying, preserving and promoting this important urban heritage site. The goal of the project was to develop a prototype of an “extended” virtual museum, spreaded along most interesting locations of the town walls. In the same time, this work represents a further example of how proper integration between Geomatics and BIM-oriented modeling techniques can provide high quality 3D representation of historical structures which can then be used for proper preservation and documentation of CH assets.
As discussed in previous sections, the structure of Porta Savonarola was surveyed with two terrestrial laser scanners (Leica C10 and P20), and specific measurement strategies were adopted in order to be able to correctly connect in a unique point cloud the inner and outer side of the gate. In this regards particular useful was the capability offered by Leica Scanstation systems to perform traverses, as with classical topographic instrument. This allowed us to add further constraints in the C10 scan registration step, and thus to produce a very geometrically accurate and consistent 3D model. The repeated application of the ICP algorithm, with more and more stringent parameters, was an additional key aspect for this processing step. The same holds for the use of scans of buildings surrounding the gate. These helped to overcome the lack of sufficient overlap between the main structure and the subroof environment, and thus to succesfully merge together the C10
and P20 scans. Some difficulty arised for the solid modeling of the architectural details of the building. More detailed scans, providing higher spatial resolution (e.g. 5 mm), could have helped the operator to produce a more realistic solid objects, reducing the inherent level of approximation. The use of meshes in this case can be a good alternative, especially to overcome the problem of holes due to hidden areas. A further useful aid is undoubtely represented by a suitable photographic documentation both of the whole structure to be modeld so as of the more interesting details. This documentation can be a valuable tool for the modeling operator to correctly reconstruct the architectural details, often not fully captured with the TLS. Anyway, the main lesson learned in this work is that the generation of a solid model or BIM model from TLS data can be successfully carried out only with a team of experts, sharing knowledge related to survey and modeling fields.
REFERENCES
Azhar, H. S., 2011. Building information modeling (BIM): benefits, risks and challenges [online], McWhorter School of Building Science, Auburn. Available from Internet: http://ascpro.ascweb.org/chair/paper/CPGT182002008.
Barazzetti, L., Banfi, F., Brumana, R., Gusmeroli, G., Oreni, D., Previtali, M., Roncoroni, F., and Schiantarelli, G., 2015. BIM From Laser Clouds And Finite Element Analysis: Combining Structural Analysis And Geometric Complexity. The Int. Arch. of the Photog., Remote Sensing and Spatial Information Sciences, XL-5/W4, 345-350, doi:10.5194/isprsarchives-XL-5-W4-345-2015, 2015.
Barber, D., Mills, J., Bryan P. G., 2001. Laser Scanning and Photogrammetry-21th Century Metrology. Proc. of CIPA 2001 Int. Symposium “Surveying and Documentation of Historic Buildings, Monument”, Potsdam, Germany.
Beraldin, J.-A., Picard, M., El-Hakim, S., Godin, G., Borgeat, L., Blais, F., Paquet, E., Rioux, M., Valzano, V., Bandiera, A., 2005. Virtual Reconstruction of Heritage Sites: Opportunities and Challenges Created by 3D Technologies. Proc. of the International Workshop on “Recording, Modeling and Visualization of Cultural Heritage”, Ascona, Switzerland.
Besl, P.J., McKay, N.D., 1992. A Method for Registration of 3D Shapes. IEEE Transactions on PAMI, vol. 14, no. 2, pp 239–256
Eastman, T. S. L. 2008. BIM handbook: a guide to building information modeling for owners, managers, architects, engineers, contractors and fabricators. Hoboken, NJ: John Wiley and Sons, Ltd. 504 p.
Guarnieri, A., Remondino, F., Vettore, A., 2004. Photogrammetry and Ground-based Laser Scanning: Assessment of Metric Accuracy of the 3D Model of Pozzoveggiani Church. Proc. of FIG Working week 2004, “The Olympic Spirit in Surveying”, Athens, Greece.
Remondino, F., Girardi, S., Gonzo, L., Rizzi, A., 2008. Multiresolution modeling of complex and detailed Cultural Heritage. Proc. of 9th Int. Symposium on Virtual Reality, Archaeology and Cultural Heritage (VAST 2008), pp. 1-8, Braga, Portugal.