Changes in pest management practice in almond orchards during
the rainy season in California, USA
L. Epstein
a,∗, S. Bassein
b, F.G. Zalom
c, L.R. Wilhoit
daDepartment of Plant Pathology, University of California, Davis, CA 95616-8680, USA bDepartment of Mathematics and Computer Science, Mills College, Oakland, CA 94613-1000, USA cDepartment of Entomology and Statewide IPM Project, University of California, Davis, CA 95616-8680, USA
dDepartment of Pesticide Regulation, Environmental Monitoring and Pest Management, California Environmental Protection Agency,
830 K Street, Room 200, Sacramento, CA 95814-3510, USA
Received 8 December 1999; received in revised form 5 June 2000; accepted 23 June 2000
Abstract
In California, regulatory agencies are concerned about organophosphate (OP) contamination of surface water. OPs originate in part from applications on dormant almond and stone fruit orchards that are washed off during winter rainstorms. Programs conducted by the University of California Statewide Integrated Pest Management Project, University of California Cooperative Extension, and the Biologically Integrated Orchard Systems (BIOS), a coalition of public and private groups, have promoted the replacement of OPs on almonds during the rainy season with alternative practices. Data from individual applicator records from the California Pesticide Use Reports demonstrated that during 1992–1997, almond growers in all nine major almond-producing counties significantly reduced use of OPs. The area of almond orchards treated with OPs during the dormant season was reduced by 40–55%, depending upon the region. Similarly, the percentage of growers who used OPs during the dormant season was reduced by 31–48%, and the mass of OPs applied to almond orchards during the dormant season was reduced by 22–57%. During the same period, there was a significant increase in the percentage of growers who used “reduced-risk” treatments: the microbial pesticide Bacillus thuringiensis at bloom-time, oil without an insecticide during the dormant season, and no treatment during the dormant or bloom season. In addition to the decrease in OPs during the dormant season, there was a significant decrease in the area treated with OPs during the growing season. However, there was also a significant increase in the use of pyrethroids during the dormant season, a practice that might result in some surface water and sediment contamination. © 2001 Elsevier Science B.V. All rights reserved.
Keywords: Integrated Pest Management; Organophosphates; Pesticide; Pesticide Use Reports; California, USA
1. Introduction
In California, almonds and stone fruits are grown in the San Joaquin and Sacramento valleys. In these
∗Corresponding author. Tel.:+1-530-754-7916;
fax:+1-530-752-5674.
E-mail address: [email protected] (L. Epstein).
regions, most rainfall occurs during the winter months when the trees are dormant and one application of an organophosphate (OP) insecticide, often applied with a horticultural mineral oil, effectively controls two im-portant pests: the peach twig borer (Anarsia lineatella Zeller) and the San Jose scale (Quadraspidiotus per-niciousus Comstock). In addition, the oil controls a complex of spider mites, notably the European red
mite (Panonychus ulmi) and the brown mite (Bryobia rubrioculus), by suffocating their overwintering eggs (Zalom et al., 1998a).
When the application of an OP during the dormant season was first introduced in the early 1970s, it was viewed as an environmentally sound practice (e.g., Rice et al., 1972), because one application during the dormant season replaced multiple applications during the growing season (Rice, 1978). A survey of Califor-nia almond growers from 1986 suggests that 93% of the growers “always” or “sometimes” used OPs during the dormant season (Rajotte et al., 1987). However, since 1988, the use of an OP during the rainy season has been increasingly viewed as an environmentally damaging practice (Department of Pesticide Regula-tion, 1996; Kuivila and Foe, 1995; Nordmark, 1997; Panshin et al., 1998). Largely based on data from 1992 to 1994, the National Water-Quality Assessment Pro-gram concluded that application of diazinon and other OP insecticides on orchards during tree dormancy was the major source of surface water contamination in the San Joaquin–Tulare Basin (Domagalski et al., 1997; Dubrovsky et al., 1998). During winter storm runoff, peak concentrations of diazinon frequently exceeded suggested water quality standards for main-tenance of aquatic indicator species (Menconi and Cox, 1994). To comply with the United States Clean Water Act, the California State Water Resources Con-trol Board and the California Department of Pesticide Regulation are required to reduce movement of OPs into surface water (Bennett et al., 1998). To achieve this goal, the state has continued environmental mon-itoring and has developed state basin plans. The plans focus on the Sacramento and San Joaquin River watersheds, namely, on the land draining into the Sacramento, San Joaquin, Feather, Merced, Stanislaus and the Tuolumne Rivers and their associated creeks and drains.
The University of California Statewide Integrated Pest Management Program (UC IPM), the University of California Sustainable Agriculture Research and Education Programs, the Almond Board of California, and the California Department of Pesticide Regula-tion have funded research on alternatives to using OPs on almonds during the dormant season (Barnett et al., 1993; Hendricks, 1995). Also, the Biologi-cally Integrated Orchard Systems (BIOS) program in California, which started in Merced and Stanislaus
counties in 1993 and 1994, respectively, uses on-farm demonstrations to encourage the use of alternatives to OPs (Dlott et al., 1996). Current recommenda-tions from the UC IPM (Zalom et al., 1998a; Bentley et al., 1999) include monitoring and applying insec-ticides (including OPs and supreme oil) only when the target pests are present, use of two or more ap-plications of Bacillus thuringiensis kurstaki during bloom time when the peach twig borer is present; and use of an application of oil without OPs when the trees are dormant and when the San Jose scale and mite eggs are present. Since 1997, two new reduced risk alternatives to dormant OPs for control of peach twig borer have also been recommended: spinosad (Success®, DowAgro Sciences) and pheromone mat-ing disruption (Zalom et al., 1998a; Bentley et al., 1999). Other alternative practices include use of cover crops to retard off-site movement of pesti-cides, use of other conventional pesticides (including pyrethroids) with or without oil during the dormant season, and use of in-season OPs rather than dormant season OPs.
Of the tree crops in California, almonds have the largest area planted, accounting for approximately 5% of the state’s cropland (Wilhoit et al., 1999). Con-sequently, trends in use of OPs on dormant almond orchards is of particular interest to the state regula-tory agencies, Integrated Pest Management advisors and environmental groups. This paper documents trends in use of OPs and alternative treatments on almonds during the winter dormant season from 1992 to 1997.
2. Materials and methods
2.1. California Pesticide Use Report records
2.2. Classification of records
OPs included azinphosmethyl, chlorpyrifos, diazi-non, fenamiphos, malathion, methidathion, methyl parathion, mevinphos, naled, parathion, phosalone and phosmet. Oils comprised all petroleum distillates and oils. Pyrethroids included esfenvalerate, perme-thrin, and pyrethrins. All strains and the encapsulated
d endotoxin of B. thuringiensis were classified as B.
thuringiensis. The following insecticides were clas-sified thus: carbaryl and methomyl as carbamates; endosulfan, rotenone, and spinosad, as miscellaneous. Because all of the carbamates and miscellaneous ma-terials were collectively applied on less than 3% of the km2planted in any county in any year, their use is generally not discussed in this paper.
The “rainy season” was considered to be from 10 December in 1 year to 20 March of the year indi-cated in the text. Although the actual rainy season starts during the autumn in California, treatments with OPs on the dormant plants do not commence until 10 December because leaves typically remain on the trees at least until this date. In this paper, the “rainy season” coincides with the dormant period in which chemical treatments are applied plus the bloom period in which the microbial pesticide B. thuringiensis is applied.
2.3. Data cleaning
To correct errors from inconsistent naming of sites, leading zeros, blanks, commas, dashes, parentheses, and periods were removed from the site codes. To cor-rect some of the typographical errors in the site codes (that presumably result from misreading hand-written script), the following letters, Z, G, I, S, O were re-placed with the numbers 2, 6, 1, 5, 0, respectively. This reduced the total number of sites by 0–0.9% per year.
To minimize the effect of generally typographical errors in the reported “acres planted”, for all records for each site for each year, the km2planted value was replaced with the median value for that site.
The Pesticide Use Reports has multiple copies of some records, including records that are identical in every respect including the same mass of active ingre-dient with the same product on the same area of the same site on the same day. Assuming that a grower would not intentionally file two identical records for
the same day, exact duplicates were removed, with a resultant loss of 0.8–1.7% of the records per year. Also assuming that a grower would not actually apply a sin-gle active ingredient on more than 105% of their area planted on a single day, records of the same active in-gredient on the same day were combined. The records were sorted in descending order of the reported km2 treated until either there were no more records or until the area treated was equal to the 1.05×area planted. The kg of active ingredient of all the selected records was summed. This caused the loss of 0.6–1.4% of the records per year.
2.4. Analysis
Data analysis was restricted to the nine counties in California that had a minimum of 60 km2of almond orchards (Table 1). In this paper, “site” refers to a planted area in a county with the same grower iden-tification, geographic location, and site identification. The first year of the study was 1992, except for Butte County in which the first year was 1993. To calculate the total area planted with almonds, for each year, the km2 planted in all of the sites in each county were summed. To minimize annual fluctuations and to ex-amine trends in insecticide use, the percentage change between the first-half and the second-half of the study period was calculated.
For data expressed on a per area basis, for each site– year–class of chemical-combination, the area treated was summed but limited to the area planted. Then the area treated for all sites was summed. For each region, data on a per area basis for all the sites in all the counties are indicated in Table 1. Unless indicated otherwise, in the text, data on a per area basis indicate the range of values for the nine counties.
com-Table 1
The area planted with almonds in the California counties with the largest production, and the number of growers in those counties in 1997a
Region Countyb Area planted (km2) No. of growers
Northern San Joaquin Valley Merced 345 779
San Joaquin 148 447
Stanislaus 322 995
Central San Joaquin Valley Fresno 252 423
Madera 202 273
Southern San Joaquin Valley Kern 404 254
Sacramento Valley Butte 169 245
Colusa 72 64
Glenn 90 121
aData were obtained as individual applicator records from the California Department of Pesticide Regulation. bIncludes all counties with at least 60 km2 of almond orchards.
pounds were used. For this categorical classification, the total percentage of growers was limited to 100%. However, when indicated, the growers in the “alter-native users” category were further classified into as many categories as applied. Thus a grower who was classified as an alternative user could be classified as a user of both B. thuringiensis and oil alone if both treatments were used.
The total mass of OPs applied in each county in each year was calculated using two methods. First all records were summed. Second, for each of the OPs, the median application rate per site was first com-puted. Then for all sites in each county, (the km2 treated)×(the median application rate in kg of active ingredient per km2 in that county in that year) was calculated. Then the mass of all the active ingredients was summed for each county and for each region.
2.5. Statistical tests
Using counties as observational units, the percent-age change was calculated as indicated above for the following variables: the percentage of area that was treated, the percentage of growers that used a spe-cific treatment, and the mass of OPs. For several of the treatments, the percentage change data were sig-nificantly non-normal. After a transformation using log[(% change/100)+1], a Shapiro–Wilks “W” test was used to demonstrate that the data were normally distributed (Zar, 1984). A t-test was used to test the null hypothesis that the log[(% change/100)+1] was not significantly different from 0.
Because the data presented in this paper are the out-comes of an observational study of a census, rather than the outcomes of an experiment or the outcomes of an observational study of a sample, the interpretation of the P-values from standard tests is non-standard. In this context, the P-values may be interpreted as a mea-sure of how unusual the trends appear to be in terms of the fraction of times that one would find the ob-served trends in all possible permutations of the data (Freedman and Lane, 1983). This analysis assumes that counties are independent. Growers were not con-sidered to be observational units because they are not necessarily independent decision-makers and use of growers as observational units would overestimate the strength of the significance. Counties were selected as observational units because they produce an exceed-ingly conservative estimate of the P-values. Moreover, counties provide a reasonable observational unit for the following reasons: different counties have different University of California Cooperative Extension farm advisors; the BIOS program is organized by county; and pest populations are often more uniform within counties than between counties.
3. Results
3.1. Analysis of the data on almonds from the Pesticide Use Reports
data were available. However, in 1991, there was a problem in many counties with inconsistent naming of sites, which resulted in erroneously high figures of the area planted. The 1992 data showed that inconsis-tent naming of sites was corrected in all counties by 1992, except for Butte County, in which the problem was resolved by 1993. Data from Butte County in 1992 are not shown here.
Almonds are primarily grown in four regions in California (Table 1). For all county–year combina-tions, for those growers who applied a dormant- or bloom-time treatment, the median number of appli-cations per site was 1 for all treatments, except for B. thuringiensis, in which case the median number of ap-plications was 1 in 51% of the county–year combina-tions and 2 in the remaining 49% (data not shown). The median percentage of the site treated per application was most commonly 100% of the area planted in that site (data not shown). For example, in all county–year combinations for OPs, the median percentage of the
Table 2
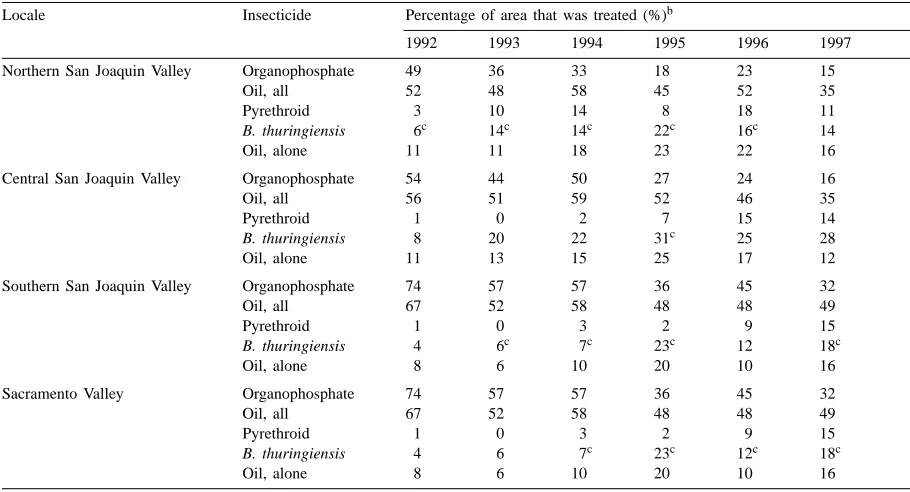
The percentage of area planted with almonds that were treated as indicated during the dormant season or at bloom from 1992 to 1997a
Locale Insecticide Percentage of area that was treated (%)b
1992 1993 1994 1995 1996 1997
Northern San Joaquin Valley Organophosphate 49 36 33 18 23 15
Oil, all 52 48 58 45 52 35
Pyrethroid 3 10 14 8 18 11
B. thuringiensis 6c 14c 14c 22c 16c 14
Oil, alone 11 11 18 23 22 16
Central San Joaquin Valley Organophosphate 54 44 50 27 24 16
Oil, all 56 51 59 52 46 35
Pyrethroid 1 0 2 7 15 14
B. thuringiensis 8 20 22 31c 25 28
Oil, alone 11 13 15 25 17 12
Southern San Joaquin Valley Organophosphate 74 57 57 36 45 32
Oil, all 67 52 58 48 48 49
Pyrethroid 1 0 3 2 9 15
B. thuringiensis 4 6c 7c 23c 12 18c
Oil, alone 8 6 10 20 10 16
Sacramento Valley Organophosphate 74 57 57 36 45 32
Oil, all 67 52 58 48 48 49
Pyrethroid 1 0 3 2 9 15
B. thuringiensis 4 6 7c 23c 12c 18c
Oil, alone 8 6 10 20 10 16
aStatistical analyses of the data in this table are shown in Table 3.
bFor each county shown in Table 1, for each site, the total area treated to a maximum of 100% planted was determined. Then the area
treated for all sites was summed. The median number of applications per site was 1 for all compounds in all counties, except as noted in footnotec.
cThe median number of applications per site was 2.
site treated per application was 97–100% of the area planted in that site (data not shown).
3.2. Reductions in organophosphate treatments during the rainy season
Table 3
The average change between the 1992–1994 period and the 1995–1997 period in the yearly percentage of area treated with the indicated insecticides in California almond orchards during the dormant season or at blooma
Insecticidal treatment
Change in the percentage of area treated between the 1992–1994 period and the 1995–1997 periodb
P-value for the
nine countiesc Northern SJV Central SJV Southern SJV Sacramento Valley
Organophosphate −53 −55 −40 −53 0.00003∗∗
Oil, alld −17 −21 −18 −19 0.01∗
Pyrethroid 41 1445 675 97 0.03∗
B. thuringiensis 51 69 216 78 0.003∗∗
Oil alonee 53 33 103 47 0.003∗
aEach region includes the counties shown in Table 1. Data are shown in Table 2.
bThe percentage change=[(%, averaged over 1995–1997)−(%, averaged over 1992–1994)]/(%, averaged over 1992–1994)×100. cThe log[(% change/100)+1] was computed for each county and a t-test was used to compute the P-value.
dIncludes oil used either alone or in combination with other insecticides. eDid not contain any other insecticides.
∗P<0.05. ∗∗P<0.01.
OPs. The median application rate of each of the OPs did not change significantly (P ≥ 0.18) during the study period (data not shown).
Whereas the number of reports of OP applications declined between 1992 and 1997, the total number of both the uncorrected and the corrected records of all pesticides that were reported by almond growers increased yearly between 1992 and 1996. Thus, during the time period when the number of reports of OP applications declined, the number of records filed by almond growers increased by 9%.
The OPs that were applied during the rainy season were often applied with oil (data not shown).
Conse-Table 4
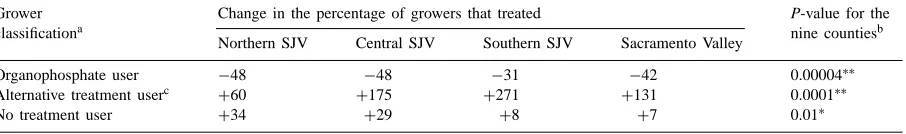
The average change between the 1992–1994 period and the 1995–1997 period in the yearly percentage of growers using the indicated insecticides in California almond orchards during the dormant season and at blooma
Grower classificationa
Change in the percentage of growers that treated P-value for the
nine countiesb
Northern SJV Central SJV Southern SJV Sacramento Valley
Organophosphate user −48 −48 −31 −42 0.00004∗∗
Alternative treatment userc +60 +175 +271 +131 0.0001∗∗
No treatment user +34 +29 +8 +7 0.01∗
aA grower that applied any organophosphate during the rainy season was classified as an organophosphate user. A grower that did not
apply any OPs was classified as an alternative user if any of the following treatments were applied during the rainy season: pyrethroid, any of the miscellaneous compounds listed in the text, B. thuringiensis, or oil alone. Remaining growers were classified as using “no treatment”.
bThe log[(% change/100)+1] was computed for each county and a t-test was used to compute the P-value.
cThe percentage increase in alternative treatment users is relatively large because the values in the first years of the study were relatively
low.
∗P<0.05. ∗∗P<0.01.
quently, it is not surprising that the percentage of area planted that was treated with oil (either with or without an insecticide) also significantly (P =0.01) declined between the first-half and the second-half of the study (Table 3). Growers also used oil (i) as a treatment “alone” without another insecticide (Table 2) or (ii) as a dormant application in combination with pyrethroids or carbamates.
3.3. Alternatives to OPs
of growers that did not use OPs and who used one or more alternative insecticidal treatments (P =0.0001) (Table 4). In California, during the 1992–1997 period, primarily three alternative insecticidal treatments were used: the microbial pesticide B. thuringien-sis, pyrethroids, and oil alone. Table 2 shows the area treated with each of the alternatives and will be discussed separately. Between the first- and the second-half of the study, there was a significant (P = 0.003) increase in the area treated with the microbial pesticide B. thuringiensis (Table 3) and in the percentage of growers who used B. thuringiensis. Here, a grower is classified as a user of B. thuringien-sis, only if no OPs were applied. In 1992, depending upon the county, from 0 to 8% of the growers used B. thuringiensis. In 1997, 5–34% of the growers applied this treatment, depending upon the county. However, in 51% of the 53 county–year combinations, the median number of applications of B. thuringiensis per site was only 1. According to the University of California recommendations, growers that monitored for peach twig borer and determined that a treatment was necessary, should have applied two or more bloom-time sprays (Zalom et al., 1998a).
Between the first-half and the second-half of the study, there was also a significant increase (P =0.03) in the area treated with pyrethroids and a significant (P = 0.003) increase in the percentage of the total area in almond orchards that was treated during the rainy season with “oil alone”, i.e., an application of oil without any conventional insecticides in the tank (Tables 2 and 3).
Carbamates were only used to treat less than 3% of the planted area in all counties in all years (data not shown). Use of all of the “miscellaneous” compounds collectively was less than 0.5% of the treated area in all counties in all years.
Between the first-half and the second-half of the study period, the percentage of growers who did not treat any of their area during the rainy season increased significantly (P =0.01) (Table 4). In 1992, from 21 to 46% of the growers applied no treatment, depend-ing upon the county, whereas in 1997, 25–62% of the growers applied no treatment.
Almond growers in California did not replace an ap-plication of an organophosphate during the rainy sea-son with an application during the dry seasea-son, which is the California growing season. Between the first-half
and the second-half of the 6 years of the study, there was a decrease (P =0.04) in the percentage of area treated with OPs during the dry season: a 13, 10, and 6% decrease in the northern, central, and southern San Joaquin Valley, respectively, and a 30% decrease in the Sacramento Valley (data not shown).
3.4. Environmental load of organophosphates
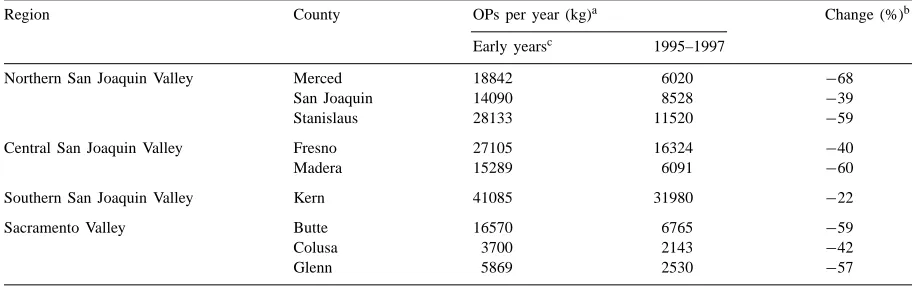
The mass of active ingredient of the OPs applied during the rainy season in almond orchards was calcu-lated by multiplying the km2 treated and the median application rate (Table 5). According to this calcula-tion, on average, there was a 57, 47, and 22% decrease in the northern, central, and southern SJV, respectively, and a 56% decrease in the Sacramento Valley in the kg of OPs applied on almonds during the rainy season during the 1995–1997 period versus the first years of the study (P =0.00006). For another calculation of the kg of OPs applied, the kg from all of the records were simply summed (data not shown). According to the summed kg applied, there was a 57, 37, and 23% decrease in the northern, central and southern SJV re-gions, respectively, and a 53% decrease in the Sacra-mento Valley in the mass of OPs applied on almonds during the rainy season between the 1995 and 1997 period versus the first years of the study (P =0.0002). Reductions in OPs were the largest in the water-sheds of greatest concern, i.e., in the Sacramento Valley, and in the northern and central SJV; the re-ductions in OPs were the smallest in the southern SJV where there is the least rainfall and the least reg-ulatory concern. However, even after the reductions, between 1995 and 1997, almond growers in the nine major almond-producing counties applied approxi-mately 91 900 kg of OPs per year during the 3-month winter rainy season.
Table 5
The calculated total kg of organophosphates (OPs) applied on almond orchards in California during the dormant and bloom season
Region County OPs per year (kg)a Change (%)b
Early yearsc 1995–1997
Northern San Joaquin Valley Merced 18842 6020 −68
San Joaquin 14090 8528 −39
Stanislaus 28133 11520 −59
Central San Joaquin Valley Fresno 27105 16324 −40
Madera 15289 6091 −60
Southern San Joaquin Valley Kern 41085 31980 −22
Sacramento Valley Butte 16570 6765 −59
Colusa 3700 2143 −42
Glenn 5869 2530 −57
aFor each of the OPs, for each county, (the km2treated)×(the median application rate in kg of active ingredient per km2) was computed
and then the kg of active ingredients were summed.
bThe log[(% change/100)+1] was computed for each county and a t-test was used to computeP=0.00006.
c1992–1994 were the early years of the study in all cases except in Butte County in which the early years of the study were 1993
and 1994.
4. Discussion
One of the primary goals of the UC IPM program is to reduce the pesticide load in the environment (Zalom and Flint, 1990). In addition, the California Environmental Protection Agency supports the use of IPM programs to reduce pesticide risk in Califor-nia. Indeed, IPM programs can simultaneously reduce pesticide use and maintain or increase farm profits without having significant effect on consumer prices (Bolkan and Reinert, 1994; Pimentel, 1997). However, although there are numerous examples in which IPM practices reduced pesticide use in experimental plots (e.g., Barnett et al., 1993; Zalom and Fry, 1992), there are very few studies that demonstrate reduced pesti-cide use in large-scale geographic areas and that are documented with actual pesticide use data. The re-duction is particularly notable because there is no ev-idence of a decline in overall use of OPs and other pesticides used in production agriculture in Califor-nia (Wilhoit et al., 1998, 1999). In addition, based on expert opinion, there is no evidence that the decrease was associated with a decrease in pest pressure.
The State Water Quality Plans have three tiers of implementation. In tier I, compliance is voluntary. In tier II, regulators encourage management practices. If voluntary compliance is unsuccessful, the Regional Water Quality Control Boards (RWQCB) have the
au-thority to invoke tier III, in which regulators control effluent release. To date (May 2000), the Department of Pesticide Regulation has asked growers to take mea-sures voluntarily to reduce water contamination from OPs during the rainy season (Bennett et al., 1998). It is unknown whether the reductions in applications on dormant almond orchards have resulted in decreased runoff during winter storms. In addition to improving water quality, reduced use of OPs on orchards during the dormant season may be advantageous to grow-ers because there is emerging resistance to OPs in lo-calized San Jose scale populations in the central and southern San Joaquin Valley.
be able to make the applications. However, the fact that approximately half of the growers who apply B. thuringiensis apply less than recommended may sug-gest that these treatments were not necessary. There is a considerable variability in OP use between counties within the same region. This may indicate that there are opportunities for further reduction in OP use.
Part of the decline in OP use is the result of re-placing OPs with pyrethroids, especially esfenvaler-ate, which is less expensive than the OPs. Whether run-off of pyrethroids will contribute to surface water pollution and contamination of stream sediment is un-known and should be studied. In addition, increased use of pyrethroids may present new challenges in pest management. There is greatly increased tolerance of peach twig borer populations to pyrethroids in areas of the Sacramento Valley. Although actual resistance of the borer to pyrethroids has not been observed on almonds, in general, insects become resistant to pyrethroids more rapidly than to the other classes of pesticides. Also residues of pyrethroid insecticides persist on bark, and may affect beneficial arthropods for extended periods of time (Zalom et al., 1998b).
Here, data were presented on either a landscape (i.e., county and region) and/or a per grower basis. In terms of monitoring progress towards environmental goals, the landscape basis is preferred. However, to monitor progress in implementation of Integrated Pest Management Programs, a per grower basis may be preferred. In addition, some data are more appropri-ately presented on either a per county or a per grower basis. For example, because some growers apply sev-eral treatments, each to a portion of their site, an ac-curate tabulation of the percentage of area that was not treated with any insecticidal compound cannot be made. However, such calculations can be made with relative confidence on a per grower basis.
The California Pesticide Use Reports were designed to be a census of agricultural pesticide use. If all al-mond growers in California apply at least one pesticide per site at some time during the year, and all grow-ers fulfill their legal responsibility to file reports, then the data shown here are a census, rather than a sam-pling of almond growers. Although 100% compliance with legal requirements of reporting seems unlikely, the sample size here is large. For example, there were a total of 3581 and 3601 almond growers in 1993 and in 1997, respectively, in the nine counties who filed
at least one Pesticide Use Report. Of those growers who report at least one application, it is unknown what percentage of actual applications is reported on a per grower basis. Nonetheless, it seems unlikely that the decline in OP use reported here is an artifact because of a decrease over time in the percentage of growers who reported their actual OP use. Indeed, the num-ber of records for all compounds increased during the study period and a grower that applies an OP during the dormant season does not face any penalties for ei-ther making the application or for filing a Pesticide Use Report.
5. Conclusion
Pesticide use data from the nine major almond-prod-ucing counties in California, USA were used to demonstrate that organophosphate use during the dormant season, a practice that is risky to aquatic ecosystems, was reduced in the study period from 1992 to 1997.
Acknowledgements
The authors thank J. Broome for helpful dis-cussions, and the anonymous reviewers and an Editor-in-Chief for reviewing the paper. This study was supported in part by institutional support of S. Bassein by Mills College, and by a grant from the University of California Statewide IPM Project.
References
Barnett, W.W., Edstrom, J.P., Coviello, R.L., Zalom, F.G., 1993. Insect pathogen “Bt” controls peach twig borer on fruits and almonds. Calif. Agric. 4, 4–6.
Bolkan, H.A., Reinert, W.R., 1994. Developing and implementing IPM strategies to assist farmers: an industry approach. Plant Dis. 78, 545–550.
Department of Pesticide Regulation, 1996. Distribution and mass loading of insecticides in the San Joquin River, California (Winter 1991–92 and 1992–93). California Environmental Protection Agency, Sacramento, CA.
Department of Pesticide Regulation, 2000. Pesticide use reporting: an overview of California’s Unique Full Reporting System. California Environmental Protection Agency, Sacramento, CA. Dlott, J., Nelson, T., Bugg, R.L., Spezia, M., Eck, R., Redmond, J., Klein, J., Lewis, L., 1996. California, USA: merced county BIOS Project. In: Thrupp, L.A. (Ed.), New Partnerships for Sustainable Agriculture. World Resources Institute, Washington, DC, pp. 115–126.
Domagalski, J.L., Dubrovsky, N.M., Kratzer, C.R., 1997. Pesticides in the San Joaquin River, California — inputs from dormant sprayed orchards. J. Environ. Qual. 26, 454–465.
Dubrovsky, N.M., Kratzer, C.R., Brown, L.R., Gronberg, J.M., Burow, K.R., 1998. Water Quality in the San Joaquin–Tulare Basins, California, 1992–1995. US Geological Survey Circular 1159.
Freedman, D., Lane, D., 1983. A nonstochastic interpretation of reported significance levels. J. Business Econ. Statist. 1, 292– 298.
Hendricks, L.C., 1995. Almond growers reduce pesticide use in Merced County field trials. Calif. Agric. 49, 5–10.
Kuivila, K.M., Foe, C.G., 1995. Concentration, transport and biological impact of dormant spray pesticides in the San Francisco Estuary, California. Environ. Toxicol. Chem. 14, 1141–1150.
Menconi, M., Cox, C., 1994. Hazard assessment of the insecticide diazinon to aquatic organisms in the Sacramento–San Joaquin River system. Administrative Report No. 94-2. California Department of Fish and Game, Rancho Cordova, CA. Nordmark, C., 1997. Occurrence of aquatic toxicity and
dormant-spray pesticide detections in the Sacramento River watershed, winter 1996–97. Environmental Hazards Assessment Program. Department of Pesticide Regulation, California Environmental Protection Agency, Sacramento, CA.
Panshin, S.Y., Dubrovsky, N.M., Gronberg, J.M., Domagalski, J.L., 1998. Occurrence and distribution of dissolved pesticides in
the lower San Joaquin River Basin, California. US Geological Survey Water-Resources Investigations Report No. 98-4032. Pimentel, D., 1997. Techniques for Reducing Pesticide Use:
Economic and Environmental Benefits. Wiley, New York. Rajotte, E.G., Kazmierczak, R.F., Norton, G.W., Lambur, M.T.,
Allen, W.A., 1987. The national evaluation of extension’s integrated pest management (IPM) programs. Appendix 2: California almond IPM impact study. Virginia Cooperative Extension Service Publication No. 491-013.
Rice, R.E., 1978. Insect and mite pests of almonds. In: Micke, W., Kester, D. (Eds.), Almond Orchard Management. Division of Agriculture and Natural Resources Publication No. 4092. University of California, Berkeley, CA, pp. 117–124. Rice, R.E., Jones, R.A., Black, J.H., 1972. Dormant sprays with
experimental insecticides for control of peach twig borer. Calif. Agric. 26, 14.
Wilhoit, L., Supkoff, D., Steggall, J., Braun, A., Goodman, C., Hobza, B., Todd, B., Lee, M., 1998. An analysis of pesticide use in California, 1991–1995. California Environmental Protection Agency PM 98-01, Sacramento, CA.
Wilhoit, L., Davidson, N., Supkoff, D., Steggall, J., Braun, A., Sewell, S., Hobza, B., Gorder, N., Hunter, C., Goodman, C., Todd, B., 1999. Pesticide use analysis and trends from 1991 to 1996. California Environmental Protection Agency PM 99-01, Sacramento, CA.
Zalom, F.G., Flint, M.L., 1990. Integrated pest management in California and the Statewide Integrated Pest Management Project. Calif. Agric. 44, 4–6.
Zalom, F.G., Fry, W.E. (Eds.), 1992. Food, Crop Pests, and the Environment: The Need and Potential for Biologically Intensive Integrated Pest Management. APS Press, St Paul, MN. Zalom, F.G., Van Steenwyk, R.A., Bentley, W.J., Coviello, R.,
Rice, R.E., Hendricks, L., Pickel, C., Freeman, M.W., 1998a. Insects and mites. In: UC IPM Pest Management Guidelines for Almonds. Division of Agriculture and Natural Resources Publication No. 3339, University of California, Oakland, CA. Zalom, F.G., Walsh, D., Stimmann, M., Pickel, C., Krueger, W.,
Buchner, R., 1998b. Impacts of pyrethroids on beneficial mite predators. In: Proceedings of the California Plant and Soil Conference, Sacramento, CA, pp. 62–67.