The livestock export program is jointly funded by the livestock exporters and
MLA makes no representation as to the accuracy of any information or advice contained in this document and excludes all liability, whether in contract, tort (including negligence or breach of statutory duty) or otherwise as a result of reliance by any person on such information or advice. © Meat and Livestock Australia (2000)
Report prepared for MLA and Livecorp by:
RT Norris and GJ Norman
Department of Agriculture, Western Australia
Meat & Livestock Australia Ltd
Locked Bag 991
North Sydney NSW 2059
ISBN 1 74306 113X
April 2002
L I V E . 2 0 6
L i v e E x p o r t T r a d e f r o m
A u s t r a l i a
Contents
Page
1 INTRODUCTION ...1
2 NUMBER OF SHEEP EXPORTED ...1
2.1 To the Middle East and South East Asia...1
2.2 Sheep exports by destination country...2
3 SHEEP MORTALITIES ...3
3.1 Introduction ...3
3.2 Mortalities ...3
3.3 Class of sheep...5
3.4 Mortality by time of the year...6
3.5 Mortality by ship (for adult wethers) ...7
4 CATTLE ...9
4.1 Introduction ...9
4.2 Overview ...9
4.3 South East Asia region ...10
4.4 Middle East region ...10
4.5 Ship ...11
4.6 Port of loading...12
4.7 Loading region (North vs. South) ...13
5 PUBLISHED STUDIES...14
1 INTRODUCTION
The live export of sheep and cattle makes a significant contribution to the Australian economy, returning over $900 million in 2001 and providing employment in services that support this industry. The live export trade provides important support for the sheep and cattle industries and is the only market outlet for producers in some areas of Australia.
This report provides summary information about mortalities in sheep and cattle during sea transport from Australia. The information is obtained from ship master’s reports which record livestock deaths and environmental data each day aboard ship and also from “Yellow Books” which record more detailed information about numbers of sheep deaths.
The main purpose of the report is to allow industry, government and others to monitor mortality trends in the live sheep and cattle trades. The report also lists relevant published studies. As in previous reports, codes are used where appropriate in order to maintain confidentiality.
2 NUMBER OF SHEEP EXPORTED
2.1 To the Middle East and South East Asia
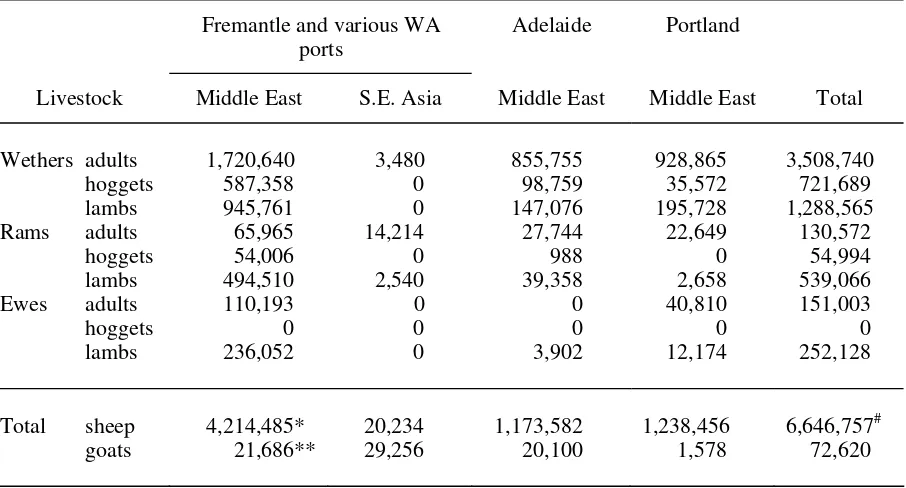
The number of sheep and goats exported by sea from Fremantle, Adelaide and Portland during 2001 is shown in Table 1. Compared with 2000, total sheep exports increased by 24%, while exports of goats increased by 109%. There was a 13% increase in exports of adult wethers, resulting from a substantial increase from Adelaide (380%) and Portland (78%) respectively, and a decrease from Fremantle (-28%)
Younger sheep comprised approximately 40% of all sheep exported in 2001. Exports of both ewe and wether lambs increased by 41%, while ram lambs increased by 35%. Wether and ram hoggets increased by 27% and 21% respectively. Overall, exports of wethers and rams increased by 20% and 24% respectively, while ewes increased by 60%.
Table 1. The number of sheep and goats exported by sea from Fremantle, Adelaide and Portland during 2001
Fremantle and various WA ports
Adelaide Portland
Livestock Middle East S.E. Asia Middle East Middle East Total
Wethers adults 1,720,640 3,480 855,755 928,865 3,508,740
hoggets 587,358 0 98,759 35,572 721,689
Total sheep 4,214,485* 20,234 1,173,582 1,238,456 6,646,757#
goats 21,686** 29,256 20,100 1,578 72,620
* Includes 73,269 sheep sent to Mexico and 970 sent to Mauritius ** Includes 2,786 goats sent to Mauritius
#
Excludes 65,575 sheep which could not be categorized by class
0 .0
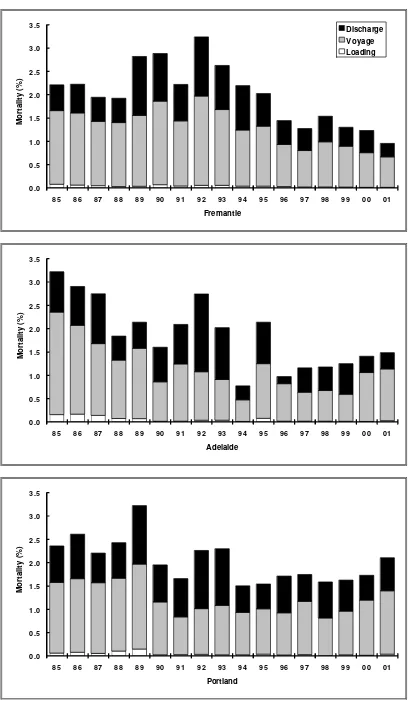
Figure 1. Numbers of sheep exported by sea from Fremantle (Western Australia), Portland (Victoria) and Adelaide (South Australia) since 1985
2.2 Sheep exports by destination country
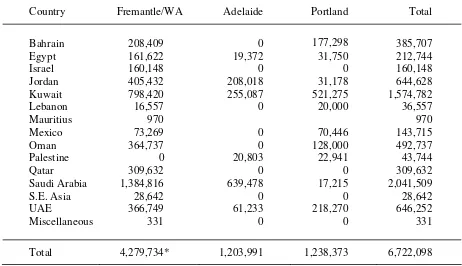
The main importing countries for Australian sheep in 2001 are shown in (Table 2). Saudi Arabia replaced Kuwait as the strongest market (30% of all exports) followed by Kuwait (23%), the United Arab Emirates (10%) and Jordan (10%). Compared with 2000, exports increased to Israel (up by 23%), Kuwait (5%), Mexico (33%), Saudi Arabia (221%) and South East Asia (5%). Exports decreased to Bahrain (down by 16%), Egypt (14%), Jordan (9%), Oman (1%), Qatar (3%) and the United Arab Emirates (19%). Lebanon and Palestine continued to increase as importers of Australian sheep, but exports to Mauritius fell below 1,000 head.
Table 2. The destination country for sheep exported from Fremantle/WA, Adelaide and Portland during 2001
Country Fremantle/WA Adelaide Portland Total
Bahrain 208,409 0 177,298 385,707
Total 4,279,734* 1,203,991 1,238,373 6,722,098
3 SHEEP MORTALITIES
3.1 Introduction
There were 36 voyages to the Middle East in 2001 for which sheep were loaded at more than one port in Australia (split-load voyages). Care was taken to ensure that mortalities for split-load voyages were attributed to the correct port of loading. Where analysis of split-load voyages has been performed, the consignments of sheep from each load port have been considered as separate voyages.
3.2 Mortalities
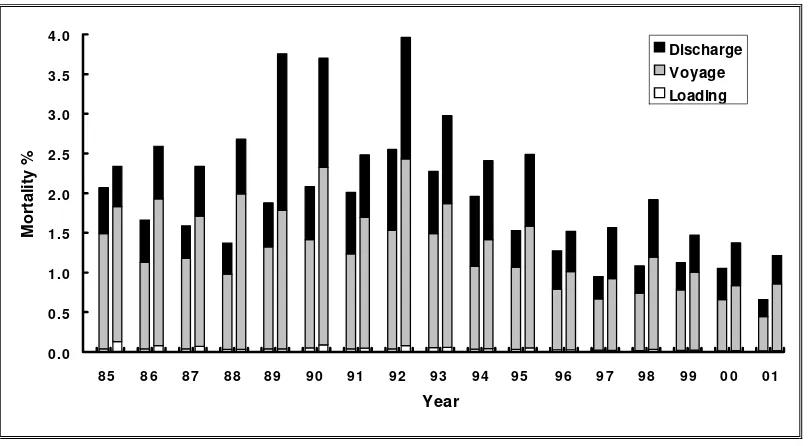
The shipboard part of the export process is divided into three phases: loading; voyage to the first port of unloading; and discharge. The discharge phase includes all deaths after arrival at the first port. Consequently if a ship called at more than one discharge port, all the deaths were included in the discharge phase.
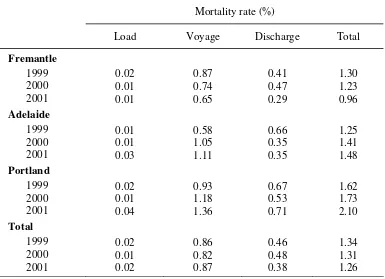
The overall death rate for all sheep exported to the Middle East during 2001 was 1.26% (Table 3). This is a new record low and reflects a declining trend over the last three years.
The total death rate for shipments from Fremantle was lower in 2001 compared to previous years and was due to reduced death rates during the voyage and discharge phases. The death rates for sheep exported from Fremantle in 2001 were the lowest experienced since the inception of the mortality surveillance system in 1985 (Figure 2).
In contrast, the total death rates for shipments from Adelaide and Portland were higher in 2001 compared to previous years. The increase was due to increased death rates during the loading and voyage phases, from each port.
0 .0
3.3 Class of sheep
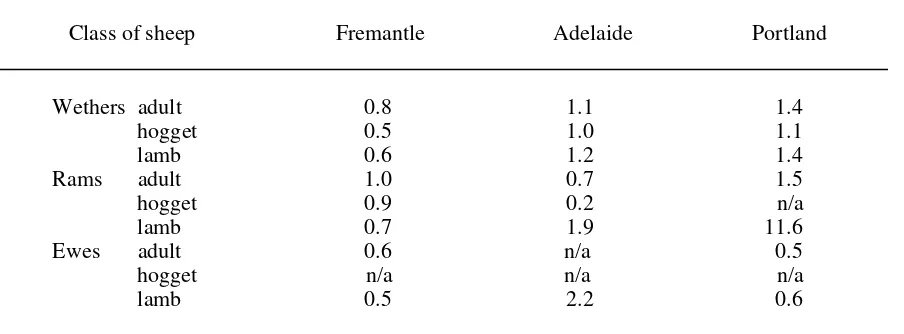
The death rates of various classes of sheep during the voyage phase of export from Australia to the Middle East are shown in Table 4 and Figure 3. There were small increases in the death rates of all adult sheep classes exported from Fremantle compared with 2000. These were offset by lower mortalities in younger sheep.
There was a substantial increase in the death rate of wether hoggets and all lamb classes exported from Adelaide compared with 2000. In contrast, there was a decrease in the death rate of adult and hogget rams.
All wether classes exported from Portland experienced increased death rates in 2001, while death rates of ewe classes decreased. There was a small decrease in the death rate of adult rams and a substantial increase in the death rate of ram lambs exported compared with 2000. The increase in ram lamb deaths was due to high mortalities on one exceptional voyage.
Table 4. Mortality (%) for classes of sheep exported from Fremantle, Adelaide and Portland to the first destination port in the Middle East in 2001
Class of sheep Fremantle Adelaide Portland
Wethers adult 0.8 1.1 1.4
n/a not applicable (no sheep of this class were loaded)
0 .0
Figure 3. Mortality (%) for classes of sheep during voyages from Fremantle to the first port of discharge in the Middle East in 2001
3.4 Mortality by time of the year
Death rates in sheep exported from Fremantle were again higher in the second half of 2001 compared with the first half (Figure 4). This finding is evident in both voyage and discharge mortality and is consistent with previous years. Research on ships and in Middle East feedlots has indicated that failure to eat is the main cause of death in these phases of the export process.
0 .0 East for the first and second half of each year from 1985 to 2001
Average monthly death rates in sheep exported from Fremantle during 2001 closely paralleled the moving 5-year average (1997 to 2001), though generally being lower (Figure 5). The usual increase in mortality in the second half of the year was more pronounced for 2001 but fell away quite sharply in the last quarter, probably as a result of the early finish to the season, as in 2000.
0 .0
3.5 Mortality by ship (for adult wethers)
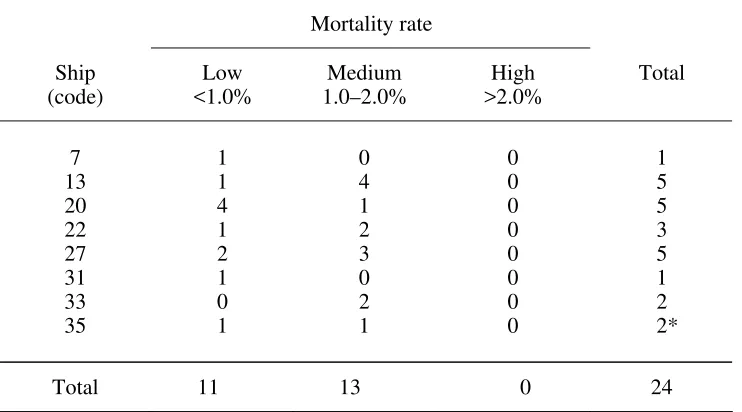
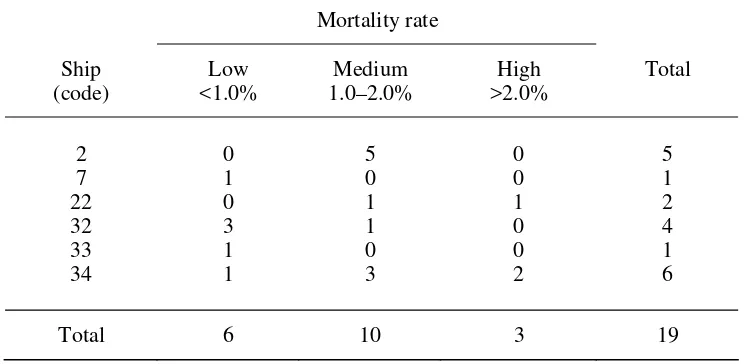
The voyages of each ship were classified into low, medium and high mortality categories for shipments of adult wethers from Fremantle (Table 5a), Adelaide (Table 5b) and Portland (Table 5c). There were five voyages classified as “high mortality” from Fremantle, none from Adelaide and three from Portland during 2001. Most voyages from Fremantle were in the “low” category, while half the voyages from Adelaide and Portland were in the "medium" category.
Table 5a. Number of voyages in low, medium and high mortality categories (wethers only, to first port of discharge) for ships loaded at Fremantle in 2001
Mortality rate * One split-load voyage excluded: mortality to first port could not be determined by class
Table 5b. Number of voyages in low, medium and high mortality categories (wethers only, to first port of discharge) for ships loaded at Adelaide in 2001
Mortality rate
Table 5c. Number of voyages in low, medium and high mortality categories (wethers only, to first port of discharge) for ships loaded at Portland in 2001
Mortality rate
Ship (code)
Low <1.0%
Medium 1.0–2.0%
High >2.0%
Total
2 0 5 0 5 7 1 0 0 1 22 0 1 1 2 32 3 1 0 4 33 1 0 0 1 34 1 3 2 6
4 CATTLE
4.1 Introduction
The live cattle trade from Australia is characterised by the wide range in ports of loading in Australia, the large number of ships involved and the number of countries to which the animals are shipped. This is in contrast to the live sheep trade where there are only three main ports of loading, and virtually all sheep are shipped to the Middle East.
The following results and comments are based on analysis of ship Masters’ reports which were to hand in April 2002 and also “Yellow Books” which record more detailed information about the number of cattle deaths. Some results, such the as number of cattle exported, may differ slightly from other sources of information.
There were 23 voyages in 2001 for which cattle were loaded at more than one port in Australia. Care has been taken to ensure that all mortalities for split-load voyages are attributed to the correct port of loading. Where analysis involving split-load voyages has been performed, the consignments of cattle from each load port have been considered as separate voyages.
4.2 Overview
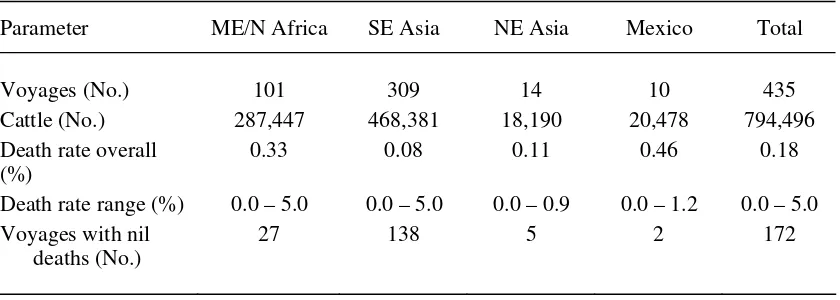
The overall death rate among the 0.8 million cattle exported from Australia in 2001 fell to 0.18% (Table 6), a reduction of 18% from the death rate of 0.22% experienced in 2000. Exports to South East Asia were mainly to Indonesia and the Philippines, and were characterised by small consignments on short voyages with very low death rates. Voyages to the Middle East, mainly Egypt, involved longer duration and higher death rates than those to South East Asia.
Table 6. Death rates, number of voyages and number of cattle exported for voyages to major destination regions during 2001
Parameter ME/N Africa SE Asia NE Asia Mexico Total
Voyages (No.) 101 309 14 10 435
Cattle (No.) 287,447 468,381 18,190 20,478 794,496
Death rate overall (%)
0.33 0.08 0.11 0.46 0.18
Death rate range (%) 0.0 – 5.0 0.0 – 5.0 0.0 – 0.9 0.0 – 1.2 0.0 – 5.0 Voyages with nil
deaths (No.)
4.3 South East Asia region
During 2001, nearly 0.5 million cattle were exported to South East Asia (Table 7) and the death rate was 0.08%, down from 0.11% experienced in 2000. No deaths were reported on 45% of the voyages to the region. The death rate from 1995 to 2001 has remained low at approximately 0.1% annually except in 1999 when the death rate was 0.34% (or 0.16% if one exceptional voyage was excluded).
Table 7. Death rates, number of voyages and number of cattle exported to the South East Asia region from 1995 to 2001
* exceptional voyage
4.4 Middle East region
The remaining sections of this report focus on voyages to the Middle East region.
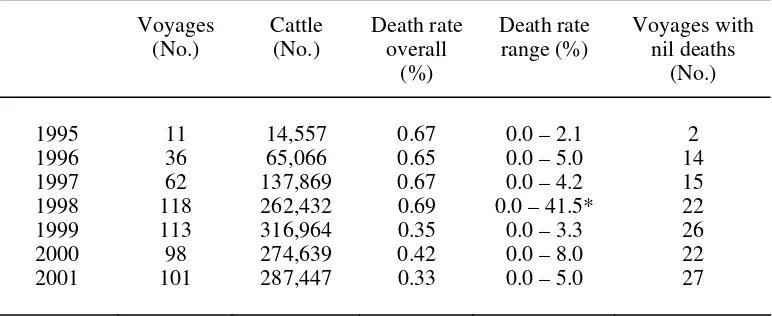
The live cattle trade to the Middle East expanded rapidly between 1995 and 1998, with the number of voyages and number of cattle exported doubling every year (Table 8). Despite the rapid expansion of the trade over this period, the death rate remained remarkably constant at approximately 0.7% annually. However, since 1999 death rates have remained at nearly half of the level before 1999.
During 2001, the death rate to the Middle East was 0.33% involving 0.3 million cattle, with no deaths reported on 26% of the voyages. This was a 21% reduction in mortality compared to 2000.
Table 8. Death rates, number of voyages and number of cattle exported to the Middle East from 1995 to 2001
4.5 Ship
The voyages of each ship from Australia to the Middle East were classified into the following overall mortality categories: nil (no deaths reported); low (death rate up to 0.5%); medium (death rate from 0.5 to 1.0%); and high (death rate greater than 1.0%). Note that for this comparison, “voyage” equates to consignment from a port. Consequently, if a ship loaded at two ports, then two “voyages” are shown for that ship, one for each port.
Table 9 shows the number of voyages in the various mortality categories for each ship (ship names are coded to protect their identity). Most voyages of ships 13, 31, 35, 75 and 100 were in the lower mortality categories.
Ships 59 and 78 made only a single voyage to the Middle East in 2001. Ships 13, 31, 33 and 35 made 10 or more voyages to the Middle East, two of which were in the high mortality category.
4.6 Port of loading
For voyages to the Middle East, the greatest number of cattle were exported from Fremantle, followed by Darwin and Portland (Table 10). Death rates were highest from Portland (0.8%), followed by Adelaide (0.5%), Devonport (0.4%) and Fremantle (0.3%). Death rates were low from northern loading ports.
The voyages from each port were classified into various mortality categories as shown in Table 11. Note that for this comparison, “voyage” equates to consignment from a port (for example, if a ship loaded at two ports, then two “voyages” are shown, one for each port). Half of the voyages from Portland and one third of the voyages from Fremantle were in the medium and high categories. Six voyages out of 100 were in the high category
Table 10. Death rates, number of voyages and number of cattle exported from various ports to the Middle East for 2001
Port Voyages
Excludes voyages with more than one port of loading, where mortalities could not be identified to a particular port
Table 11. Number of voyages in nil, low, medium and high mortality categories for shipments from various ports to the Middle East for 2001
Mortality rate
4.7 Loading region (North vs. South)
For voyages to the Middle East, death rates were compared between selected ports in the north and south of Australia. The death rate from southern ports has been approximately 3 times higher than from northern ports since 1998 (Table 12). In 2001, there were four times as many voyages and twice as many cattle exported from southern ports as from northern ports during the year.
Table 12. Death rates, number of voyages and number of cattle exported from northern and southern regions to the Middle East from 1997 to 2001. Relative risk shows risk of death in cattle loaded from southern areas compared to northern areas
Year Region Voyages
North: Townsville, Darwin, Wyndham, Broome South: Fremantle, Adelaide, Portland, Devonport
4.8 Season
Monthly death rates were compared between selected northern and southern ports (same ports as in previous section). Monthly death rates from southern ports were approximately 0.5% throughout the year, with a trend for lower death rates from December to February (Figure 6). Cattle were only shipped from northern ports from March to October and death rates were lower than from southern ports each month.
0.0
5 PUBLISHED STUDIES
A list of scientific and extension publications, relevant to the live sheep trade, is shown below.
1. McDonald, C.L., Gittins, S.P. and Rowe, J.B. (1988) Effect of time of year and prior feeding experience on feeding behaviour of sheep as if for export. Proc. Aust. Soc. Anim. Prod. 17: 226-229.
2. Norris, R.T. and Richards, R.B. (1989) Deaths in sheep exported by sea from Western Australia – analysis of ship Master's reports. Aust. Vet. J. 66: 97-102.
3. Norris, R.T., Richards, R.B. and Dunlop, R.H. (1989) An epidemiological study of sheep deaths before and during export by sea from Western Australia. Aust. Vet. J. 66: 276-279.
4. Norris, R.T., Richards, R.B. and Dunlop, R.H. (1989) Pre-embarkation risk factors for sheep deaths during export by sea from Western Australia. Aust. Vet. J. 66: 309-314.
5. Richards, R.B., Norris, R.T., Dunlop, R.H. and McQuade, N.C. (1989) Causes of death in sheep exported live by sea. Aust. Vet. J. 66: 33-38.
6. Kelly, A.P. (1990) Health and welfare research in the live sheep export trade. Vic. Dept. of Agric. and Rural Affairs.
7. McDonald, C.L., Norris, R.T., Ridings, H. and Speijers, E.J. (1990) Feeding behaviour of Merino wethers under conditions similar to lot-feeding before live export. Aust. J. Exp. Agric. 30: 343-348.
8. Norris, R.T., McDonald, C.L., Richards, R.B., Hyder, M.W., Gittins, S.P. and Norman, G.J. (1990) Management of inappetant sheep during export by sea. Aust. Vet. J. 67: 244-247.
9. Norris, R.T., Richards, R.B. and Higgs, A.R.B. (1990) Research on the health, husbandry and welfare of sheep during live export. West. Aust. Dept. of Agric. Bulletin 4209.
10. Thomas, K.W., Kelly, A.P., Beers, P.T. and Brennan, R.G. (1990) Thiamine deficiency in sheep exported live by sea. Aust. Vet. J. 76: 215-218.
11. Higgs, A.R.B., Norris, R.T. and Richards, R.B. (1991) Season, age and adiposity influence death rates in sheep exported by sea. Aust. J. Agric. Res. 42: 205-214.
12. Norris, R.T. (1991) Studies of factors affecting sheep deaths during lot-feeding and sea transport. PhD Thesis, Murdoch University, Perth.
13. Richards, R.B., Hyder, M.W., Fry, J.M., Costa, N.D., Norris, R.T. and Higgs, A.R.B. (1991) Seasonal factors may be responsible for deaths in sheep exported by sea. Aust. J. Agric. Res. 42: 215-226.
14. Norris R.T., Richards R.B. and Norman, G.J. (1992) The duration of lot-feeding of sheep before sea transport. Aust. Vet. J. 69: 8-10.
15. Scharp, D.W. (1992) Performance of Australian wethers in Arabian Gulf feedlots after transport by sea. Aust. Vet. J. 69: 42-43.
16. Higgs, A.R.B., Norris, R.T. and Richards, R.B. (1993) Epidemiology of salmonellosis in the live sheep export industry. Aust. Vet. J. 70: 330-335.
17. Richards, R.B., Norris, R.T. and Higgs, A.R.B. (1993) Distribution of lesions in ovine salmonellosis. Aust. Vet. J. 70: 326-330.
18. McDonald, C.L., Rowe, J.B. and Gittins, S.P. (1994) Feeds and feeding methods for assembly of sheep before export. Aust. J. Exp. Agric. 34: 589-94.
20 Higgs, A.R.B., Norris, R.T., Baldock, F.C., Campbell, N.J., Koh, S. and Richards, R.B. (1996) Contagious ecthyma in the live sheep export industry. Aust. Vet. J. 74: 215-220.
21 Higgs, A.R.B., Norris, R.T., Love, R.A. and Norman, G.J. (1999) Mortality of sheep exported by sea: evidence of similarity by farm group and of regional differences. Aust. Vet. J. 77: 729-733.
6 ACKNOWLEDGEMENTS