PENGANTAR REDAKSI
Dalam edisi Perencanaan Pembangunan kali ini dibicarakan beragam topik-mengenai pengentasan kemiskinan. Topik-topik berkisar mulai dari peranan pertumbuhan dalam pengentasan kelompok miskin, bagaimana perubahan struktur perekonomian berdampak bagi kelompok masyarakat miskin, serta ragam inovasi yang dapat dilakukan dalam mendorong kelompok ini menjadi lebih sejahtera. Pertumbuhan, pemerataan dan stabilitas, selalu diikuti dengan perubahan ekonomi Negara. Demikian halnya, pembangunan nasional yang awalnya bertumpu pada sektor pertanian bergeser kesektor industri manufaktur. Di mana diharapkan akan terus berkonstribusi pada pembangunan yang berpijak pada pertumbuhan ekonomi, penciptaan lapangan kerja yang seluas luasnya dalam stabilitas nasional yang dinamis.
Salah satu upaya pengentaskan kemiskinan diantaranya dengan mencoba mengelaborasi potensi mobile money sebagai instrumen mendukung pengentasan kemiskinan di Indonesia. Berbekal pengalaman Kenya dalam me-utilisasi jaringan telekomunikasi, pemanfaatan mobile money dapat memberikan akses yang lebih luas bagi masyarakat miskin kepada sistem jasa keuangan.
Selain akses keuangan kelompok masyarakat miskin juga membutuhkan akses untuk mendapatkan fasilitas tempat tinggal/perumahan dan sarana air bersih. Pemerintah sudah seharusnya memberikan layanan publik termasuk penyediaan tempat tinggal dan air bersih utamanya bagi kelompok masyarakat miskin. Hal ini merupakan keniscayaan yang harus tercukupi bagi seluruh anak bangsa yang mendiami seluruh pelosok Nusantara mulai dari Sabang sampai Marauke.
Demikian halnya untuk mewujudkan memakmurkan anak bangsa, potensi sinergi antarinstansi Pemerintah dalam implementasi kebijakan kewirausahaan pemuda perlu dioptimalkan. Hal tersebut diperlukan karena sampai saat ini potensi sinergi antarinstansi belum terealisasi optimal, terutama pada fokus intervensi program kegiatan wirausaha muda dalam pengentasan kemiskinan, termasuk pembekalan pendidikan dan pelatihan ketrampilan usaha bagi pemuda yang tidak mampu melanjutkan pendidikannya ke yang lebih tinggi.
Saat ini salah satu tantangan terbesar dalam pengentasan kemiskinan adalah mengkapitalisasi reformasi birokrasi yang dilaksanakan Pemerintah. Bahwa reformasi birokrasi dapat menjadi hal yang sia-sia jika syarat perlu reformasi tidak tersedia. Bila reformasi birokrasi lebih sebagai isu politis ketimbang isu teknis, maka diperlukan keinginan politis, kelayakan politis, dan kredibilitas politis. Reformasi secara sederhana dapat dimaknai sebagai transformasi menuju situasi yang lebih baik. Apakah reformasi birokrasi saat ini telah membawa bangsa ini menuju sesuatu yang lebih baik? Atau jika secara spesifik dikaitkan dengan pengentasan kemiskinan apakah reformasi birokrasi telah mendorong terjadinya transformasi menuju perbaikan dalam pengentasan kemiskinan?
PRO-POOR GROWTH:
Does it work in Indonesia?
Riya Farwati*
Abstract
The main purpose of this study is to examine whether economic growth in Indonesia is categorised as pro-poor growth. It will be analysed through how economic growth afects poverty. To address this research, we will conduct the study using panel data. It consists of province-level data from 2004 - 2010 to estimate an econometric model that allows us to know the impact of economic growth, inequality, government spending, and iscal capability on poverty rate. Therefore, the set of control variables consists of the Gini coeicient, per capita Gross Regional Domestic Product (GRDP), government spending, and own income resources.
The estimated results of this study have important policy implications. First, the inding shows that economic growth is good to enhance poverty reduction; government therefore should consider rising up economic growth that gives more beneit for the poor. In addition, empirical evidence suggests that the headcount ratio in Indonesia is more responsive on economic growth than on income distribution. Second, the efect of government expenditures varies for diferent type of spending. Government spending on education and health has signiicant impact on poverty
alleviation through reduced income inequality; while public expenditure on social protection is insigniicantly contribute to decrease poverty rate. Finally, the iscal capability in each province is required to enhance poverty eradication.
Further, economic growth is needed to enhance the efectiveness of poverty reduction. Moreover, sustained growth should be accompanied by encouraging in human capital investment to accelerate poverty reduction. In addition, designing and implementing pro-poor poverty reduction program should be done to accelerate poverty alleviation. Finally, this result suggests that economic growth during period 2004-2010 in Indonesia can be concluded as pro-poor growth. Keywords: Poverty, Growth, Inequality, Government Spending, Indonesia
1. Introduction
Poverty reduction and economic growth cannot be separated from development goals. In its National Medium Term Development Plan for period 2004-2009, Indonesia had applied three economic development strategies which are the ‘pro-growth, pro job, and pro poor’ strategy. At that time, it was believed that economic growth acceleration would create a high job opportunities, would bring Indonesian households free from poverty, and seemed it was used as a catalyser to reduce poverty.
In this sense, these key development goals can be analysed through an approach known as pro-poor growth. This concept expresses how much the beneits of economic growth for the poor. Dollar and Kraay (2002) mention that the growth is good for the poor when the increasing of the poor’s average income at the same rate as average overall income. Naturally, when government implements a ‘pro-poor’, ‘pro-growth’ and ‘pro job’ policies, it is not only on how to implement but also how to establish a development strategy for reducing poverty through economic growth.
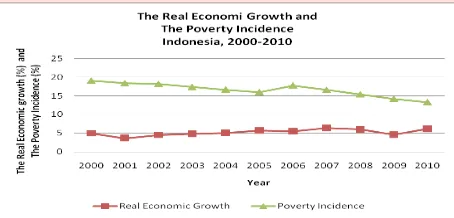
Figure 1 The Trend of Economic Growth and Poverty Incidence
Source: Statistics Indonesia (Susenas various years, BPS), 2000 is the base year
As depicted in igure 1 above, when economic growth increases, the headcount index tends to decrease. The correlation between the rate of poverty and the rate of economic growth is in the opposite trend with. Therefore, it can be argued that the luctuation of economic growth is closely related to the rate of poverty. However, it cannot be denied that the reduced poverty rate is contributed to various interventions, such as poverty reduction programs.
During 2004-2010, the data reveal that the number of the poor in Indonesia is luctuated but the trend tends to go down. In 2004, the number of the poor was 36.1 million people or 16.66 percent of total population, and in 2005, it decreased to 35.1 million people (15.97 percent). Unfortunately, in 2007, it rose up signiicantly to 39.3 million people (17.75 percent). In 2008-2010, it reduced to 15.42, 14.15, and 13.33 percent respectively. In fact, Government of Indonesia has been implementing ‘the homogenous product’ of poverty reduction program for more than 10 years to all provinces even though they have diferent characteristics. The result of those programs are vary that within the period 2004-2010 the reduction of poverty rate is about no more than 2 percent every year.
In addition, poverty reduction in Indonesia has aligned with one of the Millennium Development Goals
(MDGs) that is to reduce halve of the poor (between 1990 and 2015). An indicator used to deine the poor in MDGs is the proportion of people whose income is less than USD 1.00 a day. Indonesia has succeeded in reducing poverty levels, as measured by indicators USD 1.00 per capita per day, in half. The proportion of people living with per capita income of less than USD 1 per day dropped from 20.6 percent in 1990 to 5.9 percent in 2008. Nonetheless, the efort to reduce poverty rate as measured by the poverty line of the current national rate is still in progress. In 2010, the poverty rate was still high that was 13.33 percent.
Many studies have tried to analyze the efect of economic growth on poverty reduction or how pro-poor growth has been measured. Using diferent poverty measurements, previous researches argued that the efect of economic growth varies for diferent country. In spite of the wide literature on pro-poor growth, there is rarely attention on the role of public expenditure on decreasing poverty (Fan et al. 1999:3).
Regarding to the background explained above, this study wants to examine whether poverty reduction in Indonesia is afected by economic growth. Besides testing the efect of growth to poverty, this paper also aims to test the contribution of government expenditure to poverty alleviation. Although there are debates among economists whether economic growth can help reducing poverty, some evidence show that in some countries economic growth has a positive efect to reduce poverty rate. Pernia (2003) reveals that ‘the relationship between growth and poverty is highly country-speciic’. Moreover, he added that poverty reduction strategy is inluenced by an important factor, which is pro poor growth. However, the progress of pro poor growth depends on the intervention of state to improve the poor’s income and to reduce their vulnerability (Grimm 2007:15).
2. Analytical Framework
the higher the rate of population growth, the higher the rate of economic growth.
Conversely, the neoclassical view that justiies and reinforce the market system, the rate of saving and the capital-output ratio are determined by people’s preferences and technology. From this perspective, it could be used to analyse the implication of this theory for low-income economies. In most developing countries or low-income countries, the rate of saving is low. Most economists assume that saving is purposed for the higher of consumption in next period. The same logic applies to the poor. The poorer people have less ability to save for the future (Soubbtina 2000: 32).
Relecting from this theory, when there are low saving rate and low investment rate, then the rate of economic growth would be low. Low saving causes the needs of domestic investment that are physical capital and human capital decrease. These investments are used to increase economy’s productivity and income. It appeared to promote investment by government intervention through government planning to accelerate economic growth. However, this prescription is not always useful since some countries, such as India, Nigeria, and Ghana. Those countries have an experience that the enforcement of capital accumulation promoted by government could not accelerate high economic growth rate (Hayami and Godo 2005:139). Moreover, three main instruments used to measure the rate of economic growth might be endogenously determined by economic growth. Thus, they are no longer exogenous to economic growth (Ray 1998).
Completing the growth theory from the Harrod-Domar model, Solow assumes that the capital-output ratio is endogenous, and it depends on capital and labour endowment. Another way of viewing this is that capital accumulation is not the engine of development. Therefore, in the Solow model, an increasing in the saving rate will push capital and output to a higher-level while in the Harrod-Domar model, the saving rate has growth efects. Based on Solow growth model and Harrod-Domar model, it seems that capital accumulation, technology, innovation, knowledge are important in increasing economic growth. However, they still cannot answer why some countries have a high economic growth while others have low economic growth. Hall and Jones stated that the institution and modern growth economy introduce the role of institution and government policy as important elements involving to economic performance in a country. These two aspects are called as social infrastructure (Nallari et al. 2011:60).
Next, some scholars in diferent perspectives and interpretations released the concept of pro-poor growth. There are two concepts of pro-poor growth: relative
approaches and absolute approaches. Regarding to McKay (2007:21), the relative concept of the pro-poor growth is related to distributional pattern of growth. It can be inferred that pro-poor growth could be achieved when income of the poor increase faster than that of the non-poor, the inequality rate reduce. In other words, the inequality rate is fall. Moreover, the absolute concept of pro-poor growth is if growth could reduce poverty. Therefore, it seems that pro-poor growth explains how national economic growth improves the poor’s welfare.
Pro-poor growth is deined as when growth brings more advantages for the poor than the non-poor in economic proportionally (Son and Kakwani 2008). Moreover, Kakwani and Pernia (2000) see pro-poor growth through the trickle down approach assuming that the poor receive some beneits from the process of development relected by increasing in economic growth. They mention that to minimize the gap of income distribution between the poor and the rich, government should promote pro-poor growth strategy to ensure that beneits gained by the poor are proportionally higher than the non-poor are. Again, they reveal that growth could reduce poverty, but promoting and implementing pro-poor growth strategy would reduce the rate of poverty reduction higher. However, the deinition of pro-poor growth argued by the Kakwani-Pernia fails to provide a guidance to maximize the rate of poverty reduction because there is inconsistency assessment in which higher the rate of growth, higher inequality (Warr 2005:10).
On the other hand, Ravallion and Chen (2001:4) assume that the link between a reduction in poverty and the rate of pro-poor growth should be consistent and has the opposite direction. Ravallion-Chain’s argument leads to the conclusion that “a reduction (increase) in poverty must register a positive (negative) rate of pro-poor growth”. Still, they assume that pro-pro-poor growth measure requires “the focus axiom, whichstates that the measure is unafected byincome changes for the non-poor; the monotonicity axiom, which states that any income gain to the poor will reduce poverty;and the transfer axiom, which states that inequality-reducing transfers amongst the poor will reduce poverty” (Warr 2005:10).Further, Datt and Ravallion (1992) suggest that investigating the link between growth, inequality, and poverty can be done by decomposing the changes in poverty into two components: growth and inequality measure.
easily be made and poverty decomposition are similarly misleading (Grimm 2007:14). Shortly, we can synthesize that growth can be called as pro-poor growth when growth could bring beneits for the poor. It can be interpreted that the income of the poor increases as economic growth increases. Afterwards, increasing income of the poor would bring them out of poverty at a certain point.
Grimm and Klasen (Grimm 2007:15) highlight some policy implications regarding to pro poor growth. Firstly, agricultural sector should be included in pro-poor growth strategy in pro-poor countries and most of the poor live in rural area. Second, the progress of pro poor growth depends on the intervention of state to improve the poor’s income and reduce their vulnerability. Third, the political leadership’s dedication and the high government commitment to turn growth into pro-poor growth lead more stable pro-poor growth policies. Fourth, policies to reduce inequalities among regions and to combine regionally-targeted investment and infrastructure are needed. Moreover, Kraay (2004) mentions that there are three potential sources of pro-poor growth: (i) a high rate of growth of average incomes, (b) a high sensitivity of poverty (poverty elasticity) to growth in average incomes, and (c) a poverty-reducing pattern of growth in relative incomes (Nallari et al. 2011:70).
Success in growth and poverty reduction is not guaranteed (Farrington 2006). He mentioned that it can be threatened by several factors, such as slowing the global economy, changes in international trade and investment climates, or rapid rises in the prices of primary commodities (especially energy). In addition, Besley (2006) suggests that there are some factors that must be known to implement pro poor growth in developing countries. The factors are (i) the labour regulation, which has been identiied as an important element of the investment climate; (ii) access to inance, which can enable people to end the poverty by facilitating small businesses and other non-agricultural activities; (iii) human capital, as a key for increasing pro-poor growth; (iv) land reforms to increase security of tenure and abolish intermediaries have been central for reducing rural poverty; and (v) gender inequality in literacy.
In conclusion, deinitions of pro-poor growth vary, but they generally correlate how the mechanism of economic growth on poverty reduction, even somehow it is linked to inequality component. To simplify, the change in the level of poverty measure is an outcome to be achieved, whereas the economic growth and change in the income distribution are processes (Timmer 2004:178).
3. The Poverty, Income inequality, and Economic Growth in Indonesia
Government of Indonesia have established and implemented several policies to boost economic growth, to reduce unemployment, and to reduce poverty. Those policies are stipulated in President Instruction (Instruksi Presiden-Inpres) Number 6 year 2007 about the acceleration of the development of real sector and the empowerment of small and medium enterprises (SMEs). The instructions includes: 1) improving investment climate, 2) reforming inancial sector, 3) accelerating infrastructure development, and 4) empowering SMEs.
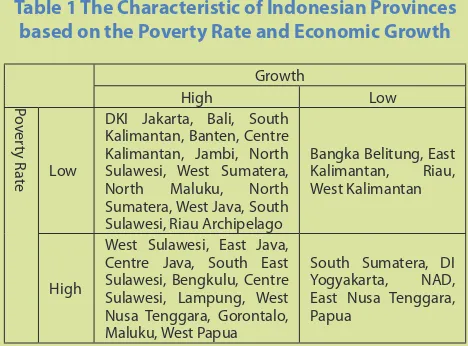
Table 1 The Characteristic of Indonesian Provinces based on the Poverty Rate and Economic Growth
Growth
DKI Jakarta, Bali, South Kalimantan, Banten, Centre Kalimantan, Jambi, North Sulawesi, West Sumatera, North Maluku, North Sumatera, West Java, South Sulawesi, Riau Archipelago
Bangka Belitung, East Kalimantan, Riau, West Kalimantan
High
West Sulawesi, East Java, Centre Java, South East Sulawesi, Bengkulu, Centre Sulawesi, Lampung, West Nusa Tenggara, Gorontalo, Maluku, West Papua
South Sumatera, DI Yogyakarta, NAD, East Nusa Tenggara, Papua
Table 2 above tells the condition of the rate of poverty and growth in Indonesia. The criterion of high and low growth is calculated based on the average of economic growth in the period 2006 – 2010, which is 5.2 percent. If a province has economic growth above 5.2 percent in 2010, it is categorized as having a high economic growth, and vice versa. Then, similar to the criteria of high and low poverty rate, it is calculated based on the average of the incidence of poverty during 2006-2010 which the average is 15.4 percent. A province with the poverty incidence below 15.4 percent is characterized as having a low poverty rate, and vice versa. Then, the thirty-three provinces are divided into four groups: (i) low level of the rate of poverty incidence with low economic growth rate; (ii) low level poverty rate that experienced with the high growth rate; (iii) high rate of poverty with high rate of economic growth; (iv) high rate of poverty rate and low rate of economic growth. Indeed, provinces in-group which have low rate of poverty and high economic are assumed as the best category.
inequality of income that is indicated by the Gini Ratio tended to rise up from 0.33 to 0.38. This condition can explain why the estimated result suggests that the Gini Ratio is not signiicant to reduce poverty (see more on Chapter 4). The income inequality in Indonesia is categorized as medium inequality due to a coeicient ranging between 0.35 and 0.501.
Figure 2 The Trend of Poverty and Gini Ratio, year 2004-2010
Source: Statistics Indonesia (various year)
As illustrated in igure 8 below, in 2010, provinces are scored the income inequality ranging between 0.29 and 0.43. Most of the provinces have the Gini coeicient value between 0.3 and 0.37. The variation of inter-provincial distribution of consumption is caused by several aspects, such as geographical condition, natural resources endowment, population growth in each province, and also industrial development. Furthermore, the variation shows insigniicant diference of trend over time across provinces.
Figure 3 Inter-regional Inequality in Indonesia, 2010
Source: Statistics Indonesia 4. Research Methodology
In the period of the 1980s, most developing countries promoted economic development to attain high economic growth. At the same time, poverty
1see: http://www.apim.edu.vn/useriles/ile/ Canhpercent20Docs/Topicpercent203.pdf
reduction is one of development goals. Therefore, some scholars believe that economic growth can be used as a tool to reduce poverty. Despite the important role of economic growth on poverty alleviation, the large amount of attention of the issue for policy makers has addressed some discussion. The discussion such as: (i) how large the impact of economic growth to combat poverty, (ii) what are the channels explaining the efect of economic growth to reduce poverty could be attained, and (iii) what is the mechanism examining the link between growth and poverty.
The focus of this paper began with the current issue about the relationship between economic growth and poverty. The paper is motivated by the needs for policymakers to determine fund resources and the allocation of public resources to inance government spending (Sarris 2001). In addition, theoretically it is indeed the case that growth of diferent economic sectors has a heterogeneous efect on poverty.
Basically, the model to estimate the impact of economic growth on poverty can be written as:
dP =α + β y + ε ... (eq. 1) where P refers to the poverty rate; dP refers to the change in poverty rate; y represents the rate of economic growth; ε is the error term; and α and β are the parameters to be estimated. Existing literatures have debated the measurement of poverty used to assess the impact of growth on poverty.
However, analyzing the connection between growth and poverty cannot be separated from income distribution among the people in an economy. Therefore, we consider putting inequality measures in the model. Nonetheless, economic growth and income inequality are not suicient to explain poverty reduction. Yao (2005: 183) mentions some factors determining or afecting the incidence of poverty. They are income growth, inequality, openness, economic structure, infrastructure, education, location, topography, gender, and rural industrialization. This paper is therefore formulating the model to measure the efect of economic growth, inequality, public expenditure, and regional capacity on the poverty incidence.
... (eq. 2) Next, the Bourguignon theory assumed that a pro poor strategy could be achieved through an inequality reduction. Thus, this paper will add the interaction of the Gini coeicient with government expenditure on education and health and the interaction of the Gini coeicient with social protection expenditure. The idea of this speciication is that we want to know the efect of human capital investment and social protection spending via the inequality measure. Moreover, by adding interaction terms in a model, we can explore the relationship among the variables more comprehensive. Hence, the model can be written as:
...(eq. 3)
where,
Pit : The natural log of the poverty rate in province i during period t
Yit : The log of per capita GRDP
gini : The log of Gini coeicient
αi : Capture province-speciic (assumed to be independent of all linear and nonlinear regressors)
µt : Period-speciic random efects (assumed to be independent of all linear and nonlinear regressors)
uit : A random (e.g shock)
Xit : A vector of additional control variables, consist of:
the log of government expenditure on education and health
the log of government expenditure on social protection
the log of own income sources
δ1 : The interaction of the log of the Gini coeicient and the log of government expenditure on education and health
δ2 : The interaction of the log of the Gini coeicient and the log of government expenditure on social protection
5. The Empirical Results
To examine the impact of growth on poverty, the headcount index as a relection the proportion of people living below poverty line will be a dependent variable, and other control variables in the right hand side as explanatory variables. Control variables determining the poverty rate are lagged growth, government spending (relecting human capital investment), and the Gini coeicient (inequality measure).
The results presenting in this session are estimated using the data of 33 provinces in Indonesia over period 2004-2010. Table 4 exhibits the estimated coeicient in a poverty rate equation with the set of control variables. The results lead to answer the question ‘how much does the poverty incidence change for one percentage point increase in GRDP?’ In other words, we call it the elasticity poverty to economic growth. Next question that can be explained from the result is “how does income inequality afect the change in poverty rate”, or known as the elasticity of poverty to inequality. The rest of coeicients will explain the efect of public expenditure on poverty reduction. Then, “how does regional capacity inluence the headcount index in Indonesia”. In short, not all the estimated coeicient has the expected sign.
a. The Bivariate Relationship between Economic Growth and Poverty Rate
As a irst step in investigating the bivariate relationship between growth and poverty rate, we want to know the growth elasticity of poverty. This means how much the percentage of poverty measure can be reduced when income increases by one per cent. The coeicient of per capita GRDP is signiicantly negative in all regression. The coeicient resulted by ixed efect method is higher than that of using OLS and random efect model. Using simple OLS, ixed efect model, and random efect model estimation (see table 3), the sign indicates that an increasing one-percentage point of per capita GRDP will be associated with a decreasing of the headcount index around 0.36 percent, 0.76 percent, and 0.62 percent respectively.
Table 2 The Linkage between Poverty and Economic Growth
Methods
OLS Fixed Efect Random Efect
Coeicient Standard Error Coeicient Standard Error Coeicient Standard Error
Variable
Per cap GRDP -0.357* 0.048 -0.758* 0.08361 -0.624* 0.069
Constanta 5.819* 0.424 9.349* 0.7396099 8.163* 0.618
Prob > F 0.000 0.000 0.000
R2 0.2195 0.3341 0.3341
Number of Observations 198 198 198
Source: Author’s calculation
Note: * signiicant at 1%; ** signiicant at 5%; *** signiicant at 10% However, if we only consider those bivariate
relationships, this correlation might be false. The presence of unobserved region efects does not included in this correlation. Thus, other factors could explain the characteristics of each observation. With this in mind, it determines whether the poverty-growth correlation is robust when it is explained by adding third factors determining the change of poverty rate (inequality, public spending), time and country (in term of province) efects.
b. The Model Speciication Test
After doing regression with three methods: OLS, FEM, and REM, then will decide the best model used for further analysis among those three frameworks. Software STATA will be used to investigate the estimated regression.
First, we will decide between pooled OLS and random efect framework through Breush-Pagan Lagrange Multiplier (LM) test. The result obtained show that the p-value is small enough to reject H0. Therefore, the estimation result is less biased under random efect model. Second, we conduct the Hausman test to decide between ixed or random efects. This test is to examine whether the error terms (ui) are correlated with the explanatory variables. The null hypothesis is the individual efects are uncorrelated with other explanatory variables. The results show that p-value is 0.4304 it means we are failed to reject the null hypothesis. Thus, instead of ixed efect, random efect model is favour to explain the model2. Since the result argues that the best model used to analyse this research, we do not have to test multicollinearity, heteroscedasticity, and auto-correlation3.
2 See http://dss.princeton.edu/training/Panel101.pdf 3More explanation can be seen in http://www2.sowi.uni-mannheim.de/lsssm/veranst/Panelanalyse.pdf
Table 3 Chow, Breusch-Pagan LM, and Hauman Tests
Test Chi2 P-Value Result
Breusch-Pagan LM 308.97 0.000
Random Efect
Hausman 4.16 0.7612
Random Efect
Source: Author’s computation c. Discussion
Since we have found that the best model is random efect model, thus we will report only for random efect framework4. Then, the role of economic growth on the objective of poverty reduction can be determined by knowing growth elasticity of poverty. The interpretation of the result should consider some limitations. First, this research is limited by the availability of time series data, which are short period. Second, the Gini coeicient data for year 2004 and 2006 are assumed as the same as year 2005 because Statistics Indonesia did not issue these data for those years. However, the empirical evidence proves that the low elasticity of poverty to growth in Indonesia supports the hypothesis that economic growth has reduced the poverty rate.
The Efect of Economic Growth on Poverty Reduction
It can be seen in table 5 and table 6 that growth appears to be negatively correlated with poverty rate. According to the estimated coeicient, we reject the null hypothesis at the 0.01 signiicance level for both equation 2 and equation 3. The estimated coeicients from two models are almost similar, which are (-0.29) and (-0.327). In other word, for every one percent of economic growth, 0.29 until 0.33 percent of the poor population will move out of poverty. It seems that the
regression result suggests that the poor in Indonesia has beneited from the economic growth. A good efect of economic growth on poverty in Indonesia is contributed at least by two factors. First is that the growth strategies are accompanied by poverty alleviation programs (as explained in the previous section). At least government kept maintaining the purchasing power of the poor when shocks such as an increasing oil price and global crises afecting some people to lose their jobs. Second, the growth strategy is combined with pro job strategy. It means that a rapid economic transformation should be followed by providing job opportunities especially for the poor.
The data shows that economic growth of Indonesia before crisis 1997/1998 was higher than recent economic growth. Related to poverty alleviation, the poverty rate could be reduced faster before the crisis. From these facts, various factors are likely to explain why the economic growth has small efect on poverty reduction during the research period. First, with low economic growth, employment cannot be highly absorbed. As a result, people’s incomes become lower.
Extremely, the poor face hard challenge to escape out from poverty. Second, Indonesia’s economy is more vulnerable as the impact of globalization. Moreover, the domestic economy is afected by other countries’ economy and global market. Consequently, it is diicult to sustain economic growth at a high level. As argued by Cervantes-Godoy and Dewbre (2010:16), rapid decline in poverty rate is diicult to be achieved with 4-5 percent of economic growth for most of the irst decade of the 2000s. However, they ind that before crisis, Indonesia could reduce the rate of poverty signiicantly when the national economic growth was 7-9 percent.
In analyzing economic growth and poverty reduction in Nigeria, Ijaiya et al. (2011: 152) distinguish economic growth into the initial level and the changes of economic growth. The study is conducted using a multiple regression analysis, and they ind interesting facts. They reveal that the two approaches of economic growth have diferent efect on poverty. The initial level of economic growth does not indicate having an impact to reduce poverty, while a positive change of economic growth leads to help reducing poverty measure.
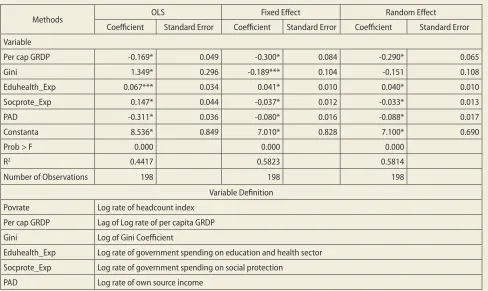
Table 4 The Estimation Result of Poverty Rate, per capita GRDP, Gini Coeicient, and Control Variables (For Equation 2)
Methods OLS Fixed Efect Random Efect
Coeicient Standard Error Coeicient Standard Error Coeicient Standard Error
Variable
Per cap GRDP -0.169* 0.049 -0.300* 0.084 -0.290* 0.065
Gini 1.349* 0.296 -0.189*** 0.104 -0.151 0.108
Eduhealth_Exp 0.067*** 0.034 0.041* 0.010 0.040* 0.010
Socprote_Exp 0.147* 0.044 -0.037* 0.012 -0.033* 0.013
PAD -0.311* 0.036 -0.080* 0.016 -0.088* 0.017
Constanta 8.536* 0.849 7.010* 0.828 7.100* 0.690
Prob > F 0.000 0.000 0.000
R2 0.4417 0.5823 0.5814
Number of Observations 198 198 198
Variable Deinition
Povrate Log rate of headcount index
Per cap GRDP Lag of Log rate of per capita GRDP
Gini Log of Gini Coeicient
Eduhealth_Exp Log rate of government spending on education and health sector
Socprote_Exp Log rate of government spending on social protection
PAD Log rate of own source income
Source: Author’s computation
The Relationship between Inequality and Poverty Alleviation
Employing OLS method for equation 2 and 3, the result shows that coeicient for gini index variable is positive and signiicant. This result indicates that the higher income inequality, the higher the poverty rate. Theory in the literatures conirms this inding. However, using FEM and REM, the coeicient for the Gini index shows opposite sign compare to the result using OLS. Besides the negative sign, Gini index also insigniicant to the poverty rate. The sign is expected to be positive and signiicant similar to OLS method result. In other words, Gini index is insigniicant to minimize the poverty rate. It could be because the income distribution gap among people in Indonesia is not quite far. In other words, the diference of income level between people living nearly above poverty line and people living nearly below poverty line are insigniicantly diferent. However, the result shows a diferent perspective from Timmer (2004). He argues that simultaneous and balanced interaction between growth and the process of income distribution is required to achieve rapid pro-poor growth.
Bourguignon (2004) states that when a country with higher rate of average income growth, low initial inequality, and where income growth is combined with lowering inequality, poverty rate would be reduced faster than other countries. In order to reduce the gap of income distribution, it is necessary that the economic policy should be considered to strengthen the capacity of poor household to involve in development. It is expected that human capital investment can grow and develop the poor with the ability to compete in economic activity. From table 6, we can see that the coeicient for the interaction variable between the Gini coeicient and government expenditure on education and health is negatively signiicant. Therefore, we can say that human capital investment helps to lower poverty through its efect on reduced inequality. In contrast, the estimated coeicient of the interaction variable between the Gini coeicient and social protection expenditure is positive and statistically signiicant. Based on those indings, we cannot say that government expenditure on social protection will reduce poverty by lowering the income inequality.
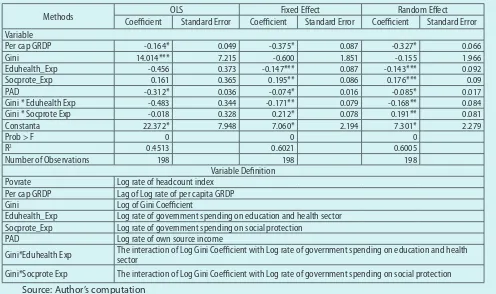
Table 5 The Estimation Result of Poverty Rate, per capita GRDP, Gini Coeicient, Control Variables, and the Interaction Variable (For Equation 3)
Methods OLS Fixed Efect Random Efect
Coeicient Standard Error Coeicient Standard Error Coeicient Standard Error Variable
Per cap GRDP -0.164* 0.049 -0.375* 0.087 -0.327* 0.066
Gini 14.014*** 7.215 -0.600 1.851 -0.155 1.966
Eduhealth_Exp -0.456 0.373 -0.147*** 0.087 -0.143*** 0.092
Socprote_Exp 0.161 0.365 0.195** 0.086 0.176*** 0.09
PAD -0.312* 0.036 -0.074* 0.016 -0.085* 0.017
Gini * Eduhealth Exp -0.483 0.344 -0.171** 0.079 -0.168** 0.084
Gini * Socprote Exp -0.018 0.328 0.212* 0.078 0.191** 0.081
Constanta 22.372* 7.948 7.060* 2.194 7.301* 2.279
Prob > F 0 0 0
R2 0.4513 0.6021 0.6005
Number of Observations 198 198 198
Variable Deinition
Povrate Log rate of headcount index
Per cap GRDP Lag of Log rate of per capita GRDP
Gini Log of Gini Coeicient
Eduhealth_Exp Log rate of government spending on education and health sector Socprote_Exp Log rate of government spending on social protection
PAD Log rate of own source income
Gini*Eduhealth Exp The interaction of Log Gini Coeicient with Log rate of government spending on education and health sector
Gini*Socprote Exp The interaction of Log Gini Coeicient with Log rate of government spending on social protection
Source: Author’s computation
The Efect of Government Spending on Education and Health to Reduce Poverty
In this paper, government spending on education and health relects human capital investment. The empirical evidence from two models shows diferent result. Using equation 2, the regression shows that the coeicient for public expenditure on education and health is positive and signiicant. In other words, we can say that public expenditure in education and health sector is not pro-poor budget policy. Conversely, the estimated coeicient resulted from model 3 is negative and it is statistically signiicant at the 0.1 signiicance level. It is explained before that the efect of education and health expenditure will reduce poverty via lowered inequality. Since the value of coeicient is low (-0.143), we can say that government spending on education and health in Indonesia is relatively low sensitive to reduce poverty. In view of this, an increase in human capital investment will contribute to reduce poverty.
This inding is similar to Fan and Zhang’s research (2008). They observed the impact of government spending on rural poverty reduction. Focusing on public expenditure on agricultural research, rural roads, education and health, the results are evident that government spending on agricultural research, rural roads, and education had an impact on a reduction in rural poverty. At the same time, the public spending on health sector did not have a signiicant impact on rural poverty alleviation. While Fan and Zhang’s study distinguish between education and health expenditure, this paper combines those two public spending. Nonetheless, the estimated result allows us to draw the conclusion that government spending on education and health in Indonesia has an impact on a reduction of poverty, but it has a small impact.
This interesting result can be elaborated as follow. First, the government spending on health and education has not been quite efective or even mis-targeting. It means that the non-poor might enjoy some of those public spending. Second, public spending on education and health should be accompanied by projects or program targeted o rise up poor household’s human capital. Third, the efect of public spending on education and health to poverty cannot be seen in a short time. Finally, the government spending on education and health are more efective when the income inequality among people is lowered.
Furthermore, the indirect efect of education and health expenditure on poverty reduction for each province might vary regarding to region speciic components to the relation between the government spending and poverty alleviation. There is also the fact predicted earlier that in the wealthiest provinces, an
increasing proportion of public spending could help their people out of poverty more successful than less wealthy provinces.
The Efect of Social Protection Expenditure on Poverty Reduction
In contrast to the efect of public expenditure on education and health sector, government spending on social protection is consistent as expected. It is found that this public expenditure is negative and signiicantly helps to decline poverty (see table 5). For ten percent increase in social protection expenditure, the incidence of poverty will decline for 0.3 percent at the 0.05 signiicance level. Therefore, it can be argued that public spending can directly reduce poverty without reducing income inequality. The estimated coeicient resulted in this study is similar to Ferreira et al.’s observation (2010). Using model poverty dynamic over two decades (1985-2004), their inding suggests that social protection expenditure in Brazil declined the incidence of poverty. It is explained in their paper that in early 2005 Brazil expanded and redistributed large social protection system as mandated by the 1998 constitution. They seem to be claiming that this mandate brought a good impact on poverty.
Notwithstanding, if we add the interaction term between social protection expenditures and the Gini coeicient as captured in equation 3, the coeicient of this variable becomes signiicantly positive. The result is not like education and health expenditure, which is signiicantly negative. It can be explained that social protection expenditure is not a systematic expenditure. The use of social protection is not targeted and the recipient is not only the poor. Moreover, this spending is likely to be inluenced by political interest. Moreover, Social protection mostly is allocated for disaster relief, and it is not paid regularly to the poor. Thus, it is considered that social protection does not help to reduce poverty.
These following factors might explain the indings. First, the distribution of this kind of spending can be considered as ineicient or not well targeted. It can also be regarded as non pro-poor budgeting. In the second place, the mechanism of social safety net in Indonesia has not well established yet. Next, the amount of social protection budget and the social protection coverage is relatively low, thus the efect of this spending is not signiicantly minimize poverty.
target related to the allocation of this expenditure, and build a better mechanism in order to reach the goal that is to reduce poverty.
The Efect of Own Source Income on Poverty Reduction
Identifying the coeicient of variable own income resource, it is found that the coeicient is negative and signiicantly afecting poverty reduction. It shows that for every ten percent of economic growth, the incidence of poverty will decline for about 0.85 (see table 5) until 0.88 percent (see table 6). Regarding to Law No.32 year 2004 about Local Government, there is supposed to be a strong relationship between decentralization and poverty alleviation. The estimated coeicient is strengthening this statement. The law mentions that local government has been given authorizations that are supported by own income resources and centre-region iscal transfer. Regional autonomy also provides lexibility to local government for planning, executing, controlling, and evaluating development policies. In the decentralization era, local government is required to take a role on accelerating to attack poverty.
To sum up, poverty rate can be reduced by maximizing growth, while the Gini coeicient shows insigniicant value which means that the Gini coeicient does not signiicantly contribute to reduce poverty rate. The fact shows that in Indonesia, growth has actually elevated income inequality. In addition, when analysing the variation of growth efect on poverty alleviation across provinces, the results are varies. The initial level of inequality, the initial poverty rate, and the capability of local government on enhancing growth are associated to the poverty-growth elasticity for each province. Therefore, the speed of poverty reduction in term of absolute poverty measure depends on the rate of average income growth, the initial level of inequality, and the changes in the level of inequality (Ravallion 2004). In Addition, the implementation of decentralization brings a consequence that each province should be responsible to promote its economic growth. It is assumed that all regions have given the same poverty reduction programs from central government. That is why the impact of growth on poverty reduction varies among regions. It seems that diferent initial condition or diferent growth pattern will not lower poverty rate equally.
6. Conclusion
This paper attempts to investigate the link between the goals of development that is poverty reduction and the indicator of development (growth). The analytical
answer is important to know whether the progress of development gained is bringing beneit for the marginalized or poor people. Regarding to this aim, this paper begin with a simple framework to know the connection between growth and poverty. After that, additional elements are added as indirect way to reduce poverty.
In general, this paper concludes several things. First, an increase in economic growth and an income inequality reduction are good for the poor. Second, empirical evidence suggests that the headcount ratio in Indonesia is more responsive on economic growth than on income distribution. Third, the efect of government expenditures varies for diferent type of spending. Finally, the iscal capability in each province is required to enhance the reduction of poverty.
The empirical evidence proves that the link between economic growth and poverty alleviation are negative relationship. It indicates that a better economic performance, which is represented by economic growth, brings to an increase in the poor’s welfare, which is relected by lower number of the poor. Based on data, the realization of economic growth in the period 2003-2008 is around ive per cent. The fact reveals that it is inadequate to catch up the largest number of Indonesia’s population to gain the economic growth. However, although the role of economic growth on poverty reduction has a signiicant contribution, it is undoubtedly that economic growth matters in the economy as one of development indicator. Thus, economic growth is good for the poor but it is not suicient (Kraay 2006). In other words, economic growth is not the only tool to realize the objective of poverty reduction, but government interventions are also required to accelerate poverty eradication.
budget, it is not only the matter of increasing public expenditure of education and health sectors, but also expanding and distributing basic education and basic health services to the poor.
Related to social protection expenditure, the government spending on this sector is signiicant to reduce poverty. Therefore, government should give more attention on targeting especially in this public expenditure to accelerate poverty alleviation in the future. In addition, a well designed of social protection system might be an efective tool and a key role to reduce poverty. Additionally, Ferreira et al. (2010)pointed out the important argument that is the expansion of social security and social safety net could be driven through an increase in coverage and an increase in the average beneit levels. Analysing the efect of iscal capability, it is found that the higher the own resource revenue, the lower the poverty rate.
A good impact of an economic growth to reduce poverty or to raise pro poor growth can be achieved through several strategies. It can be categorized into two iscal policy and monetary policy strategy. Firstly, iscal policy, it can be translated into pro-poor budgeting and social spending. In order to help the poor to improve their health and education, resources to provide physical, social, and intellectual infrastructure should be allocated by government. The second is
through monetary policy, which can be channelled through micro-credit programs that are given to the poor. The programs are expected as a mechanism to create job opportunities for everyone. In the future, it could be the main avenue for reducing income poverty and achieving pro-poor growth. As suggested by Jaiya et.al (2011), Macroeconomic stabilization relected by country’s iscal and monetary policies is essential to support investment climate. That investment is expected to increase the productivity, and it further brings beneit for the poor and non-poor.
MOBILE MONEY AS AN INNOVATIVE POVERTY
ALLEVIATION INSTRUMENT
Rahmawaty, Anna N *
I. Introduction
It is no secret that access to capital and inancial services can improve the lives of citizens and the operations of small businesses, yet millions of individuals and businesses are excluded from even the most basic inancial services. The lack of good inancial options is undoubtedly one of the reasons why poor people are trapped in poverty. They cannot sustain or even aspire to higher income because they are not able to invest in better farming tools and seeds to enhance their productivity, start a microenterprise, or even take the time to search for better paying employment opportunities (Mas and Radclife, 2010). Most of the poor do not have access to formal inancial service and sufer the most during economic shocks. They have diiculty in reaching traditional bank because geographic distance, bureaucratic nature of banking services and misconception regarding the inability of the poor to repay their loans (Hinson, 2011).
On the other hand, an inclusive inancial system not only has the potential of raising millions of people out of poverty, but also can foster a more
sustainable economy that is resilient to the efects of economic crises. There is substantial evidence linking inancial services with economic growth and decreases in both income inequality and poverty rate. Financial development reduces income inequality and alleviates poverty rate (Beck and other, 2008). The aggregate usage of inancial services appears to reduce Gini coeicients –measurement of income inequality--. Financial service has a strong positive efect on rural poverty (Pande and Burgess, 2005).
Besides that, the G20 group of countries endorsed the concept of innovative inancial inclusion for poverty alleviation. One way to reach the poor in developing country to the inancial service is mobile money since the cash is the major barrier of inancial inclusion. For users in the developing world, the appeal of m-banking/m-payments systems may be less about convenience and more about accessibility and afordability (Hinson, 2011).
The objective of this article is highlighting mobile money for poverty alleviation, the success story in Kenya and its prospects in Indonesia. The article, therefore, is set as follow: the irst section provides introduction inancial inclusion for the poor; the second * Rahmawaty, Anna N is a Junior Planner at Directorate of
section explores the meaning of mobile money; the third section reviews the best practice mobile money in Kenya; the fourth section discusses prospects of mobile money in Indonesia to alleviate poverty rate; and the inal section conclusion.
II. What is mobile money?
Since 2000, the number of mobile phone subscriptions increases each year. In 2010, there are around ive billions mobile phone subscriptions worldwide (ITU, 2011). The spread of mobile phones across the developing world is one of the most remarkable technology stories of the past decade (Donner and Tellez, 2008). Mobile phone connects among people as well as shares information easily. Mobile phones, by virtue of their role as carriers and conduits of information, ought to lessen the information asymmetries in markets, thereby making rural and undeveloped markets more eicient (Abraham, 2008).
Mobile handsets ofer variety of facilities, from sophisticated to basic function – call and text messages--. The prices of mobile handset divers from the expensive ones to the cheap ones. Therefore, the costumers have broad choices. Moreover, the price of mobile service airtime continues to fall. The poor aford to buy the most basic function mobile handset and become mobile phone subscription.
Graph 1: Mobile Phone Subscription Worldwide, 2000-2010
Source: International Telecommunication Union (ITU), 2011
Mobile money has been an innovative invention of bringing inancial services to all people. Mobile money application works through text message/ short message service (SMS). Mobile money ofers a
means to reach the unbanked people. It allows them to establish and access savings accounts, store value in their handsets, transfer funds to family members, and even access credit or insurance products. All transaction occurred are authorized and recorded using secure SMS in real time basis.
Mobile money makes inancial services convenient for customers, especially in rural areas and lowers the cost of business for commercial banks. Mobile money provides lower transaction cost than other alternatives such as physical transport, physical recordkeeping, and other costs. Furthermore, mobile money platforms can typically support millions of subscribers and transactions per day and are easily scaled.
The Philippines, South Africa, and Kenya are some countries which have applied mobile phone to provide inancial services. Kenya has the most successful mobile money worldwide so far.
III. Best Practice: M-PESA Safaricom in Kenya
M-PESA is a mobile money application by Safaricom of Kenya. It was launched in 2007. The M-PESA’s customers reached 9 million (out of total population 38 millions) or 40 percent of Kenya’s adult population in 2009 and this number is growing. In 2011, M-PESA is being used by more than 14 million customers.
The customers use M-PESA to pay everything, such as electricity bills, school fee, grocery, and other daily expenses. They can use M-PESA anytime, day and night. Through the M-PESA software, customers can transfer money from mobile accounts on their phone handsets for others to access (Hayward, 2010). M-PESA has given good impact for its customers. The incomes of Kenyan households using M-PESA have increased by 5-30 percent since they started mobile banking, according to a recent study (The Economist).
The successful of M-PESA is contributed by some factors. Mas and Radclife state three sets of factors M-PESA’s market success:
channels, and a mobile communications market characterized by Safaricom’s dominant market position and low commissions on airtime sales.
2. A clever service design that facilitated rapid adoption and early capturing of network efects. Safaricom had to design M‐PESA in a way that helped people grasp immediately how they might beneit from the service, removed all barriers that might prevent people from experimenting with the service; and fostered trust in the retail outlets who would be tasked with promoting the service, registering customers, and facilitating cash‐in/ cash‐out services.
3. Business execution strategies that helped M‐PESA rapidly reach a critical mass of customers. The strategies are Safaricom made signiicant up‐front investments in building a strong service brand for M-PESA and leveraged efectively its extensive network of airtime resellers to build a reliable, consistent retail network that served customers’ liquidity needs.
According to the players, the Bank Regulators, Agents, and Donor take its own role in M-PESA’s success achievement. For the Bank Regulators, The Central Bank of Kenya, is in the process of inalizing regulations that will allow non‐bank outlets and platforms such as M‐ PESA as a channel for formal deposit‐taking. Moreover, the broad and dense network of over 16.000 agents across Kenya makes M-PESA’s successful. These agents provide the retail interface and are like small banks for the consumers. And the Donor, UK Department for International Development (DfID) has a role in spotlighting the need for mobile payments and funding the early risk demonstrate.
IV. The Urgency Mobile Money in Indonesia
In Indonesia, it is estimated that there are nearly 160 million unique mobile telephone subscribers, with numbers still growing (USAID, 2011), yet many of these people, who mostly live in rural areas, do not have access to a bank account. In 2011, the gap between those with telecommunications access and those with formal inancial services access is approximately 100 million (USAID, 2011). Moreover, there are six mobile telephone service providers. Each of them expands service coverage area and tries to cover whole Indonesia’s area, even to the remote areas.
Mobile money is crucial to Indonesia as providing services throughout the archipelago and in remote areas is challenging, a country where 63 percent of the population lives in rural areas (BPS, 2011). The transportation cost from resident to bank is quite expensive, particularly for those who live away from the main islands. In fact, the cost of transport may be larger than the banking transactions. Therefore, households who live away from the main islands are more than twice as likely not to have a bank account as those in more central area, especially for those living where more costly water transport is involved.
The unbanked people in rural areas are left to choose moneylenders for accessing money. These lenders come to the poor houses ofering credit facilities with very high credit interest rates. Numerous poor people end up with very high debts to the moneylenders, which they cannot aford to repay. Mobile services would provide similar services at more competitive rates, thereby eliminating such services. Moreover, mobile money would make easier to transfer money, particularly for those work in big cities and have families live in remote areas.
Mobile money also would make Government of Indonesia’s poverty alleviation programs, such as Direct Cash Transfer/BLT, more efective. In implementing BLT program, the postal service acts as an institution for distributing the cash to the targeted groups. Receivers of cash transfer must queue in postal service oices. The distribution process is not eicient because receivers pay transportation cost, have to wait for hours in hot crowded facilities, and are at risk of being robbed. On the other hand, using mobile money, the receivers do not have to stand in the line to get the cash. And they can spend the money right away.
V. Conclusion
Mobile money makes people, particularly the poor ones who live in remote areas, can access inancial services. So far, M-PESA of Safaricom in Kenya has been the most successful mobile money application worldwide. It is proved that M-PESA’s customers’ incomes are increased since they started using the application.
poor as well as for businesses and farmers to conduct transactions.
--o0o--Rahmawaty, Anna N. is a Junior Planner at Directorate of Evaluation of Performance Sectors Development, National Development Planning Agency (Bappenas). The writer is thanking to Brian Dusza.
References
Abraham, Reuben. 2007. “Mobile Phones and Economic Development: Evidence From the Fishing Industry in India.’ Information Technologies and International Development Vol. 4, No. 1, pp. 5–17.
Aker, Jenny C and Isaac M. Mbiti. 2010. “Mobile Phones and Economic Development in Africa.” The Journal of Economic Perspective Vol. 24, No. 3, pp. 207-232.
Badan Pusat Statistik
Donner, Jonathan and Camilo Andres Tellez. 2008. “Mobile banking and economic development: Linking Adoption, impact, and Use.” Pre-publication draft. Asian Media and Information Center
Hayward, Chloe. 2010. “Kenya: M-PESA Miracle.” n/a.
Hinson, Robert. 2011. “Banking The Poor: The Role of Mobiles.” Journal of Financial Services Marketing, suppl. Special Issue: Financial Services for the Poor 15, pp. 320-333.
International Telecommunication Union. 2012. http:// www.itu.int/ITU-D/ict/statistics/
Jack, William., Suri, Tavneet and Robert Townsend. 2010. “Monetary Theory and Electronic Money: Relection of Kenyan Experience.” Economic Quarterly Vol. 96, N0. 1, pp 83–122.
Joseph, Michael. 2011. “Bringing Mobile Money to the World.” The World Bank.
Mas, Ignacio and Amolo Ng’weno (2010). “Three keys to M‐PESA’s success: Branding, channel management and pricing,” unpublished, January.
Mas, Ignacio and Dan Radclife. 2010. “Mobile Payment go Viral: M-PESA in Kenya.” n/a.
The Economist. Sept 2009. “The Power of Mobile Money.”
http://www.economist.com/ node/14505519 USAID. 2011. “Accelerating Mobile Money in Indonesia
DAMPAK PERUBAHAN STRUKTURAL SEKTOR
PERTANIAN TERHADAP KEMISKINAN DAN
KESEMPATAN KERJA DI INDONESIA
Roni Dwi Susanto, Harianto, Mangara Tambunan dan Priyarsono
ABSTRACT: In the process of economic growth in Indonesia, the agricultural sector’s contribution to Gross Domestic Product and employment declines in relative manner. The occurrence of this structural change was due to the development of the economic base from that originally relied on the primary sector (agriculture) to industry or services. The purposes of this research are: (1) to analyze the trend of the structural changes in Indonesian agriculture sector and to determine its inluencing factors, and (2) to analyze the impacts of the structural changes in agriculture and economic growth on employment and the level of poverty in Indonesia.
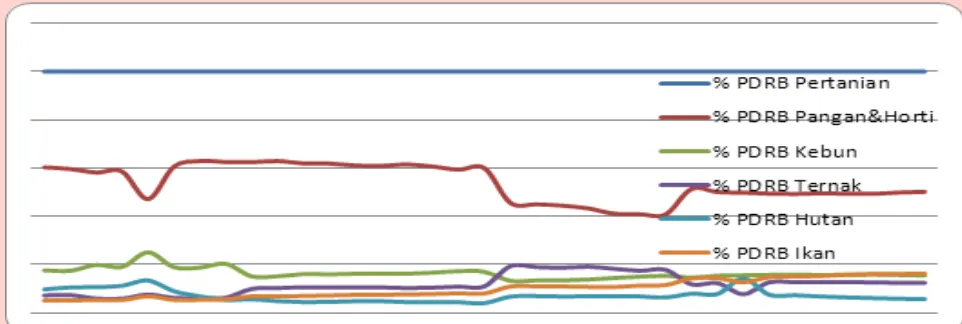
The results revealed that the agricultural sector, there was a trend of change in the composition of contributions of each sub sector of agriculture (food crops and horticulture, plantation, livestock, forestry, and isheries). Decline in the agricultural sector’s contribution to the national economy was relatively no change in the percentage of workers who worked in the agricultural sector to total national labor force. However the increase in labor demand in non-agricultural sector will continue in line with the process
of structural change in the agricultural sector, where the number of people working in agriculture will decrease and the non-agricultural sector the number of employed will increase.
The creation of production values in the agriculture and non-agriculture sectors --that directly leads to an economic growth-- impacted positively in reducing poverty and increasing employment opportunities in rural and urban areas of Indonesia. The onset of inlation, however, will lead to an increase in poverty in both rural and urban areas. Keywords: Structural Changes,Economic Growth, Poverty, Employment
I. PENDAHULUAN
Pada saat krisis, sumbangan sektor pertanian terhadap PDB mengalami peningkatan paling besar dibanding sektor lainnya. Dari segi penyerapan tenaga kerja, pada tahun 2003 sektor pertanian mampu menyerap sekitar 46 persen, paling tinggi di antara sektor-sektor lain (Yudhoyono, 2004). Namun perlu * Roni Dwi Susanto adalah staf Bappenas; Harianto, Mangara
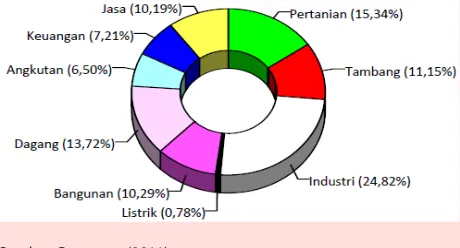
dicermati bahwa kontribusi sektor pertanian terhadap perekonomian nasional menurun sejak tahun 1969 sampai dengan 1999 (Pelita I-V kontribusi sektor pertanian menurun dari 33 persen menjadi 20 persen) dan mulai beranjak naik turun kontribusinya pada kisaran 16-17 persen dari tahun 2000 sampai akhir 2006. Pada tahun 2010 kontribusi sektor pertanian terhadap perekonomian nasional sebesar 15.34 persen, sebagaimana ditunjukkan pada Gambar 1.
Sumber: Bappenas (2011)
Gambar 1. Struktur Ekonomi Tahun 2010
Perubahan struktural sektor pertanian merupakan terjadinya perubahan komposisi didalam subsektor pertanian dan menyebabkan terjadinya perubahan kontribusi sektor pertanian terhadap Produk Domestik Bruto (PDB). Dalam perubahan struktural, faktor-faktor yang berpengaruh terhadap perubahan stuktural dalam jangka panjang, pada umumnya teknologi sebagai faktor dominan yang mengubah kecenderungan pertumbuhan ekonomi suatu negara. Di samping itu, faktor pertumbuhan tenaga kerja juga mendorong terjadinya peningkatan produktivitas dan pertumbuhan ekonomi melalui fungsi produksi (Romer, 1994).
Artikel ini merupakan bagian dari disertasi dengan judul Dampak Perubahan Struktural Sektor Pertanian terhadap Kemiskinan dan Kesempatan kerja. Penelitian dalam artikel ini bertujuan untuk:
1. Menganalisis kecenderungan perubahan struktural sektor pertanian dan menentukan faktor-faktor yang mempengaruhi terjadinya perubahan tersebut.
2. Menganalisis dampak perubahan struktural per- dampak perubahan struktural per-tanian dan pertumbuhan ekonomi terhadap pe-terhadap pe- pe-rubahan kesempatan kerja dan tingkat kemiski-nan di Indonesia.
II. KERANGKA PEMIKIRAN
Proses transformasi struktur ekonomi ke arah industrialisasi dan menigkatnya peran sektor-sektor moder (industri dan jasa) dalam sejarah pembangunan Indonesia, selain terlalu dipercepat (accelerated) dengan berbagai proteksi pemerintah, sehingga mengarah ke arah proses pertumbuhan yang tidak matang (immature), dimana sektor pertanian yang sebelumnya menjadi sektor primer kurang mendapatkan perhatian dan tidak menjamin keterkaitan pembangunan sektor modern tersebut dengan sektor pertanian.
Banyak pekerja yang ‘beralih’ dari pekerjaan di wilayah pedesaan ke pekerjaan di wilayah perkotaan sesungguhnya tidak benar-benar berpindah. Sebaliknya, pertumbuhan penduduk, peralihan struktural dari sektor pertanian, dan pembangunan berbagai fasilitas modern di wilayah-wilayah pedesaan menyebabkan desa-desa tersebut dapat digolongkan ulang sebagai wilayah perkotaan. Oleh sebab itu, ‘pertumbuhan’ wilayah perkotaan banyak yang disebabkan oleh penggolongan ulang wilayah pedesaan. Namun demikian, yang terpenting bukanlah penggolongan lokasi itu sendiri, melainkan perubahan sumber pendapatan dari kegiatan pedesaan ke kegiatan perkotaan. Memang, sejauh ini perubahan mencolok yang terjadi adalah peningkatan lapangan kerja sektor non-pertanian di wilayah perkotaan. Dalam periode yang sama, jumlah pekerja bukan penduduk miskin yang bekerja di sektor tersebut bertambah sebesar 10.5 juta, sehingga meningkatkan kontribusi sektor tersebut bagi total lapangan kerja dari 22 persen pada tahun 1993 menjadi hampir 32 persen pada tahun 2002 (McCulloch, Timmer, dan Weisbrod, 2006). Bukti jangka panjang ini menunjukkan bahwa proses urbanisasi (termasuk penggolongan ulang wilayah) dan perpindahan ke daerah-daerah perkotaan di Indonesia mungkin sama pentingnya dengan peralihan dari sektor pertanian ke sektor non-pertanian di wilayah pedesaan bagi upaya pengurangan kemiskinan.
Menurunya kontribusi sektor pertanian terhadap struktur perekonomian nasional tidak terlepas dari adanya beberapa titik lemah dalam kebijakan dan implementasi yang berkaitan dengan pembangunan ekonomi (termasuk pertanian):
kebutuhan penduduk serta kesejahteraan petani sering kali terabaikan, sehingga potensi sektor pertanian secara luas belum dikelola secara optimal.
2. Pembangunan pertanian bias perkotaan. Selama ini pembangunan pertanian cenderung lebih bias perkotaan (menguntungkan penduduk kota dan nilai tambahnya lebih banyak dinikmati penduduk kota) dan nyaris mengabaikan tujuan kesejahteraan masyarakat pertanian yang sebagian besar tinggal di perdesaan (pertanian dan perdesaan termajinalkan).
3. Bias pembangunan pada beras. Pembangunan pertanian masa lalu amat bias pada padi dan beras. Sebagian besar upaya inovasi dan pembangunan teknologi program pertanian masa lalu difokuskan pada padi dan beras, sehingga inovasi dan pengembangan teknologi bagi produk pertanian lainnya berjalan sangat lamban bahkan tertinggal. Akibatnya ketika kebijakan diversiikasi konsumsi pangan digalakkan untuk mengurangi ketergantungan pada beras, kemampuan untuk menyediakan produk pangan non-beras Indonesia tidak memadai sehingga kesempatan ini diisi oleh aneka pangan impor.
4. Lemahnya kelompok pendukung kebijakan. Kebijakan lahir antara lain karena desakan masyarakat kepada policy makers. Kebijakan akan berjalan dengan baik bila didukung oleh pemerintah yang memahami tentang makna dan tujuan kebijakan tersebut disertai kelompok pendukung kebijakan tersebut baik kelompok formal (Partai dan Ormas) maupun non-formal di masyarakat. Lemahnya peran kelompok pendukung kebijakan pertanian untuk mengingatkan ‘penguasa’ menyebabkan kebijakan diresidualkan bahkan disimpangkan implementasinya.
Memang diakui bahwa tidak mudah membangun sektor pertanian di Indonesia, mengingat petani yang jumlahnya jutaan dengan luas lahan yang relatif sempit. Bahkan ada lokasi lahan pertanian yang terpencar-pencar sehingga menyulitkan konsolidasi dan pembinaan, sarana dan prasarana yang tersedia tidak dimanfaatkan secara baik, sarana transportasi, terutama di luar Jawa, yang kurang mendukung menyebabkan biaya produksi menjadi mahal, dan masih banyak contoh yang lain. Disamping itu pertanian juga tidak terlepas dari decreasing returns in production karena dibatasi oleh ketersediaan lahan.
Terdapat 5 (lima) mekanisme keterkaitan ekonomi antara sektor pertanian dan non pertanian (Rangrajan, 1982 dalam Sipayaung, 2000) sebagai berikut, Pertama, sektor pertanian menghasilkan bahan baku bagi sektor non pertanian. Produksi sektor pertanian berupa bahan pangan dan non pangan merupakan input utama dari sektor non pertanian seperti industri pengolahan hasil pertanian dan perdagangan, restoran. Kedua, sektor non pertanian menghasilkan input yang diperlukan oleh sektor pertanian. Pupuk, pestisida, mesin peralatan pertanian dan berbagai jenis jasa merupakan hasil sektor non pertanian yang menjadi input sektor pertanian. Ketiga, sektor pertanian (rumah tangga pertanian) merupakan pasar bagi output akhir sektor non pertanian. Bahan pangan olahan, sandang dan papan serta berbaga jenis jasa-jasa yang dihasilkan oleh sektor non pertanian di konsumsi oleh rumah tangga pertanian. Keempat, keterkaitan melalui tabungan pemerintah dan investasi publik. Peningkatan investasi publik ini akan meningkatkan permintaan barang-barang modal yang dihasilkan sektor non pertanian. Kelima, keterkaitan melalui perilaku investasi swasta. Harga komoditas pertanian yang relatif rendah dan stabil, akan merangsang investasi swasta pada sektor non pertanian. Sebaliknya kenaikan harga komoditas pertanian akan mengurangi insentif investasi swasta pada sektor non pertanian. Hal ini disebabkan karena naik turunnya harga komoditas pertanian akan meningkatkan atau menurunkan biaya produksi sektor non pertanian baik melalui kenaikan atau penurunan biaya bahan baku maupun upah tenaga kerja (Sipayung, 2000).
Dengan keterkaitan demikian, pertumbuhan sektor pertanian dengan pertumbuhan sektor non pertanian secara teoritis akan saling mendukung pertumbuhan ekonomi agregat. Pertumbuhan ekonomi agregat tersebut pada gilirannya akan mampu meningkatkan kesempatan kerja dan menurunkan tingkat kemiskinan.