MONITORING AND EVALUATION OF A LONG-SPAN RAIWAY BRIDGE USING
SENTINEL-1 DATA
Qihuan Huang a,
*
, Michele Crosetto b,Oriol Monserratband Bruno Crippac
a
School of Earth Sciences and Engineering, Hohai University, JiangNing District, 211100 Nanjing, China [email protected] b
Centre Tecnològic de Telecomunicacions de Catalunya (CTTC), Geomatics Division, Castelldefels, Spain - [email protected], [email protected]
c
Department of Earth Sciences, Section of Geophysics, University of Milan, Via Cicognara 7, I-20129, Milan, Italy [email protected]
Commission III, WG III/3
KEY WORDS: SAR, Interferometry, Displacement, Long-span Railway Bridge, Structural Health Monitoring, Thermal
Expansion
ABSTRACT:
This paper is focused on displacement monitoring of a bridge, which is one of the key aspects of its structural health monitoring. A simplified Persistent Scatterer Interferometry (PSI) approach is used to monitor the displacements of the Nanjing Dashengguan Yangtze River High-speed Railway Bridge (China). This bridge is 1272 m long and hosts a total of 6 railway lines. The analysis was based on a set of twenty-nine Sentinel-1A images, acquired from April 2015 to August 2016. A dense set of measurement points were selected on the bridge. The PSI results show a maximum longitudinal displacement of 150 mm, on each side of the bridge. The displacements are strongly correlated with the temperature, showing that they are due to thermal expansion. Using the PSI results, the Coefficient of Thermal Expansion (CTE) of the whole bridge was estimated. The result agrees well with the CTE of the bridge materials. Using a regression model, the PSI-measured displacements were compared with in-situ measurements. The paper proposes a procedure to assess the performance of the movable bearings of the bridge, which is based on the PSI measurements.
* Correspo di g author
1. INTRODUCTION
Bridges are valuable infrastructures that need to be periodically monitored, to assess their health status. In this paper we consider a long-span railway bridge: the Nanjing
Dashengguan Yangtze River high-speed railway bridge. In
this bridge, two types of displacement monitoring procedure are employed. The first one is an in-situ procedure, which is
performed manually on a regular base. The second one is based on the installation of sensors to monitor the bridge displacements at each pier. Using these measurements, a
displacement model can be built to assess the health state of the movable bearings (Yi et al., 2010; ; Webb et al., 2014; Wang et al., 2016). The main limitation of this second
method is that it can only monitor the displacements in correspondence of the bridge pillars.
This work investigates the use of an alternative displacement monitoring method. It is based on the so-called
technique (Ferretti et al., 2001; Crosetto et al., 2016). PSI
has been successfully used in different applications fields, including landslide monitoring (Crosetto et al., 2013), urban
subsidence monitoring ( Tosi et al., 2016), linear
infrastructures (Lin et al., 2010), etc. In this work we
consider a particular PSI application: the monitoring of the displacements associated with thermal expansion (Eineder et al., 2009; Gernhardt et al., 2010). Several authors have
published works related to the thermal expansion of bridges using X-band data, e.g. see Crosetto et al. (2010); Monserrat et al. (2011); Reale et al. (2013); Fornaro et al. (2013); Goel et al. (2014). The innovative aspect of this work is the use of
Sentinel-1 C-band data, processing them with a simplified
PSI technique.
Section 2 provides a description of the studied bridge. Section 3 describes the Sentinel-1 data processing. Section 4
is devoted to the analysis of the PSI displacements, while Section 5 describes the estimation of the Coefficient of Thermal Expansion. Section 6 discusses the procedure to evaluate the health status of the bridge movable bearings.
Finally, Section 7 contains the conclusions of this work.
2. DESCRIPTION OF DASHENGGUAN BRIDGE
The Dashengguan Yangtze River Bridge is a high-speed
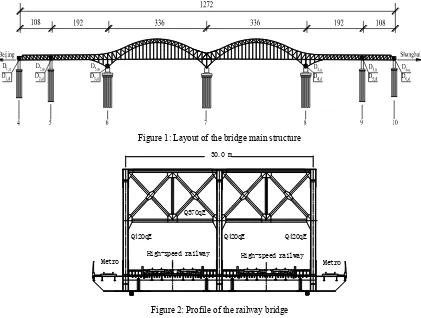
railway bridge located in Nanjing, China. The bridge is symmetric. Each part includes three segments of 108 m, 192 m and 336 m, respectively, see Figure 1. The bridge hosts 2 tracks of the Beijing-Shanghai high-speed line, 2 tracks of
the Shanghai-Chengdu railway line, and 2 tracks of the
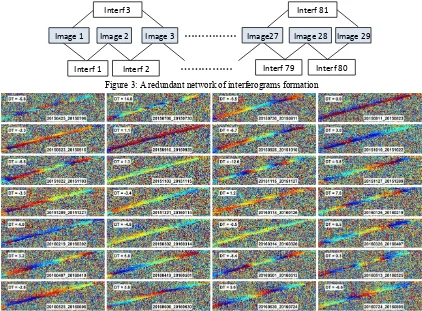
Nanjing metro. The bridge width is 30 m, see Figure 2. The bridge main structure is built using three types of steel: Q345qD, Q370qE and Q420qE. The Coefficients of Thermal Expansion (CTE) of Q345qD, Q370qE and Q420qE are 16.0E-6 /°C, 13.0 E-6/°C and 13.0 E-6/°C,
respectively. In order to adapt to the bridge longitudinal thermal dilation, the main bridge is supported by six movable bearings on each sides, named 4#, 5#, 6# on the northwest and 8#, 9#, 10# on the southeast, while a fixed bearing is mounted at 7#, see Figure 1.
Figure 1: Layout of the bridge main structure
Figure 2: Profile of the railway bridge
3. SENTINEL-1 DATA PROCESSING
This work was based on twenty-nine ascending Sentinel-1A
images, acquired between April 2015 and August 2016.
Table 1 details the dates of acquisition and the temperature during the acquisition of each image. The first image of the stack was used as super-master: the other SAR images was 30.0 m
Q370qE
Metro Metro
High-speed railway
Q420qE Q420qE Q420qE
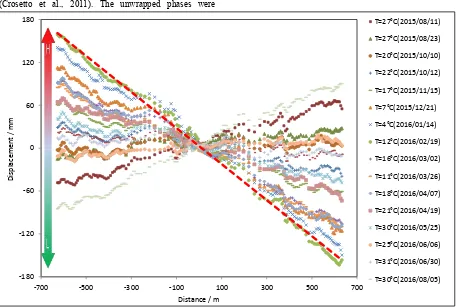
co-registered using this super-master. A redundant network
of 81 interferograms was generated, removing the topographic phase using the 3-arc SRTM DEM. A scheme of
a redundant interferogram network is shown in Figure 3. In our approach the redundancy is exploited to control the phase unwrapping errors. Figure 4 shows the twenty-eight
consecutive differential interferograms of the stack. In this figure, the dates of the image master and slave of each interferogram are indicated, as well as the temperature differences between the two acquisitions. The railway bridge shows a continuous fringe pattern. The number of fringes increases with the absolute value of the temperature difference.
We tried to used the extended PSI model proposed by
Monserrat et al. (2011). Unfortunately, the twenty-nine
images proved to be insufficient to properly estimate the
three phase components, namely the linear displacement, the
DEM error and the thermal dilation. Therefore, we use an alternative and simplified approach. Due to small size of the Sentinel-1A obital tube, the perpendicular baselines of the
interferograms are smaller than 150 m: their average value is 46 m, see Figure 5. For this reason, we considered the phase
component due to DEM error negligible. We also considered negligible the phase component due to linear deformation. We carried out the analysis by considering that the dominant component of the observed interferometric phases is due to thermal expansion (according to existing displacement measurement on the piers, see Wang et al. (2016) and Zhou (2015), the horizontal displacements due to thermal
expansion of the bridge exceed 1 dm).
No. Date T/°C No. Date T/°C
/ / . / / .
/ / . / / .
/ / . / / .
/ / . / / .
/ / . / / .
/ / . / / .
/ / . / / .
/ / . / / .
/ / . / / .
/ / . / / .
/ / . / / .
/ / . / / .
/ / . / / .
/ / . / / .
/ / .
Table 1: Sentinel-1A dataset covering the Dashengguan
Yangtze River Bridge
Figure 3: A redundant network of interferograms formation
Figure 4: Differential interferograms, dates and temperature difference
I terf I terf I terf I terf
I age I age I age
………
I age I age I age
………
Figure 5: Perpendicular baselines of the analysed interferograms
On the stack of 81 interferograms we performed the phase unwrapping. A mask covering the entire bridge was applied in order to constrain the propagation of phase unwrapping errors. In addition, we applied for the pixel selection a threshold of 0.2 on the dispersion of amplitude (Ferretti et al., 2001). A total 1828 pixels was selected at this stage. We then applied the 2+1D phase unwrapping algorithm (Crosetto et al., 2011). The unwrapped phases were
transformed into displacements and referred to a reference point located in 7#, see Figure 1. We assumed that the LOS deformation is only caused by the longitudinal displacement of the bridge. We then converted the LOS displacements into a longitudinal displacements.
4. SPATIAL AND TEMPORAL ANALYSIS OF
DISPLACEMENTS
Figure 6 shows some of the displacements measured along the bridge. The ambient temperatures of each acquisition are plotted in the legend. The reference temperature, 25°C, corresponds to the first image. In this figure one can observe that the longitudinal displacements have a strong correlation with the ambient temperature. In addition, the deformation on the two sides of the bridge is almost equal, but in opposite directions. The magnitude of the deformation increases from the bridge centre to each side. Considering the temperature of each image acquisition, the expansion and contraction of the bridge can be clearly identified.
Figure 6: Longitudinal displacements measured along the bridge. Figure 6: shows the longitudinal displacements time series
in correspondence to the 6 bridge piers and the temperature at each image acquisition time. From this plot it is patent the
seasonal pattern of the displacement variation. Furthermore, it is also clear the opposite correlation pattern between the temperature and the displacement time series that occurs on
-150
-700 -500 -300 -100 100 300 500 700
both sides of the bridge: piers 8#, 9# and 10# have a positive correlation (0.98, 0.99, 0.98), while piers 4#, 5# and 6# have
a negtive correlation (-0.99, -0.99, -0.98).
Figure 7: Longitudinal displacement time series at 6 piers and image acquisition temperatures.
5. CTE ESTIMATION
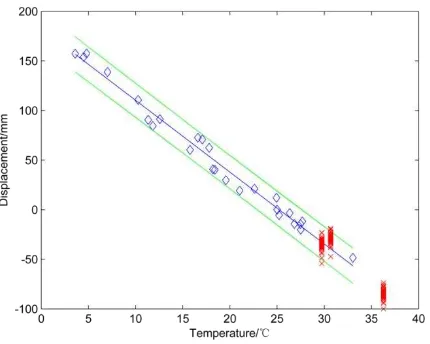
In order to estimate the CTE, we assumed that the bearings are working properly, and in particular that they do not block the free movement of the bridge. If this is true, the longitudinal displacement of the bridge should have a linear relation with the distance from the reference (the fixed bearing 7#). A line with a slope of k can be fitted to the data, see Figure 8. The CTE can be calculated as:
αCTE=Lx ∙ ∆T =dLx dLxLx∆T = �1 ∆T1
where αCTE is the calculated CTE, ∆T is the ambient
temperature difference with respect to the master acquisition, Lx is the distance of a given pixel x to the reference point, and dLx is the corresponding longitudinal
displacement. Instead of estimating CTE using just one PSI measurement, the CTE was estimated using all the available PSI points. The estimated CTE is 12.0E-6/°C. The main
truss of the bridge is built by Q420qE, see Figure 2: the estimated CTE has a good agreement with the one of the bridge material.
Figure 8: CTE of the Dashengguan bridge estimated with the 29 Sentinel-1A SAR measured displacements.
6. EVALUATION OF MOVABLE BEARING
HEALTH STATUS
The performance of movable bearings is one of the key aspects to evaluate the bridge health state. For this, it is necessary to carry out a long-term monitoring and evaluation
of the bearing state, assessing the degradation of the bearing performance, e.g. to plan repairs, replacements, etc. We propose to evaluate the movable bearing state using the PSI measurements. The first step is to compute the following linear regression model at each pier:
dL= � + � �
where dL is the longitudinal displacement at each pier, T is
the ambient temperature at the image acquisition time, and
� and � are the unknown regression parameters. Then the health state of each pier is assessed using an hypothesis testing method, which is illustrated in Figure 9. This figure shows a Control Line (CL), an Upper Control Line (UCL), a Lower Control Line (LCL) and a series of data points. The CL represents the mean position of the sample, the UCL and LCL represent the confidence interval with a given confidence. If a new sample falls between the two control lines, the sample point is considered normal. By contrast, if it falls outside the control line, it is considered to be abnormal. Let’s consider the movable bearings 4#, and two datasets: one goes from the 1st image acquisiton date to the
26th, while the other starts at the 26th image acquisition date.
Let’s assume that the bearing works well in the first period, and that our objective is to evaluate the health state in the second period. We first used the 26 images in the first period to build the linear model, see the blue diamonds and the regression lines in Figure 9. The 0.95 confidence intervals are illustrated with green lines (UCL and LCL). Considering the second period, we selected pixels around the pier 4#. The corrisponding measurements are plotted in red in Figure 9. From the same figure we can see that most of the measured displacements are in the predicted intervals. From this result we can conclude that the movable bearings at the pier 4# are working properly, with a 95% confidence interval. If the observed displacements were not within the intervals, a further analysis of the bearings would be required.
Figure 9: Analysis of the movable bearings at pier 4#. The Blue is Control Line (CL), the greens are Up Control Line (UCL) and Low Control Line (LCL). In red are plotted the
data to be tested
7. CONCLUSIONS
The thermal expansion is a significant component in steel truss bridge displacements. We have studied this component for the Nanjing Dashengguan high-speed railway bridge,
using a simplified PSI technique. Twenty-nine C-band
Sentinel-1 images have been analysed. 1828 PS points have
been selected and used for the simplified PSI time series analysis. The estimated longitudinal displacements are up to 150 mm. The displacements reveal a high correlation with the ambient temperature. In particular, they show a negative correlation (-0.99, -0.99, -0.98) at piers 4#, 5# and 6#, and a
positive correlation (0.98, 0.99, 0.98) at piers 8#, 9# and 10#. The Coefficient of Thermal Expansion of the Dashengguan bridge has been estimated using all the PSI points that conver the bridge. The estimated CTE is similar to the one of the bridge material. A procedure has been proposed to evaluate the health status of the bridge bearings, demonstrating the capability of C-band Sentinel data for the
structural health monitoring of long-span high-speed
railway bridges. This capability could be exploited to systematically monitor
long-span railway bridges over wide areas, e.g. over China.
The coverage of the Sentinel-1 imagery (240 by 180 km) is
key to achieve this goal. It is worth noting that in this study ambient temperatures were used: more accurate temperatures, directly related to the studied structure, could be acquired to improve displacement modelling and health status evaluation.
ACKNOWLEDGEMENTS
This work was supported by the National Natural Science Foundation of China (41304025). We thank Youliang Ding from Southeast University and Dejian Shen from HoHai University for their helpful knowledge of bridge health monitoring, and Nuria Devanthery, Maria Cuevas-González
and Anna Barra from CTTC, Spain, for sharing their experiences in PSI data processing. The Sentinel-1A data
were downloaded from the Sentinel-1 Scientific Data Hub.
REFERENCES
reflectors. Natural Hazards and Earth System Science, 13(4): 923-933.
Crosetto, M., Monserrat, O., Iglesias, R., Crippa, B., 2010. Persistent scatterer interferometry: potential, limits and initial C- and X-band comparison. Photogrammetric Engineering and Remote Sensing, 76(9SI): 1061-1069.
Crosetto, M., Monserrat, O., Cuevas, M., Crippa, B., 2011. Spaceborne differential SAR interferometry: data analysis tools for deformation measurement. Remote Sensing, 3(12): 305-318.
Crosetto, M., Monserrat, O., Cuevas-Gonzalez, M., Devanthery, N., Crippa, B., 2016. Persistent scatterer interferometry: A review. ISPRS Journal of Photogrammetry and Remote Sensing, 115: 78-89.
Eineder, M., Adam, N., Bamler, R., Yague-Martinez, N., Breit, H., 2009. Spaceborne Spotlight SAR interferometry with TerraSAR-X. IEEE Transaction on Geosience and Remote Sensing, 47(5): 1524-1535.
Ferretti, A., Prati, C., Rocca, F., 2001. Permanent scatterers in SAR interferometry. IEEE Transactions on Geoscience and Remote Sensing, 39(1): 8-20.
Fornaro, G., Reale, D., Verde, S., 2013. Bridge thermal dilation monitoring with millimeter sensitivity via multidimensional SAR imaging. IEEE Geoscience and Remote Sensing Letters, 10(4): 677-681.
Gernhardt, S., Adam, N., Eineder, M., Bamler, R., 2010. Potential of very high resolution SAR for persistent scatterer interferometry in urban areas. Annals of GIS, 16(2): 103-111.
Goel, K., Rodriguez Gonzalez, F., Adam, N., Duro, J., 2014. Thermal dilation monitoring of complex urban infrastructure using high resolution SAR data, IGARSS 2014, 954-957.
Lin, H.lazeJiang, L., Zhao, Q., Cheng, S., 2010. Preliminary research on large-scale man-made linear features deformation monitoring using multi-baseline differential SAR interferometry. Journal of Geo-Information Science, 12(5): 718-725.
Monserrat, O., Crosetto, M., Cuevas, M., Crippa, B., 2011. The thermal expansion component of persistent scatterer interferometry observations. IEEE Geoscience and Remote Sensing Letters, 8(5): 864-868.
Reale, D., Fornaro, G., Pauciullo, A., 2013. Extension of 4-D SAR Imaging to the Monitoring of Thermally Dilating Scatterers. IEEE Transactions on Geoscience and Remote Sensing, 51(12): 5296-5306.
Tosi, L., Da Lio, C., Strozzi, T., Teatini, P., 2016. Combining L- and X-band SAR interferometry to assess ground displacements in heterogeneous coastal environments: The Po River Delta and Venice Lagoon, Italy. Remote Sensing, 8(4): 308.
Wang, G., Ding, Y., Song, Y., Wu, L., Yue, Q., Mao, G., 2016. Detection and location of the degraded bearings based on monitoring the longitudinal expansion performance of the main girder of the Dashengguan Yangtze Bridge. Journal of Performance of Constructed Facilities, 30(4), doi: 10.1061/(ASCE) CF. 1943- 5509 . 0000820.
Webb, G.T., Vardanega, P.J., Fidler, P.R.A., Middleton, C.R., 2014. Analysis of structural health monitoring data from hammersmith flyover. Journal of Bridge Engineering, 19(6):213-226
Yi, T., Li, H., Gu, M., 2010. Recent research and applications of GPS based technology for bridge health monitoring. Science China-Technological Sciences, 53(10): 2597-2610.