DOI 10.1007/s00202-012-0270-6 O R I G I NA L PA P E R
Study on the effectiveness of lightning rod tips in capturing
lightning leaders
Muhammad Abu Bakar Sidik · Hussein Ahmad · Zainal Salam · Zolkafle Buntat · Ong Lai Mun · Nouruddeen Bashir · Zainuddin Nawawi
Received: 8 February 2012 / Accepted: 6 November 2012 © Springer-Verlag Berlin Heidelberg 2012
Abstract This paper addresses the performance of various lightning rod tips: pointed, concave, blunt, flat and conical for lightning air terminal (LAT). To observe the behaviour of the various lightning rod tips, laboratory examination was conducted under two conditions, i.e. corona emission pat-tern under quasi-static electric field and lightning impulse testing—with and without pre-ionization. The data obtained from the corona emissions were correlated to the surface sharpness area of the tip. Using dimensional analysis, it can be concluded there is strong evidence that increased surface sharpness can lead to an increase in the corona discharge current. In addition, an impulse test was conducted to deter-mine the performance of the LATs with different tip types and sizes. Using the individual and competitive test, it was found that the blunt LAT is the most recommended receptor.
Keywords Lightning protection·Corona·Electrostatic· Impulse testing·Dimensional analysis
List of symbols E Electric field
Ic Corona discharge current
M. A. B. Sidik (
B
)·H. Ahmad·Z. Buntat· O. L. Mun·N. BashirInstitute of High Voltage and High Current, Faculty of Electrical Engineering, Universiti Teknologi Malaysia,
81310 UTM Skudai, Johor, Malaysia e-mail: [email protected] M. A. B. Sidik·Z. Nawawi
Department of Electrical Engineering, Faculty of Engineering, Universitas Sriwijaya, Ogan Ilir, South Sumatera, Indonesia Z. Salam
Centre of Electrical Energy System, Faculty of Electrical Engineering, Universiti Teknologi Malaysia, 81310 Skudai, Johor, Malaysia
ε Permittivity
T Time
A The area of the tip that produces corona
d Distance
V Voltage
M Mass
L Length
Q Electric charge
1 Introduction
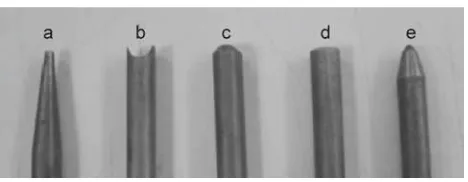
Fig. 1 Various types of LATs:astandard pointed shape,bconcave,
cblunt,dflat,econical
studies under uncontrolled conditions [6–12]. The question now is whether lightning rod tips that are pointed or blunt can effectively fulfill the same function of preventing lightning from striking buildings.
The paper describes a study that is an extension of Moore’s research, but with a different LAT tip configuration and space charge effect. The rods tested were of various shapes: the standard pointed shape, as well as concave, blunt, flat, and conical. Their performance, based on corona discharge current and breakdown characteristics such as breakdown voltage and time-to-breakdown, was examined in laboratory studies. Figure1shows the various types of LATs used in the experiments.
Standard pointed rods are widely used on Malaysian build-ings and structures as part of the lightning protection system (LPS). Therefore, it is important to consider this type of rod in this study. The standard rod has a base diameter of 13 mm tapering to 0.35 mm at the point. The tested concave rod is recommended here. The configuration of this rod is as if there are several compacted rods combined together in one rod. This concept of air termination is similar to that of twin-suspended sagging horizontal conductors, as described in BS 6651 [13]; however, the concave rod is bigger in size. It was compared to a blunt rod with a tip diameter of 0.6 mm. The co-tested lightning rod had a flat tip.
The concept of a flat-tipped rod derives from the idea of horizontal air termination for protection on flat roofs, as mentioned in NZS/AS 1768–1991 [14]. This configuration is almost similar to the concave tip. The rod acts as if there are innumerable number of small rods combined together to form a single rod. The conical rod is an idea stemming from the work of Chalmers et al. [15], who referred to the conical rod as standard. The conical rod used in this study has the same configuration as that used in Chalmers’ work and has a diamond-shaped tip.
The pre-ionization process demands a continuous corona discharge on the energized LAT tips with pre-determined length of time that is 5 min. However, it did not happen dur-ing the test instead the corona discharge at LAT tips was occurring intermittently. Therefore, this paper describes an improved and innovative method to assess LAT performance based on a corona discharge current measurement technique. However, some problems were encountered during testing.
For example, a corona discharge could not be continuously maintained at the LAT tips. This is because corona discharges depend on the level of humidity in the air. The pre-breakdown streamer heats up the air surrounding the LAT’s tip, thus decreasing the humidity. This in turn increases the air dielec-tric breakdown strength, and as a result, inhibits the develop-ment of streamers at the LAT’s tip. To overcome this problem, an air-controller system was employed.
This paper includes a description of the detailed devel-opment of a mathematical model based on the study of corona discharges on the tips of various electrodes under high-voltage direct current (HVDC) stress. The DC voltage is used to simulate the electrostatic field stress under a cloud. Thus, the lightning rod tip is under high stress and subse-quently is subjected to ionization.
2 Corona discharge current magnitude
Under the electrostatic field stress of a mature cumulonim-bus cloud that generates lightning, the stress at the tip of a lightning rod is intensified, exceeding the localized dielectric breakdown of air near the tip. Such field intensification can cause localized corona activity. The extent of corona emis-sions depends on the field intensification value and whether it has exceeded the local field breakdown. The steeped lead-ers that propagate towards the ground from the cloud base arrive on the ground surface via the final jump (critical strike distance) before the downward leader attaches itself to the upward leader (lightning return stroke). The excess space charges surrounding the rod’s tip will be attracted to the grounding, thus creating a leakage current. In this paper, the current is called a corona discharge current. The following paragraph describes the use of an HVDC to ionize the light-ning rod tip.
2.1 Experimental setup for the corona discharge
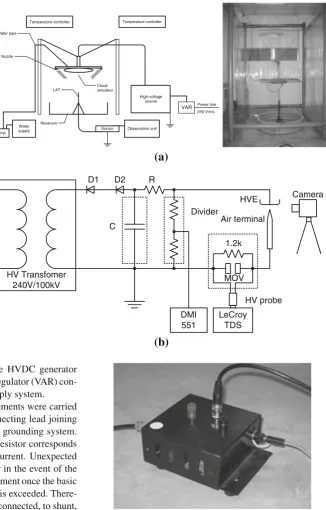
Figure2a shows a schematic of the experimental setup used to create continuous corona emissions. Briefly, the setup con-sisted of an oval aluminum high-voltage electrode (HVE) that was attached to a two-nylon string supported by a two-pulley system (TPS) extending from both sides of the HVE. The TPS facilitates air-gap clearance variation, either enlarging or narrowing the air-gap distance between the HVE and the LAT. A nozzle-type sprinkler attached to an electric pump (immersed in a tank filled with common tap water) helped to humidify the air. Figure2b shows the setup with a system to capture corona emission activity and a leakage current signature capturing system.
Fig. 2 A test system to measure the corona of a LAT:
aschematic of the controlled room;bthe experimental setup for corona emission
measurement
(a)
(b)
Temperature controller Temperature controller
Water supply Pump
High-voltage source
Sensor Observation unit Water pipe
Nozzle
LAT
Cloud simulator
Reservoir
VAR 240 Vrms Power line
HV Transfomer 240V/100kV
1.2k
LeCroy TDS DMI
551
Air terminal
Camera
HV probe HVE Divider
D1 D2
C
R
MOV
generation was used. The output of the HVDC generator was controlled using a variable voltage regulator (VAR) con-nected at the low-voltage side of the supply system.
The corona emission current measurements were carried out via a 1.2 kresistor through a connecting lead joining the tested LATs to the experimental rig grounding system. Thus, 1 V measured across the 1.2 kresistor corresponds to a 0.833-mA peak corona emission current. Unexpected breakdown of air insulation could occur in the event of the sudden flashover of the electrode arrangement once the basic lightning impulse insulation level (BIL) is exceeded. There-fore, a metal oxide varistor (MOV) was connected, to shunt, to the resistor to protect the current-measuring system. The MOV is the most common type of varistor used to protect cir-cuits against transient overvoltage. At voltage lower than its voltage pass-through, an MOV behaves like a high-resistance element, but at a higher voltage. An MOV allows a high cur-rent to flow only in one direction. An MOV operates in a way similar to diode junctions.
The measuring shunt resistance was enclosed in a metal-lic box that could effectively shield the measuring system against electromagnetic interference. Meanwhile, the corona emission signatures were captured using a LeCroy LT344L 500-MHz digital storage oscilloscope (DSO). The DSO has
Fig. 3 3-D view of the leakage current sensor
four channels used for detection and measurement purposes and a general-purpose interface bus (GPIB) port for exter-nal connection for data transfer purposes. Figure3shows the leakage current sensor box.
2.2 Experimental procedures
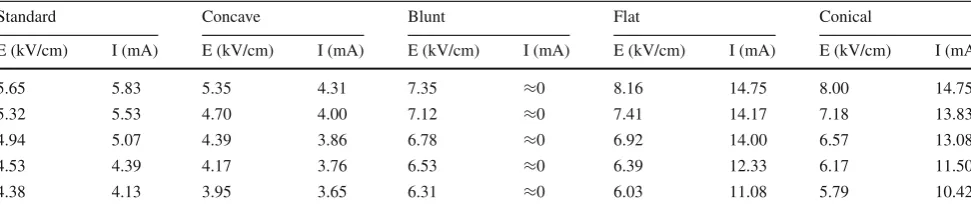
Table 1 Correlation among various LAT tips with electric field strength
Standard Concave Blunt Flat Conical
E (kV/cm) I (mA) E (kV/cm) I (mA) E (kV/cm) I (mA) E (kV/cm) I (mA) E (kV/cm) I (mA)
5.65 5.83 5.35 4.31 7.35 ≈0 8.16 14.75 8.00 14.75
5.32 5.53 4.70 4.00 7.12 ≈0 7.41 14.17 7.18 13.83
4.94 5.07 4.39 3.86 6.78 ≈0 6.92 14.00 6.57 13.08
4.53 4.39 4.17 3.76 6.53 ≈0 6.39 12.33 6.17 11.50
4.38 4.13 3.95 3.65 6.31 ≈0 6.03 11.08 5.79 10.42
according to the non-uniformity field desired so as to create more intense corona. In the case where negative DC voltage was used, three modes of corona discharges were involved: onset streamers, negative glow, and pre-breakdown stream-ers. In this case, the pre-breakdown streamer mechanism was studied. The general temporal characteristic of the discharge current was in the order of tens of nanoseconds for the front time, whereas the tail time was in the order of 100 nanosec-onds, and the pulse repetition rate was in the order of kHz.
Each differently shaped electrode was placed beneath the HV side plane electrode in turn. The output HVDC was controlled by gradually adjusting the power frequency main voltage by means of the VAR. As soon as the continuous discharge of the pre-breakdown streamer commenced, the voltage increment was stopped. At this point, the output volt-age of the resistive divider and the peak corona discharge current were observed and recorded.
2.3 Observation results
Table1shows the observation results and Fig.4shows the corona discharge patterns. The corona discharge pattern for the blunt LAT is not available, since no corona formed during the testing. The results show that the patterns depend on the shape edges. However, in this paper,Awas introduced in the effort to come up with a formula connected to corona current discharge.A is defined as the area of a tip that produces corona discharge. Figure5shows the area of the LAT tips. It is obvious that the corona discharge current will not occur on the blunt LAT, becauseAis so small that it is virtually nil.
2.4 Dimensional analysis
In engineering and science, all kinds of applications make use of the empirical results of many experiments. The obtained data are frequently very complex to present in an easily understandable way and may be difficult to interpret. In experiment-based areas of engineering, dimensional analy-sis is quite a useful procedure. Dimensional analyanaly-sis can be used to determine the relationship among physical quantities using their dimensions and can provide the general forms of
Fig. 4 Corona discharge on LAT tips:astandard,bconcave,cflat, anddconical
in a physical situation can be determined, dimensional analy-sis can be used to reveal the relationship between them [16]. This section describes the development of a mathematical model using dimensional analysis to obtain a closed loop equation. The corona discharge current (Icd)depends on a
number of parameters that have a significant contribution. The important parameters are permittivity (ε), time (T), the area of the tip that produces a corona (A), distance (d), and input voltage (V). The mathematical relationship between theIcdand the parameters can be expressed as
Icd=Icd(ε,T,A,d,V) . (1)
The six parameters in Eq.1can be represented in terms of the four fundamental dimensions: length (L), mass (M), time (T), and electric charge (Q). The dimensions are as follows:
Icd=M0L0T−1Q1 (2)
Equations (2)–(7) can be represented in a dimensional matrix below:
The rank (r)of the dimensional matrix is 4, and the num-ber of parameters (n)is 6. According to the Buckingham-π
theorem [16], the independent dimensionless products (πx)
are (n−r) = 6−4=2 with dimensionM0L0T0Q0. Taking
Icd, ε,T,Aas repeated variables, the dimensional matrix can
then be written in the form:
whereξ1,ξ2,ξ3, and ξ4 are the indices of the variables in
Eq. (1) as repeating variables.
The dimensional expressions forπ1andπ2are:
π1=Icdξ1εξ2Tξ3Aξ4d (8)
and
π2=Icdξ1εξ2Tξ3Aξ4V (9)
Since the π groups are all dimensionless M0L0T0Q0, the principle of dimensional homogeneity to equate the dimen-sions for eachπ can be used. Next, a set of dimensionless products are introduced:
π1=A−0.5d (10)
and
π2=Icd−1εT−1A0.5V. (11)
According to the Buckingham theorem, the dimensionless parameters are related by function:
φ (π1, π2)=0. (12)
Finally, the general model of a corona discharge current can be presented as:
where, Dc is the dimensionless constant that will be
deter-mined from the experiments. Assuming that ε, A, and T
would always be constant for every experiment carried out on each type of LAT, then a new dimensionless constant (Dc′)
could be obtained. Finally, the general equation for the LAT corona discharge current is
Icd=Dc′
V
d
. (14)
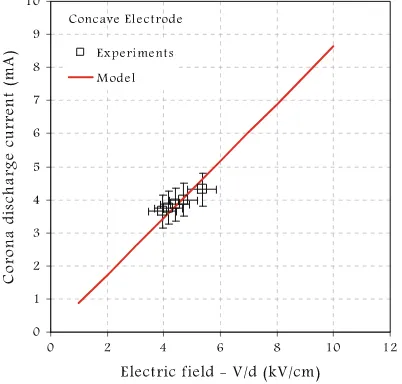
The average peak-to-peak values of the corona discharge cur-rent compare to the HV input per centimeter of electrode dis-tance and the corona discharge current model for standard, concave, flat, and conical LATs are shown in Figs.6,7,8,9. The uncertainty ranges are within±0.5 mA. A corona dis-charge current developed on the blunt LAT; however, it was so small as to be negligible. The model and the experimental results were in agreement.
To establish the correlation between the sharp edge areas and the Icdmagnitudes, the values of these two parameters
for each LAT sample are analysed at a specific electric field intensity, i.e. 6 kV/cm. The data for each sample are obtained from Figs.6,7,8,9and are mapped in Fig.10. Since the elec-tric field intensity is taken as a constant value (at 6 kV/cm) and assuming the permittivity and the time in which the measure-ments made are relatively constant, Eq. (13) can be rewritten as
Icd=Dc
εV
T d(A) (15)
where Aas an independent factor.
The relationship betweenIcdand sharp edges area based
on Eq. (15) can be sought by utilizing the “Best-Fit” algo-rithm in Microsoft Excel. Using this tool, the following equa-tion is obtained
Fig. 6 Electric field versus corona discharge current of a standard LAT
Fig. 7 Electric field versus corona discharge current of a concave LAT
Fig. 8 Electric field versus corona discharge current of flat-tipped LAT
Fig. 9 Electric field versus corona discharge current of a conical LAT
Fig. 10 Results of 6-kV/cm electric field and the corona discharge current
Equation (16) indicates thatIcdtends to rise with the increase
in the sharp edge areas.
3 Individual and competitive testing using impulses
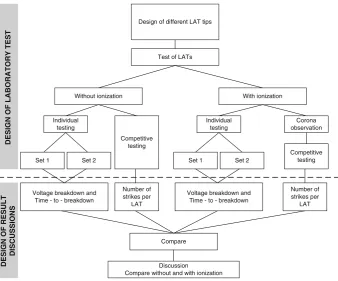
Fig. 11 Design of laboratory test and result discussions
Design of different LAT tips
Test of LATs
Without ionization With ionization
Individual testing
Competitive testing
Set 1 Set 2
Individual testing
Corona observation
Competitive testing
Set 1 Set 2
Voltage breakdown and Time - to - breakdown
Number of strikes per
LAT
Voltage breakdown and Time - to - breakdown
Number of strikes per
LAT
Compare
Discussion
Compare without and with ionization
DESIGN OF LABORATORY TEST
DESIGN OF RESULT
DISCUSSIONS
All testings were carried out in the High Voltage (IVAT) laboratory of Universiti Teknologi Malaysia (UTM) under almost similar atmospheric conditions to avoid inaccuracy. The influence of humidity (an increase in breakdown volt-age with increasing humidity) was ignored as it is unlikely to exceed 2 or 3 % over what is normally encountered in laboratories [17].
Negative voltages were applied in all experiments to make the simulation as close as possible to real lightning condi-tions. This is because most thunderstorms accumulate an excess of negative charges in their lower regions. Thus, the polarity of the induced charges on lightning rods, air termi-nals, and other objects exposed to the resulting electric fields on the Earth’s surface is usually positive [18]. The polar-ity of the charge on the tip of the conductor significantly affects the nature of the discharge. This part of experiment was intended to replicate the natural lightning phenomena in which 90 % of lightning flashes are negatively charged downward streamers.
3.1 Testing of air terminals without ionization (passive rods)
During the descent of a downward leader in real lightning conditions, there is a growing electric field in the vicinity. In the laboratory, this can be achieved by an impulse field simu-lation, which creates the actual lightning discharge caused by the descent of the downward leader. This occurs by applying
negative standard lightning impulse voltage (1.2/50µs) from
a 2 MV, 20-stage Marx generator to the gap.
The designated LATs were tested in two stages. The first stage involved testing the LATs individually to determine the performance of each LAT in non-ionized conditions by observing the voltage breakdown and the time-to-breakdown. The second stage involved arranging the LATs to compare the number of strikes. In each test, two LATs of different shapes were subjected to voltage. This is because in real lightning conditions, there are structures or objects near the ground that create competitive streamers with the LATs when the down-ward leader approaches. Another objective of the competitive testing was to further verify the results obtained in individ-ual testing. The LATs were tested individindivid-ually and competi-tively under both conditions to enable detailed comparisons. Corona formation was observed in ionized conditions during competitive testing.
3.1.1 Experimental setup and procedures for individual testing
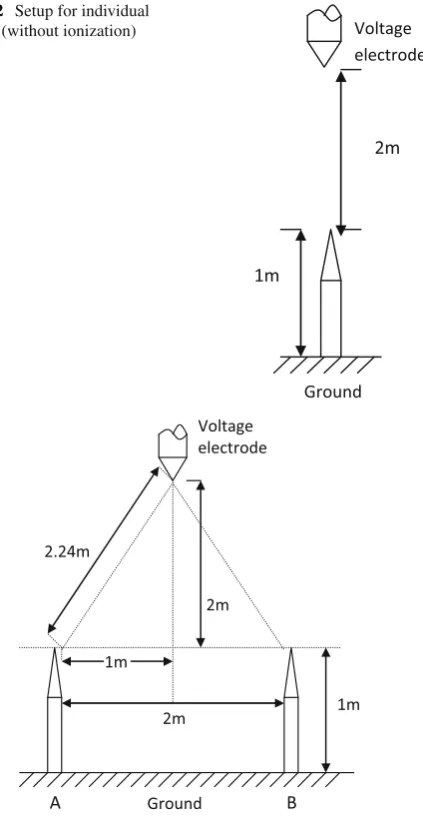
Fig. 12 Setup for individual testing (without ionization)
Fig. 13 Competitive method of testing by interchanging air terminals to determine the number of strikes per air terminal (without ionization)
The V50 obtained was converted to a digital impulse analyz-ing system (DIAS) readanalyz-ing, VDIAS, and then converted into the actual voltage breakdown value,Vactualbreakdown. The test
arrangement of air terminals is shown in Fig.12.
3.1.2 Experimental setup and procedures for competitive testing
After a series of individual tests, a series of competitive tests was carried out to investigate the competitive performance of LATs by applying the same impulse voltage breakdown to the air terminals. The LATs were arranged approximately 2 m apart from each other, with an average distance of 2.24 m. The test arrangement is shown in Fig.13.
After ten sets of data were collected, the position of the air terminals was changed (Rod A at position B and Rod B at
position A) and another ten sets of data were collected. The number of strikes per LAT over a total of 20 sets of data was recorded.
3.2 Testing of air terminals with ionisation (active rods energized by UV radiation and applied using a DC supply prior to the application of impulse voltage)
Ionized laboratory conditions were necessary in order to cre-ate an environment similar to the real lightning conditions. In the previous studies, other researchers [8] applied steady negative DC voltages to the plane to simulate the electric field beneath a thundercloud and negative impulse voltages were superimposed to simulate a growing electric field caused by the approach of a leader. However, due to the limitations of the HVDC generator in IVAT, a different method was applied to simulate ionized conditions similar to real lightning con-ditions. Testing the LATs under such conditions involved applying a HVDC to simulate real lightning emanating from a cloud, followed by the application of an impulse to simulate the lightning downward leader. Both components were neg-ative in polarity. The application of a DC and UV radiation are meant to ionize the air around the tip of the air termi-nal before the application of the impulse. The methods will be elaborated in the sections to follow. This experiment is to compare the performance of air terminal breakdown with that under non-ionized conditions. The series of experiments were carried out in two stages: individual and competitive testing.
3.2.1 DC use
Prior to the initiation of a lightning discharge, the average steady electric field at ground level increases due to the charge in the cloud above. Thus, the electric field at the tip of an exposed LAT can be expected to be higher [8]. These con-ditions can be simulated in the laboratory by applying an HVDC to an object suspended above the LAT. In this study, a horizontal rod was used. The HVDC component is also necessary to represent the relatively static field generated at ground level by the charges within the thundercloud over-head.
was sufficient to cause a visible positive corona at the rod tip prior to the application of the impulse. The reason for the 5-cm gap between the horizontal rod and the air terminal was to avoid unnecessary breakdown before the application of the impulse.
3.2.2 UV use
When a downward leader starts its propagation from the cloud towards the ground, the electric field at the ground level will increase and the maximum increase will be at the tip of the LAT. This increase will create an ionisation zone around the tip of the rod. In this zone, ionisation by elec-tron collision exceeds elecelec-tron attachment. If any elecelec-tron appears inside this zone, it will accelerate toward the LAT, causing an electron avalanche [19].
According to Ref. [20], which cites Kip’s studies of posi-tive point discharges, the onset of posiposi-tive emissions depends on the availability of free electrons in the air around the elec-trode tip. When a free electron appears in the air above an electrode subjected to a strong electric field, it would acceler-ate toward the tip, liberating the electron from neutral mole-cules. These new electrons in turn accelerate toward the tip, liberating even more electrons that leave the newly electron-deficient gas molecules behind in the form of a column of more slowly moving, positive ions. Kip found that the free electrons necessary to initiate an electron avalanche could arise from cosmic rays, radioactive emissions in the air, or the action of strong electric fields that can extract electrons from existing negative ions in the vicinity.
The availability of these free electrons around the elec-trode tip is essential for the onset of positive emissions [2]. To simulate this condition in the laboratory, the LATs in the ionization experiment were illuminated with UV rays from two 40 kW lamps. Illuminating electrodes with UV radiation causes the electrodes to emit free electrons [21].
Apart from this and according to Ref. [22], greater con-sistency in the breakdown-voltage level can be obtained by irradiating the gap. The radiation can be provided by radioac-tive material or by UV rays from a lamp to give a supply of initiating electrons that shorten the statistical time lag. In this research, UV rays from a lamp were chosen to save cost while providing similar results.
3.2.3 Impulse use
The impulse component was used to simulate the time-varying field and the growing electric field caused by an approaching downward leader. After each rod was illumi-nated by UV rays and energized by a DC for 5 min, an impulse was applied to obtain voltage breakdown using the Up-and-Down Method and the results were compared to with those derived under non-ionized conditions.
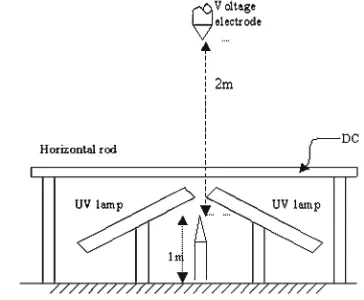
Fig. 14 Setup for individual tests (with ionization)
3.2.4 Experimental setup and procedures for individual testing
The experimental setup and procedures for this condition were somewhat similar to the non-ionized conditions. The setup and procedures were as follows. The LATs were set at 1 m above the ground; there was a gap of 2 m from the tip of the LAT to the impulse electrode; two 40 W UV lamps were used to illuminate the air terminals with UV radia-tion throughout the whole experiment to obtain a consistent emission of free electrons; an average of 37.7 kV of steady negative DC voltage was applied to the horizontal rod sus-pended 5 cm above the air terminals for a duration of 5 min to ionize (create a corona) the tip of the LAT; 1.2/50 negative impulse voltage was applied by a 2 MV, 20-stage Marx gen-erator toward the energized LAT; the Up-and-Down Method was used to obtain voltage breakdown; the voltage flashover (V50) for each air terminal was recorded using a DIAS sys-tem and converted to the actual voltage breakdown value,
Vactualbreakdown. The test arrangement is shown in Fig.14.
3.2.5 Experimental setup and procedures for competitive testing and corona observation
Fig. 15 Setup for competitive tests (with ionization)
impulse voltage was applied by a 2 MV, 20-stage Marx gen-erator toward the energized air terminal; the Up-and-Down Method was used to obtain voltage breakdown; the voltage flashover (V50) for each air terminal was recorded using a DIAS system and converted to the actual voltage breakdown value,Vactualbreakdown. Once the ten sets of data were
col-lected, the position of the air terminal was changed (Rod A at position B and Rod B at position A) and another ten sets of data were collected. The test arrangement of air terminals is shown in Fig.15.
4 Results and discussion
To analyze the test results, a step-by-step approach was applied, as shown in Fig.13. The performance of the LATs was determined using the breakdown voltage and the time-to-breakdown obtained from individual tests. The number of strikes per LAT obtained from the competitive tests further substantiates the performance of the LATs. The results of both conditions are compared and discussed below to deter-mine which laboratory condition better represents real light-ning conditions.
4.1 Without pre-ionization (non-ionized condition)
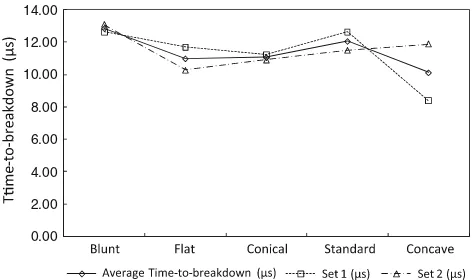
In non-ionized condition, the LATs were only subjected to the application of an impulse. The LATs were tested individually and competitively. The results of individual testing of LATs non-ionization are as follows. The breakdown voltage and time-to-breakdown for Set 1 and Set 2 are presented in graph form in Fig.16. Subsequently from the breakdown voltage of the two sets, testing result is compared in Fig.17.
From the data in Fig.16, the following observations can be made:
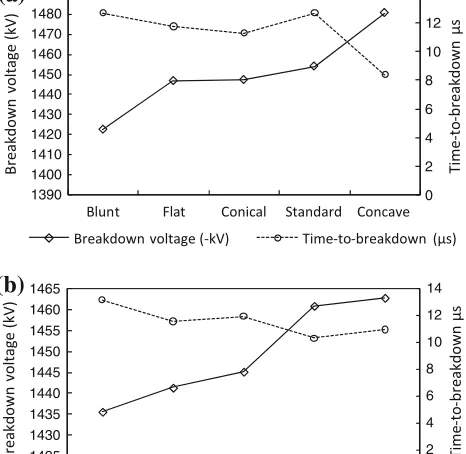
Fig. 16 Analysis of breakdown voltage and time-to-breakdown with-out pre-ionization :aSet 1 andbSet 2
Fig. 17 Analysis of breakdown voltage comparison for Set 1 and Set 2
1. In Set 1, the order of LATs from lowest to highest break-down is blunt, flat, conical, standard, and concave. 2. In Set 2, the order of LATs from lowest to highest
break-down is blunt, standard, concave, flat, and conical. 3. The lowest breakdown voltage for both sets is for the
blunt LAT.
4. The blunt LAT also has the lowest differential in voltage breakdown for both sets of tests, further substantiating the consistency of the blunt LAT’s performance.
0.00 2.00 4.00 6.00 8.00 10.00 12.00 14.00
Fig. 18 Analysis of average time-to-breakdown for Set 1 and Set2 without pre-ionization
its breakdown voltage. The average time-to-breakdown for Set 1 and Set 2 is shown in Fig.18.
Based on Fig.18, the blunt LAT had the highest aver-age time-to-breakdown and the concave LAT had the lowest average time-to-breakdown.
Regarding the individual tests under non-ionized condi-tions, the breakdown process was inconsistent in terms of breakdown voltage and time-to-breakdown. The order of breakdown voltage was inconsistent for both tests. There were no significant observations or significant differences regarding the time-to-breakdown for any of the LATs. How-ever, the performance of the blunt LAT was more consistent in both sets of tests, having the lowest breakdown voltage in both tests and the highest average time-to-breakdown. There-fore, the blunt LAT is the most effective one.
To further substantiate these results, competitive testing was carried out. The number of strikes and the percentage of strikes are recorded in Table2.
Based on Table2, out of five sets of competitive tests, the blunt LAT won over the standard and conical LATs. How-ever, the concave and flat LATs received more strikes than the blunt LAT. This further substantiates the finding that the breakdown of LATs in non-ionized conditions is inconsis-tent.
4.2 With pre-ionization
In condition with pre-ionization, the LATs were subjected to UV radiation and DC pre-stress prior to the application of the impulse. The LATs were tested individually and compet-itively. The voltage breakdown and time-to-breakdown for Set 1 were recorded and the analysis is presented in graph form in Fig.19.
The voltage breakdown and time-to-breakdown for Set 2 were recorded and the analysis is presented in graph form in Fig.20.
The breakdown voltage and time-to-breakdown for both sets of individual tests in condition with pre-ionization were compared and analyzed. The comparison of voltage break-down for Set 1 and Set 2 is given in Fig.21.
For both sets of tests based on the experimental set up as shown in Fig.14for 2-m gap clearance, the voltage break-down was consistent with the blunt rod having the lowest voltage breakdown and the flat rod having the highest volt-age breakdown when the breakdown voltvolt-age different was about 2.5 %. Considering the actual lightning leader pro-gression, involving the last critical distance before lightning strike, the distance involved is approximately 65 m (the max-imum Rolling Sphere radius). It will require about 65 MV to cause lightning to strike the lightning air terminal. There-fore, in these circumstances, definitely the blunt-tip rod will be a better lightning captor, because it takes 16.3 MV more to cause lightning to strike the flat-tip air terminal. The reason behind the low voltage breakdown of the blunt rod is because as the leader approaches, the electric field around the tip of the blunt rod increases. The energy associated with the elec-tric field over the blunt rod is much greater than that over the other rods. The absence of point discharges or coronas around the blunt tip is due to the non-existence of electric field inten-sification, which encourages the interception of lightning to blunt rods at lower breakdown voltage.
The comparison of time-to-breakdown for Set 1 and Set 2 is presented in Fig.22.
As seen in Fig.22, the average time-to-breakdown for the blunt LAT is the highest, because the localized electric field
Table 2 Number and percentage of strikes for non-ionized conditions
Type of comparison Type of rod Number of strikes Percentage of strikes (%)
Standard and blunt Standard 8 40
Blunt 12 60
Conical and blunt Conical 6 30
Blunt 14 70
Concave and blunt Concave 11 55
Blunt 9 45
Flat and blunt Flat 13 65
0
Fig. 19 Analysis of voltage breakdown and time-to-breakdown for Set 1 with ionization
0
Fig. 20 Analysis of voltage breakdown and time-to-breakdown for Set 2 with ionization
1420
Fig. 21 Analysis of the voltage breakdown comparison for Set 1 and Set 2 with ionization
is unable to produce very strong upward streamers. When the field strength at the tip exceeds the air breakdown voltage, upward streamer will propagate. However, it takes time to intensify the local electric field around the tip of the blunt rod to initiate a streamer for further breakdown to occur. Thus, the time-to-breakdown for the blunt rod is longer compared to the other rods.
4.3 Corona observation
In non-uniform field gaps, the corona plays an important role in the final breakdown of the gap, and hence, breakdown
0.00
Fig. 22 Analysis of the time-to-breakdown comparison for Set 1 and Set 2 with ionization
S0
r0 E0
distance from the cathode
field instensity
Fig. 23 Negative corona mode
voltage is strongly influenced by the presence/absence of a corona as well as by the prevailing corona modes [23]. Once the corona starts, the applied electric field becomes distorted by the space charge field, and hence, the breakdown process becomes much more complex. This phenomenon can be explained using the mechanisms of the negative corona mode, as shown in Fig.23.
In a negative corona, electron avalanches are initiated at the cathode and develop toward the anode in a decreasing electric field, as illustrated in Fig.23[17]. Due to their high mobility, electrons move rapidly away from the cathode into the low electric field region, leaving behind the positive space charge close to the cathode. The electron avalanche will stop at the surfaceS0where the electric field is below the critical
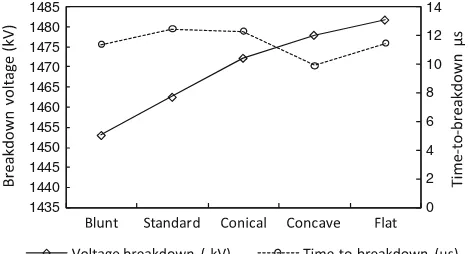
Table 3 Summary of corona formation around rod tips and the connection with voltage breakdown
Ranking Type of rod Corona observation Breakdown
voltage Set 1 (kV)
Breakdown voltage Set 2 (kV)
1. Blunt No corona 1,472.31 1,453.04
2. Standard Ring corona around tip, no further streams of discharge 1,473.07 1,462.58 3. Conical Strong, concentrated corona around the tip; weak streams of discharge 1,491.40 1,472.31 4. Concave Corona two limb edge; strong streams of discharges 1,501.32 1,478.04
5. Flat Corona at sharp edge; strong avalanche 1,510.49 1,481.85
one positive and the other negative, will modify the electric field configuration in the gap in such a manner that the elec-tric field increases near the cathode and decreases near the anode. The avalanches that develop later will develop in a higher electric field but will propagate for a shorter distance than their predecessors.
Moore [20] found that the blunt LAT at the vicinity of the tip emitted no charges during the approach of an ini-tiating stepped leader that descended from a thundercloud overhead. The same was found during the competitive tests in ionized conditions. When energized by DC voltage, it was observed that all the other LATs emitted coronas that could be seen with the naked eye, while the blunt LAT emitted no corona. According to Ref. [2], field strengths do not decrease as rapidly above blunter LATs. The intensified electric field above a blunt LAT outside the point discharge emission zone encourages the propagation of any streamer that forms. This is proven in this experiment, in which the absence of corona formation encourages the propagation of streamers and the breakdown of the gap at a lower voltage.
The formation of coronas affects the voltage breakdown and time-to-breakdown of each LAT tip. This could explain why each LAT breakdown is as it is. It also suggests there is a possible connection between the corona activity around the tip and the voltage breakdown based on the geometry of the LAT tip. It was observed that the breakdown voltage decrease for blunt tip compared to flat tip as shown in Fig.20. In addition, the corona intensity occurs more on the flat tip rather then the blunt tip.
The results of the tests under ionized conditions show that the LAT with a higher corona intensity needs a higher break-down voltage. This is in line with the theories in Ref. [23], where the space charge acts as a shield when the field is highly stressed at the rod tip. It then decreases the field in its vicinity and thus, such a configuration needs a higher voltage for complete breakdown. All voltage breakdowns of LATs in ionized conditions are higher than that in non-ionized con-ditions. This is due to the formation of a corona (which is necessary for the onset of positive emissions) around the rod tip. Therefore, the LATs need higher breakdown voltage (in ionized conditions). Table3summarizes the ranking of LATs
Table 4 Results for competitive testing with pre-ionization Type of comparison Type of rod Number
of strikes
Percentage of strikes (%) Standard and blunt Standard 14 70
Blunt 6 30
Conical and blunt Conical 13 65
Blunt 7 35
Concave and blunt Concave 13 65
Blunt 7 35
Flat and blunt Flat 12 60
Blunt 8 40
according to their voltage breakdown and corona formation in ascending order.
A connection between the geometry of the LAT tip, corona formation around the LAT tip, and voltage break-down was established based on Table3. As the corona for-mation increases, the voltage breakdown also increases for the blunt tip compared to the flat tip. This result is in line with the remark of Cooray et al. [24] that laboratory research on long sparks shows that the breakdown voltage of spark gaps increases in the presence of corona emissions from one or both of the electrodes. Therefore, with the increase of corona emissions at a flat tip, the voltage breakdown increases. This clearly shows that the geometry of the rod influences corona formation and thus influences the voltage breakdown, which in turn determines the performance of the tip.
5 Competitive tests
Table 5 Summary of individual testing of air terminals under both conditions
Type Breakdown voltage without ionization (-kV) Breakdown voltage with ionization (kV) Deviation of time-to-breakdown (µs)
Set 1 Set 2 Set 1 Set 2 Without pre-ionization With pre-ionization
Blunt 1,422.76 1,435.47 1,472.31 1,453.04 0.41 0.47
Standard 1,454.10 1,441.20 1,473.07 1,462.58 1.11 2.59
Conical 1,447.38 1,462.58 1,491.40 1,472.31 0.97 1.67
Concave 1,480.62 1,445.01 1,501.32 1,478.04 3.50 3.22
Flat 1,146.87 1,460.67 1,510.49 1,481.85 1.40 1.53
launched. Thus, the blunt LAT became the preferred point of discharge. In a laboratory, the number of coronas gen-erated is less than that in real conditions and, therefore, no strong shielding effect occurred. Therefore, the rods are not clearly distinguished from one another. The other LATs broke down earlier and intercepted the simulated lightning more efficiently than the blunt one. This shows that the presence of some coronas is needed to launch a successful streamer.
Results for ionized and non-ionized conditions were com-pared and discussed in terms of individual tests (breakdown characteristics), competitive tests (percentage of strikes), and corona observation. The voltage breakdown for ionized conditions is higher and more consistent compared to non-ionized conditions. However, both conditions show that the blunt rod has the lowest breakdown voltage. The deviation of average time-to-breakdown is contradictory. The blunt rod has the lowest time-to-breakdown deviation in non-ionized conditions, but the highest time-to-breakdown deviation in ionized conditions. The summary of individual testing of air terminals under both conditions is presented in Table5.
The blunt rod won most of the tests under non-ionized conditions. Though the results for ionized conditions did not show concrete proof that the blunt rod was the more effec-tive LAT, it did prove that the blunt rod performed more consistently in ionized conditions compared to non-ionized conditions.
6 Conclusions
Based on the tests, the breakdown voltage in non-ionized con-ditions is inconsistent and stable while the breakdown volt-age in ionized conditions is more consistent with the theories of corona formation and electric field strength. In short, the performance of LATs in ionized conditions is more consis-tent and more reliable compared to non-ionized conditions. This is because ionized conditions allow the emission of free electrons for the onset of positive streamers from the tip of LATs.
The laboratory tests prove that the performance of air ter-minals is affected by tip geometry. Differently shaped tips have different breakdown characteristics. It was found that a
blunt LAT is a better receptor than other LATs in terms of breakdown voltage and time-to-breakdown.
It was also determined that different tip geometry results in different corona formation around the LAT tips. This corona formation affects the breakdown characteristics of LATs. It was found that the flat and concave LATs have high corona formation that results in higher voltage breakdown. While the blunt LAT is a good receptor with no corona formation at its tip and lower voltage breakdown, the corona formation around the tips of flat and concave LATs may suggest they are better at preventing lightning strikes because of the number of points that emerge from the tip of the LAT.
This study shows that any lightning-protection system test carried out in a laboratory should be done under ionized con-ditions to obtain more reliable results. Finally, based on the competitive tests conducted in the laboratory, it was found that flat-, concave- and conical-tip lightning rods can be used for lightning-protection purposes.
Acknowledgments The authors gratefully acknowledge the support extended by Ministry of Higher Education (MOHE), Malaysia and Universiti Teknologi Malaysia on the Research University Grant (GUP), No. Q.J130000.7123.01J95 to carry out this work.
References
1. Moore CB (1983) Improved configurations of lightning rods and air terminals. J Franklin Inst 35(1):61–85
2. Moore CB, Rison W, Mathis J, Aulich GD (2000) Lightning rod improvement studies. J Appl Meteorol 39:593–609
3. Moore CB, Aulich GD, Rison W (2000) Measurements of light-ning rod responses to nearby strikes. Geophys Res Lett 27(10): 1487–1490
4. Moore CB, Aulich GD, Rison W (2003) The case for using blunt-tipped lightning rods as strike receptors. J Appl Meteorol 42: 984–993
5. Alessandro FD, Berger G (1999) Laboratory studies of corona emissions from air terminals. J Phys D Appl Phys 32:2785–2790 6. Heary KP, Chaberski AZ, Richens F, Moran JH (1993) Early
streamer emission enhanced air terminal performance and zone of protection. In: Proceedings of industrial and commercial power systems technical conference, pp 26–32
8. Allen NL, Cornick KJ, Faircloth DC, Kouzis CM (1998) Tests of the early streamer emission principle for protection against lightning. Proc Sci Meas Technol 145(5):200–206
9. Allens NL, Evans JC (2000) New investigations of the early streamer emission. Proc Sci Meas Technol 147(5):243–248 10. Drabkin MM, Gryzboski S (2000) Experimental study of the
emis-sion current form ion plasma generator. In: Proceedings of 25th international conference on lightning protection, September 2000, pp 385–388
11. Ding M, Li H (2002) Principle and evaluation method of active lightning arrester. In: Proceedings of international conference on power system technology, pp 1856–1858
12. Lee JB, Myung SH, Cho YG, Chang SH, Kim JS, Kil GS (2002) Experimental study on lightning protection performance of air ter-minals. In Proceedings of international conference on power system technology, pp 2222–2226
13. British Standard Institution (1999) Protection of structures against lightning. London, BS 6651
14. Australia/New Zealand Standard Institution (1991) Lightning Pro-tection. Australia/New Zealand, NZS/AS, pp 1768–1991 15. Chalmers ID, Evans JC, Siew WH, Allen NL, Greaves DA, Cotton I
(1998) Laboratory testing of early streamer emission air terminals. In: Proceeding of the international conference on lightning pro-tection, September 14–18, 1998, Birmingham, UK: ICLP. 1998, pp 412–417
16. Langhaar HL (1951) Dimensional analysis and theory of models. Wiley, New York
17. Kuffel E, Zaeng WS, Kuffel J (2000) High voltage engineering fundamentals, 2nd edn. Butterworth–Heinemann, Great Britain 18. Moore CB, Rison W, Mathis J, Patterson L (1997) Report on a
competition between sharp and blunt lightning rods. IEEE Trans Electromagn Compat
19. Abdel-Salam M, Al-Abdul-Latif U (1995) Lightning protection using energized Franklin rods. In: Conference record of the 1995 IEEE industry applications conference, 1995, vol 2, pp 1409–1414 20. Moore CB (1998) Comparative tests of sharp and blunt lightning rods. In: Report prepared for the 24th international conference on lightning protection, September 14–18, 1998, Birmingham, Eng-land: ICLP, 1998
21. Cooray V (2003) The lightning flash. The Institution of Electrical Engineers, London
22. Greenwood A (1991) Electrical transients in power systems. Wiley, New York
23. Malik NH, Al-Arainy AA, Qureshi MI (1998) Electrical insulation in power system. Marcel Dekker Inc., USA
24. Cooray V, Zitnik M (2004) On attempts to protect a structure from lightning strikes by enhanced space charge generatiion. In: Inter-national conference on lightning protection (ICLP), 2004 25. Szczerbi´nski M (2006) Lightning protection with the mesh method: