Survival Analysis for Customer Satisfaction: A Case Study
Hadiyat, M.A., Wahyudi, R. D.W., Sari, Y. Industrial Engineering, University of Surabaya Corresponding email: [email protected]
Abstract. Mostly, customer satisfaction survey conducted periodically to track the dynamically of it. One of the goals of this survey is to evaluate the service design by recognizing the trend of satisfaction score. Many researchers recommend in re-designing the service when the satisfaction scores were being decreased, so that the service life cycle could be predicted qualitatively. However, these scores usually set in likert scale and have quantitative properties, then should be analysed in quantitative model as well so that the predicted service life cycle would be done by applying the survival analysis. This paper will discuss a starting point for customer satisfaction survival analysis with a case study in healthcare service.
Keywords: satisfaction scores, survival analysis, satisfaction life cycle, service re-design predicting
1. Introduction
Many researchers proposed to conduct the customer satisfaction survey periodically to capture the behavior of this dynamic satisfaction scores [1]. The questionnaire for this survey consists of items interested by customers that influencing their satisfaction level. Qualitatively, some researchers decide to re-design the service when there are some indications that the scores being decreased [2]. It means that there are some limitations in predicting when the re-design process should be conducted. One needs to expert judge the re-design time base on past experiences.
However, quantitative approach in designing questionnaire for measuring customer satisfaction should be considered. Items in questionnaire for this survey usually scaled in likert items, so that the scores have some quantitative property [3]. Once the survey was conducted and satisfaction score was calculated, the quantitative analysis could be done and gives stronger interpretation in predicting the service life cycle.
The survival analysis helps the management to predict the time where new service design should be deployed, by constructing the probability that the scores less than certain levels of satisfaction. Started by control charting the satisfaction scores over time and capture its dynamic, then continued by fit the best probability distribution and followed by calculating the probability of satisfaction survival. Smaller survival probability of certain level of satisfaction represents the need of service re-design.
2. Literature review
2.1. Parasuraman s Satisfaction scores
Parasuraman [6] mention that satisfaction of customer is the gaps measurement between expected and perceived service received by customers, defined as customer gaps. Moreover, another gaps also measured for mining the causes of customer gaps, and all those integrated gaps are summarized as the well-known method called SERVQUAL, stand for service quality.
Figure 1: SERVQUAL gaps (taken from [6])
Common questionnaire for measuring these customer gaps consist of at least 20 likert scale questions. All items are generated based on 5 dimensions i.e. tangibles, empathy, reliability, responsiveness, and assurance. Overall satisfaction score of a customer is calculated as the average of each item scores. Scores from all customers that measured over time form a dataset to be modeled with survival analysis. In this paper, all satisfaction scores converted to positive value, low positive mean unsatisfied while high one means satisfied .
2.2. Survival analysis
Similar to the calculation of product reliability, the survival analysis in this paper is based on [7] applied to satisfaction dataset. Steps in survival analysis for product reliability follows points below:
a. Measure the reliability datat(age of component, or satisfaction scores),
b. Fit the dataset with some probability density function (PDF) f(t), this function could be a product of two or more probability distribution regard to its dynamically behavior.
c. Use the fitted PDF to calculate the reliability of component or satisfaction. Fitted probability distribution could be calculated by using simulated Bayesian approach due to its multimodality.
Reliability function ( ) = ( > ) = 1 ( ), (1) Where ( ) = ( < ) = ( )
The PDF used in this paper refer to common survival analysis, for example, like weibull, exponential, gamma, and similar distribution covered in normal family distribution, multiplied by similar distribution as well so thatf(t) could be interpreted.
3. Research framework and methodology
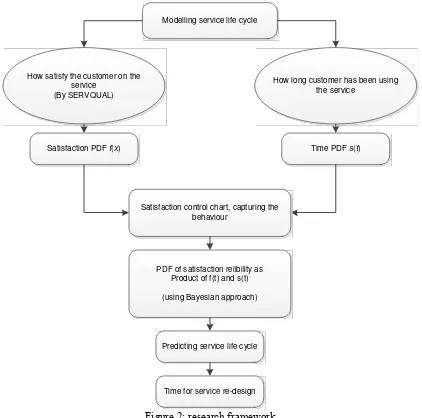
This paper is part of preliminary research in modeling customer satisfaction data and predicting the service life cycle. The main framework includes the integration of two probability distribution fitted by Bayesian approach. Satisfaction PDF called f(x), and how long customers has been using service denoted bys(t).
Modelling service life cycle
How satisfy the customer on the service
(By SERVQUAL)
How long customer has been using the service
Satisfaction PDFf(x) Time PDFs(t)
PDF of satisfaction relibility as Product of f(t) and s(t) (using Bayesian approach)
Predicting service life cycle
Time for service re-design Satisfaction control chart, capturing the
behaviour
Figure 2: research framework
Product PDF as multiplication of f(x) ands(t) done by simulating those prior distribution so that the posterior PDF obtained. Mathematically, the posterior PDF (product PDF) for modeling satisfaction reliability survival function written as follows:
4. Result and discussion
Case study in this paper was taken from MINITAB user guide case study in healthcare, the dataset consists of two variables, patient satisfaction scores (on scale of 1-7) and how long they have been treated and staying in hospital (in days). First, the behavior of those two variables captured by using multivariate control chart, as in [8] and refers to [9].
31
Figure 3: Multivariate control chart. (a) before omitting unusual observations, and (b) after removing unusual observations
Two points are out of control; indicate that at certain time some special cases should be investigated. If there are some causes then the two points should be removed from analysis. Therefore, PDF fitting process for those two variables could be held.
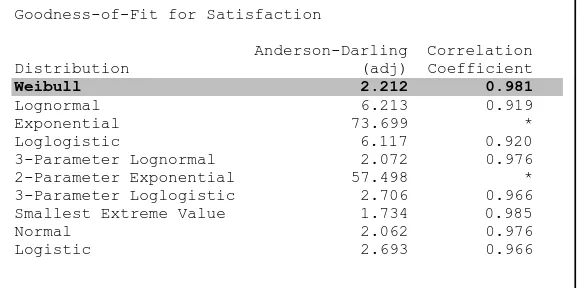
Based on parametric survival analysis using MINITAB software, fitting process for f(x) and s(t) have done. PDF f(x) was well fitted by weibull distribution, and s(t) was assumed to follows exponential distribution.
Figure 4: Minitab output; probability distribution fitting for satisfaction data
The multiplication process in (2) could not be solved analytically, so that Bayesian Markov Chain Monte Carlo [10] simulation was used to fit the PDF L(xt) as the Bayesian posterior distribution. Bayesian structure for likelihood functionf(t), prior distributions(t) and posteriorL(xt) defined as:
The Markov Chain Monte Carlo simulation was conducted by using WINBUGS (Bayesian Using Gibss Sampler) software [10].
Figure 5: WINBUGS Markov Chain Monte Carlo Result for posterior PDF
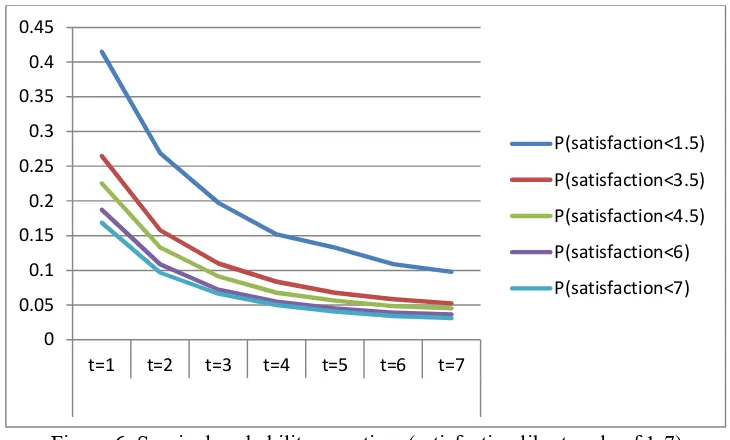
Figure 5 shows that the estimated was 0.803, using similar way the estimation of other parameters has obtained. Next, this value would be used to predict the probability of satisfaction survival. Table 1 represents the trends of survival probability.
Figure 6: Survival probability over time (satisfaction likert scale of 1-7)
The survival probability decreased over time; moreover the probability at same time t for high satisfaction level gives higher probability than lower ones. Figure 6 gives interpretation that at until t=7, the satisfaction of customer becomes higher. At first day in hospital, patient feels uncomforted because of inadaptable conditions, but after few days the patient perceived more satisfy and got more complete service.
5. Concluding remarks
This is an initial research for mathematically modeling customer satisfaction due to service quality of a nonmanufacturing company or public service. The level of satisfaction was being dynamic and interested to study. Development of this research leads to the innovation of robust service design.
Acknowledgement
This paper is part of research funded by Directorate General Higher Education, Ministry of Research, Technology and Higher Education of the Republic of Indonesia, year 2017.
0 0.05 0.1 0.15 0.2 0.25 0.3 0.35 0.4 0.45
t=1 t=2 t=3 t=4 t=5 t=6 t=7 P(satisfaction<1.5)
References
[1] Hill N, Roche G, Allen R 2007 Customer Satisfaction: The Customer Experience through the
Customer's Eyes(London- Cogent Publishing)
[2] Lovelock, Patterson, Wirtz, 2015Services Marketing(Melbourne Pearson Australia)
[3] Audrezet A, Olsen S O, Tudoran A A, 2016 The GRID scale: a new tool for measuring service mixed satisfactionJournal of Services Marketing30 issue 129
[4] Chen Y, Zhang H, Zhu P, 2009 Study of Customer Lifetime Value Model Based on Survival-AnalysisProceeding of World Congress on Computer Science and Information Engineering [5] Lu J 2003 Modeling Customer Lifetime Value Using Survival Analysis -An Application in the
Telecommunications IndustrySAS User Group International Proceedings(Washington)
[6] Parasuraman A, Zeithaml V A, Berry L L 1988 SERVQUAL: a multi-item scale for measuring consumer perceptions of the service qualityJournal of Retailing64 1 12-40.
[7] Ebeling C 2010An Introduction to Reliability and Maintainability Engineering(Waveland) [8] Khorsidi H A, Nikfalazar S, Gunawan I 2016 Statistical process control applications on service
quality using SERVQUAL and QFD with a case study in trains serviceThe TQM Journal28 2
195
[9] Montgomery D C 2013Introduction to Statistical Quality Control(Wiley)
![Figure 1: SERVQUAL gaps (taken from [6])](https://thumb-ap.123doks.com/thumbv2/123dok/1504600.1532901/2.595.164.448.295.484/figure-servqual-gaps-taken-from.webp)