LO.a: Calculate and interpret a sample covariance and a sample correlation coefficient and interpret a scatter plot.
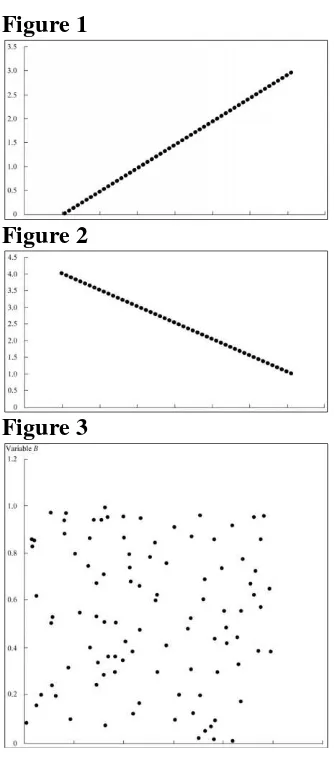
1. Based on the scatter plots shown below, which of the following statements is most accurate?
Figure 1
Figure 2
Figure 3
A. Figure 1 shows a scatter plot of two variables with a correlation of -1. B. Figure 2 shows a scatter plot of two variables with a correlation of -1. C. Figure 3 shows a scatter plot of two variables with a correlation of -1.
2. The following table gives the number of cars sold annually and interest rates in a country, for four recent years. The sample correlation between car sales and interest rates is closest to: Year Cars Sold (in millions) Interest Rate (%)
2011 100 7.0
2012 140 6.0
2013 160 5.0
2014 120 6.0
3. Analyst 1: If two variables have a very strong linear relation, then the absolute value of their correlation will be close to 1.
Analyst 2: If the correlation coefficient is positive, the two variables are directly related; if the correlation coefficient is negative, the two variables are not related.
A. Analyst 1 is correct. B. Analyst 2 is correct. C. Both analysts are correct.
LO.b: Describe limitations to correlation analysis.
4. Which of the following statements is least accurate?
A. Two variables can have a strong nonlinear relation and still have a very low correlation.
B. Correlation is a more reliable measure when outliers are present in the data series. C. Correlation between two variables can arise not from a direct relation between them,
but from their relation to a third variable.
LO.c: Formulate a test of the hypothesis that the population correlation coefficient equals zero and determine whether the hypothesis is rejected at a given level of significance.
5. The following table shows the sample correlations of the monthly returns for two different mutual funds with the S&P 500. The correlations are based on 36 monthly observations. The funds are as follows:
Fund 1: Small cap fund
Fund 2: Emerging equity fund. S&P 500: US domestic stock index
S&P 500
Fund 1 0.32
Fund 2 0.36
S&P 500 1
Using a 5 percent significance level, which of the following conclusions is most accurate? (Critical t-value for 34 df, using a 5 percent significance level and a two tailed test is 2.032)
A. Fund 1 is correlated to S&P 500. B. Fund 2 is correlated to S&P 500. C. Both funds are correlated to S&P 500.
6. The following table shows the sample correlations of the monthly returns for two different mutual funds with the S&P 500. The correlations are based on 120 monthly observations. The funds are as follows:
Fund 1: Large cap value fund. Fund 2: Large cap growth fund. S&P 500: US domestic stock index
S&P 500
Fund 1 0.25
S&P 500 1
Using a 5 percent significance level, which of the following conclusions is most accurate? (Critical t-value for 118 df, using a 5 percent significance level and a two tailed test is 1.98)
A. Fund 1 is correlated to S&P 500. B. Fund 2 is correlated to S&P 500. C. Both funds are correlated to S&P 500.
LO.d: Distinguish between the dependent and independent variables in a linear regression.
7. Analyst 1: The dependent variable in a linear regression is the variable that the regression model tries to explain.
Analyst 2: The independent variables are the variables that a regression model uses to explain the dependent variable
A. Analyst 1 is correct. B. Analyst 2 is correct. C. Both analysts are correct.
8. You are an investor in Google stock and want an estimate of its beta. You formulate the following regression equation.
(R – RF) = α + β(RM– RF) + ε
where RF is the risk free rate, RM is the periodic return on the market, R is the periodic return to the stock of the company.
Which of the following is the independent variable? A. R – RF.
B. RM– RF. C. RM.
9. You are an investor in Google stock and want an estimate of its beta. You formulate the following regression equation.
(R – RF) = α + β(RM– RF) + ε
where RF is the risk free rate, RM is the periodic return on the market, R is the periodic return to the stock of the company.
Which of the following is the dependent variable? A. R – RF.
B. RM– RF. C. R.
LO.e: Describe the assumptions underlying linear regression and interpret regression coefficients.
10.Which of the following is least likely an underlying assumption of the classic normal linear regression model?
A. A linear relation exists between the dependent variable and the independent variable. B. The independent variable is not random.
11.Which of the following is least likely an underlying assumption of the classic normal linear regression model?
A. The expected value of the error term is 0. B. The error term is correlated across observations.
C. The variance of the error term is the same for all observations.
12.Consider a regression model, Yi = b0 + b1Xi+ εi..Which of the following statements is least accurate?
A. The coefficient b0 is the intercept and b1 is the slope of the regression line.
B. b0 is the predicted value of the dependent variable when the independent variable has a value of zero.
C. If the value of the independent variable decreases by one unit, then the model predicts that the value of the dependent variable will increase by b1 units.
LO.f: Calculate and interpret the standard error of estimate, the coefficient of determination, and a confidence interval for a regression coefficient.
13.Which of the following statements is most accurate?
A. The standard error of estimate measures the fraction of the total variation in the dependent variable that is explained by the independent variable.
B. The coefficient of determination measures how well the regression model fits the data.
C. In a linear regression with one independent variable, the simplest way to compute the coefficient of determination is to square the correlation of the dependent and
independent variables.
The following information relates to Questions 14-16.
You receive the following regression statistics for a dependent variable Y and an independent variable X.
14.What is the value of the coefficient of determination? A. 0.85
B. 0.72 C. 0.05
15.What is the correlation between X and Y? A. 0.85
16.Suppose you deleted several of the observations that had large residual values. If you re-estimated the regression equation using this reduced sample, what would most likely happen to the standard error of the estimate and the R-squared?
Standard Error of Estimate R-squared
A Decrease Decrease
B Increase Decrease
C Decrease Increase
LO.g: Formulate a null and alternative hypothesis about a population value of a regression coefficient and determine the appropriate test statistic and whether the null hypothesis is rejected at a given level of significance.
17.You receive the following regression statistics for a dependent variable Y and an independent variable X. The number of observations is 60. (The critical t-value for 58 degrees of freedom, a two-tailed test, and a 5 percent significance level is 2.00)
Coefficients Standard Error
Intercept 0.09 0.06
Slope 0.85 0.1
Using a 5% level of significance and a two tailed test, which of the following conclusions is most accurate?
A. There is a significant relationship between X and Y. B. The relationship between X and Y is not significant. C. X and Y are negatively correlated.
18.You receive the following regression statistics for a dependent variable Y and an independent variable X. The number of observations is 60. (The critical t-value for 58 degrees of freedom, a two-tailed test, and a 5 percent significance level is 2.00)
Coefficients Standard Error
Intercept 0.85 0.1
Slope 0.09 0.06
Using a 5% level of significance and a two tailed test, which of the following conclusions is most accurate?
A. There is a significant relationship between X and Y. B. The relationship between X and Y is not significant. C. X and Y are negatively correlated.
LO.h: Calculate the predicted value for the dependent variable, given an estimated regression model and a value for the independent variable.
19.You receive the following regression statistics for a dependent variable Y and an independent variable X.
Coefficients Standard Error t-statistic p-value
Intercept 0.05 0.006 0.83 0
If the value of X is 5, what is the predicted value of Y? A. 0.05 + (0.2)5 = 1.05
B. 0.05 + (0.85)5 = 4.3 C. 0.05 +(-0.85)5 = -4.2
20.You receive the following regression statistics for a dependent variable Y and an independent variable X.
Coefficients Standard Error t-statistic p-value
Intercept 0.4 0.03 13.33 0
Slope -0.5 0.04 -12.5 0
If the value of X is 10, what is the predicted value of Y? A. 0.4 + (0.04)10 = 0.8
B. 0.4 + (0.5)10 = 5.4 C. 0.4 + (-0.5)10 = -4.6
LO.i: Calculate and interpret a confidence interval for the predicted value of the dependent variable.
21.You receive the following regression statistics for a dependent variable Y and an independent variable X.
Multiple R 0.95
R-squared 0.9
Standard error of the estimate 0.75
Observations 9
Coefficients Standard Error t-statistic
Intercept 1.25 0.4 3.13
Spread 20 3.8 5.26
The standard deviation of the forecast error is 0.8.
If the value of X is 2, what is the 95% confidence interval for the value of Y?
(Given a 95 percent confidence interval and 9 − 2 = 7 degrees of freedom, the critical value of the t-statistic, tc, is 2.365)
Solutions
1. B is correct. Figure 1 shows correlation of +1. Figure 2 shows correlation of -1. Figure 3 shows correlation of 0.
Sample standard deviation of sales is the square root of the variance, or 25.81
Sample variance of interest rates is [(7 − 6)2+ (6 − 6)2+ (5 − 6)2+ (6 − 6)2]/3 = 2/3 = 0.666667.
Sample standard deviation of interest rates is the square root of this result, or 0.8165.
Sample covariance between sales and interest rates is [(100 − 130)(7 − 6) + (140 − 130)(6 −6) + (160 − 130)(5 − 6) + (180 − 130)(6 − 6)]/3 = −60/3 = −20.
Sample correlation is the covariance divided by the product of the standard deviations: r = Cov ( X , Y )/ s x s y = − 20/ ( 25.81 ) ( 0.8165 ) = − 0.9490
Note: You may also use the ‘Data’ and ‘Stat’ functions on the BA II calculator to get this values.
3. A is correct. If the correlation coefficient is positive, the two variables are directly related; if the correlation coefficient is negative, the two variables are inversely related.
4. B is correct. Correlation may be an unreliable measure when outliers are present in one or both of the series. Outliers are small numbers of observations at either extreme (small or large) of a sample.
5. B is correct.
The critical t-value for n − 2 = 34 df, using a 5 percent significance level and a two-tailed test, is 2.032.
First take the correlation between Fund 1 and S&P. Its calculated t-value is:
√ √
√
√
Since the t value is not more than 2.032, we cannot conclude that the correlation of this fund with S&P 500 is significantly greater than 0.
Now take the correlation between Fund 2 and S&P 500. Its calculated t-value is:
√ √
√
Since the t value is more than 2.032, we can conclude that the correlation of this fund with S&P 500 is significantly greater than 0.
6. C is correct.
The critical t-value for n − 2 = 118 df, using a 5 percent significance level and a two-tailed test, is 1.96
First take the correlation between Fund 1 and S&P. Its calculated t-value is:
√ √
√
√
Since the t value is more than 1.96, we can conclude that the correlation of this fund with S&P 500 is significantly greater than 0.
Now take the correlation between Fund 2 and S&P 500. Its calculated t-value is:
√ √
√
√
Since the t value is more than 1.98, we can conclude that the correlation of this fund with S&P 500 is significantly greater than 0.
7. C is correct. The dependent variable in a linear regression is the variable that the regression model tries to explain. The independent variables are the variables that a regression model uses to explain the dependent variable.
8. B is correct. In the regression equation, Yi = b0 + b1Xi+ εi, Xi is the independent variable.
9. A is correct. In the regression equation, Yi = b0 + b1Xi+ εi, Yi is the dependent variable.
10.C is correct. The assumptions of the classic normal linear regression model are the following:
A linear relation exists between the dependent variable and the independent variable.
The independent variable is not random.
The expected value of the error term is 0.
The variance of the error term is the same for all observations (homoskedasticity).
The error term is uncorrelated across observations.
The error term is normally distributed.
11.B is correct. The assumptions of the classic normal linear regression model are the following:
A linear relation exists between the dependent variable and the independent variable.
The independent variable is not random.
The expected value of the error term is 0.
The variance of the error term is the same for all observations (homoskedasticity).
The error term is uncorrelated across observations.
12.C is correct. If the value of the independent variable increases by one unit, then the model predicts that the value of the dependent variable will increase by b1 units.
13.C is correct. The standard error of estimate measures how well the regression model fits the data. The coefficient of determination measures the fraction of the total variation in the dependent variable that is explained by the independent variable.
14.B is correct. The coefficient of determination is the same as the R-squared.
15.A is correct. For a regression with one independent variable, the correlation is the same as the Multiple R with the sign of the slope coefficient. Because the slope coefficient is positive, the correlation is 0.85.
16.C is correct. Deleting observations with large residuals will increase the strength of the regression, resulting in a decrease in the standard error and an increase in R-squared.
17.A is correct. The test statistic can be calculated as (b1−B1)/sb1. To test the significance of the relationship we assume that the hypothesized value of the slope coefficient is 0.
Therefore the calculated test statistic is (0.85 – 0)/ 0.1 = 8.5
Since the absolute value of the test statistic 8.5 is greater than the critical value of 2, we can conclude that the relationship between X and Y is significant.
18.B is correct. The test statistic can be calculated as (b1−B1)/sb1. To test the significance of the relationship we assume that the hypothesized value of the slope coefficient is 0.
Therefore the calculated test statistic is (0.09 – 0)/ 0.06 = 1.5
Since the absolute value of the test statistic 1.5 is less than the critical value of 2, we can conclude that the relationship between X and Y is not significant.
19.B is correct. To make a prediction using the regression model, multiply the slope coefficient by the forecast of the independent variable and add the result to the intercept.
20.C is correct. To make a prediction using the regression model, multiply the slope coefficient by the forecast of the independent variable and add the result to the intercept.
21.A is correct.
The expected value of Y is 1.25 + (20)2 = 41.25
The standard deviation of the forecast error is 0.8. The critical value of the t-statistic, tc, is 2.365.