EFFECT OF F / M RATIO AGAINST NEUTRON FLUX DISTRIBUTION ON
THE HTGR-10 MWth PEBBLE BED CORE
Hery Adrial, Zuhair,Suwoto, Syaiful Bakhri, Geni Rina Sunaryo
Center for Nuclear Reactor Technology and Safety Kawasan Puspiptek Gd.80, Serpong, Tangerang Selatan
Email: [email protected]
ABSTRACT
EFFECT OF F/M RATIO AGAINST OF NEUTRON FLUX DISTRIBUTION ON THE HTGR-10 MWTH PEBBLE BED CORE
. The research on the effect
of F/M ratio on neutron flux distribution in the HTGR-10 MWth pebble bed core has been done. The goal of this research is to know the effect caused by variations of pebble fuel ratio with pebble moderator (F/M) on neutron flux distribution at HTGR-10 MWth core and to obtain optimal F/M ratio to be applied in the 10 MWth core. In this research, the first step is completed modeling of HTGR-10 MWt then calculation of the neutron energy spectrum and neutron flux calculation, with variations F/M = 100: 0, 80:20, 60:40, 57; 43, 52; 48, 50 : 50, 40.60, and 20:80. Modeling and calculation are performed using the program package EGS99304 with 36 group vitamin C, MCNP6.1 and VisEd. The calculation results have shown that the resulting neutron spectrum is identical to the neutron spectrum that occurs on the core of the nuclear reactor. The highest neutron flux distribution of 1.32E + 14 n/cm2 sec occurred at F: M = 40:60 with the position at the center of the reactor core. The fuel ratio is also in the range of 40% to 60% to apply to the HTGR10 MWth core with multiplication factor value is in the range of 1.08 to 1.16. From the results of calculation, it can be concluded that highest flux the HTGR-10 MWth is 1.32 E+14 n/cm2 sec with F/M ratio is 40:60, while the variation F/M ratio which can be used on HTGR-10 MWth is from the ratio of 40:60 to 60:40.Keywords: neutron flux, neutron spectrum, HTGR-10 MWth, pebble bed core, F/M ratio
ABSTRAK
PENGARUH RASIO F/M TERHADAP DISTRIBUSI FLUKS NEUTRON PADA TERAS HTGR-10 MWTH PEBBLE BED. Telah dilakukan penelitian mengenai Pengaruh rasio F/M terhadap distribusi fluks neutron pada teras HTGR-10 MWth pebble bed. Penelitian ini dilakukan bertujuan untuk mengetahui pengaruh yang ditimbulkan akibat variasi rasio bahan bakar pebble dengan moderator pebble (F/M) terhadap distribusi fluks neutron pada teras HTGR-10 MWth dan untuk mendapatkan rasio F/M yang optimal untuk diaplikasikan di dalam teras HTGR-10 MWth. Dalam penelitian ini terlebih dahulu dilakukan pemodelanHTGR-10 MWth secara lengkap kemudian dilakukan perhitungan spektrum energi neutron dan fluks neutron dengan variasi F/M = 100:0, 80:20, 60:40, 57;43, 52;48, 50:50, 40,60, dan 20:80. Pemodelan dan Perhitungan dilakukan dengan menggunakan paket program EGS99304 dengan menggunakan 36 group vitamin C , MCNP6.1 dan VisEd. Hasil perhitungan menunjukkan spektrum neutron yang dihasilkan identik dengan spektrum neutron yang terjadi pada teras reaktor nuklir. Distribusi fluks neutron tertinggi sebesar 1.32E+14 n/cm2 det terjadi pada F:M = 40:60 dengan posisi berada di tengah-tengah teras reaktor. Didapat pula rasio bahan bakar dalam kisaran 40 % sampai 60 % untuk dapat aplikasikan ke dalam teras HTGR10 MWth dengan nilai faktor multiplikasi berada pada kisaran 1,08 sampai 1,16. Dari hasil perhitungan yang dilakukan dapat disimpulkan bahwa pada HTGR-10 MWth fluks tertinggi dapat mencapai nilai 1.32E+14 n/cm2 det dengan F/M rasio = 40:60 sedangkan variasi F/M rasio yang dapat digunakan pada HTGR-10 MWth adalah dari rasio 40:60 sampai 60:40.
Kata kunci: fluks neutron, spectrum neutron, HTGR-10 MWth, pebble bed, F/M rasio
INTRODUCTION
special (excellent), which has a great margin of fuel temperature and the large coefficient of reactivity temperature to accommodate the insertion of reactivity [1-3]. Meanwhile, to support the concept of inherent safety materials used for construction and the HTGR pebble bed fuel and moderator pebble is very dominated by the element carbon (graphite), so that the negative reactivity will be achieved. The other of HTGR pebble bed characteristics is fuel loading can be done directly (on-line) this makes HTGR 10 MWth very economical [4-6].
With regards to graphite material dominance in the structure of the HTGR 10 MWth including in the pebble fuel and moderator so condition ratio of pebble fuel to the moderator will greatly influence neutron moderation factors and neutron flux that occur in the reactor core of HTGR 10 MWth. The research on the effect of the graphite material to the performance of neutronic HTGR pebble bed has been carried out by other researchers, such as optimization studies on neutron moderation in the core HTR pebble bed [7-8]. Analysis of calculation reactivity coefficient of fuel and moderator on RGTT200K core [9]. etc. Therefore, to the complement and increase and fulfill the knowledge of the graphite material effect on the performance of neutronic on the HTGR pebble bed core, a study entitled Effect of Ratio F / M Against the neutron flux distribution in HTGR-10 MWT pebble bed core is conducted. The purpose of this study is to obtain the F / M ratio that is optimal to be applied in all HTGR-10 MWth core based on the neutron flux distribution in the HTGR pebble bed core. Research carried out by using a Monte Carlo program package transport MCNP6 [10-11].
BASIC THEORY
Description HTGR-10 MWth
HTGR-10MWth pebble-bed is a high-temperature nuclear reactor designed to operate in input temperatures of approximately 250 °C and have output temperature of around 700 °C and a thermal power of 10 MW. Coolant fluid of HTGR-10 MWth is an inert helium gas which is directly forwarded to the heat exchanger system (HE). The operational pressure within HTGR-10 MWth pebble-bed core is 3 MPa in which the mass flow rate of the cooling fluid helium for full power is 4.3 kg/s. To realize the concept of inherent safety, then the construction materials of HTGR-10 MWth is very dominated by the carbon element (graphite) which will produce a negative reactivity[12].
HTGR-10 MWth is constructed to have the active core of 197 cm height with a radius of 90 cm. Reflectors are made of the graphite material which surrounds the core of HTGR-10 MWth with axial thick of 100 cm. In the reflector area within 5 cm from the edge of the reflector, there are the 10 holes arrangement of the control rods each with a diameter of 13.0 cm and an interval of 36o angle. There are also 7 small balls holes absorber as well as 3-holes-irradiation shaped of ellips with diameter of 13 cm. Small absorber ball diameter is 5 mm. Additionally, along with a distance of 50 cm from the edge of the reflector, there are 20 holes helium cooling with a diameter of 4.0 cm. Reflectors are then coated with a core barrel which made of stainless steel with a thickness of 5 cm. The upper reflector with a thickness of 130 cm which is also made of graphite, placed at 41 cm higher than the upper limit active core. Space with thickness is 41 cm between active high and the upper reflector left empty (void). bottom of the core on HTGR-10MWth pebble-bed which funnel-shaped is useful for driving out the former pebble caused of burning result. At the initial of criticality condition, the funnel is filled by pebbles moderator with a diameter of 3 cm which made of graphite. To achieve the equilibrium core condition, then moderator pebble will be issued slowly. At the bottom of the core on HTGR-10MWth pebble-bed is also contained a reflector made of graphite. At a distance of 210 cm from the center of the core is placed tube press (pressure vessel) made of stainless steel with a thickness of 8 cm so can be shackle of HTGR-10 MWth pebble-bed reactor. The Biological shielding with the thickness of 2 m which made of regular concrete with a density of 2.3 g / cm3 is placed 10 cm in the pressure vessel.
While the moderator pebble is made of solid graphite material. Illustrations and completed pebble fuel data are shown in Table 1 and Figure 1.
Table 1. Characteristic of Pebble Fuel and Moderator Ball [13-14] PEBBLE
Specification of KERNEL and TRISO
Specification of KERNEL Specification of TRISO Layer: Kernel
Specification of Pebble Fuel bed and moderator pebble
Specification of Pebble Fuel bed Specification of Moderator (dummy ball): Outer
Figure 1. Fuel and moderator pebble construction
In the reactor core, the ratio of the fuel pebble to the moderator on the core has a certain comparison. In this study, variations in ratio of the number fuel pebble to moderator: are: 100: 0, 80:20, 60:40, 57:43, 52:48, 50:50, 40:60 and 20:80. While pebble fuel and moderators are arranged in the form of a lattice BCC (Body Centered Cubic). The variation of the F: M ratio was performed to consider the effective moderation ratio in the reactor core
MCNP Program Packages
material making up of the reactor, the MCNP uses a process of probabilistic statistical duplication. Therefore the MCNP program package
can be used to solve complex problems in three-dimensional form and Complicated issues that can not be done by modeling using deterministic methods
In its development to date, MCNP has launched the MCNP6.1 program package. In the MCNP6.1 program package, users can perform neutronic calculations up to the calculation of burn-up. The MCNP6.1 program package utilizes a continuous energy cross-profile derived from the ENDF / B-VII.1 nuclear data library file[15-16] and features a burn-up calculation facility using the CINDER-90 depletion program[17-18]. Cinder 90 is a unique transmutation program package that has libraries of 63 cross section group consisting of 3400 nuclides, 1325 fission products, and more than 30 actinides in the atomic number range of 1≤ Z ≤103.
METHODOLOGY
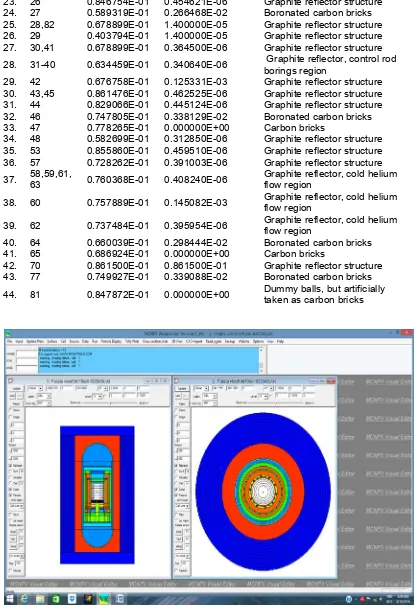
Research in this paper is done by using MCNP6.1 program package. The Research begins with modeling of HTGR-10MWth construction using MCNP6.1 program package. Data used in accordance with the description that has been described. The modeled HTGR-10MWt construction includes a diameter reactor core of 90 cm surrounded by a reflector made of graphite material for radial, top and bottom directions. Modeling is also done for the cone where fuel and moderator released, control rod channels, helium cooling channels and canals of small balls absorber, irradiation channels, RSCC space and biological shields as thick as 200 cm. The atomic density data of each HTGR-10MWt zone follows the existing atomic zone density data in HTR-10 that has been modified in accordance with the cross-profile library ENDF / B-VII. These data are used as input parameters in the MCNP6.1 program package. Description of each zone on HTGR-10Mwt can be seen in Table 2.
Table 2. Atomic zone density at HTGR-10MWth [19]
No No. zone
1. 83-90 0.851047E-01 0.456926E-06 Bottom reflector with hot helium flow borings
2. 1 0.729410E-01 0.329811E-02 Boronated carbon bricks 3. 2 0.851462E-01 0.457148E-06 Top graphite reflector 4. 3 0.145350E-01 0.780384E-07 Cold helium chamber 5. 4 0.802916E-01 0.431084E-06 Top reflector
6. 6,7,91-97 0.572501E-01 0.277884E-08 Dummy balls, simplified as graphite of lower density 7. 8 0.781408E-01 0.419537E-06 Bottom reflector structures 8. 9 0.823751E-01 0.442271E-06 Bottom reflector structures 9. 10 0.843647E-01 0.298504E-03 Bottom reflector structures 10. 11 0.817101E-01 0.156416E-03 Bottom reflector structures 11. 12 0.850790E-01 0.209092E-03 Bottom reflector structures 12. 13 0.819167E-01 0.358529E-04 Bottom reflector structures 13. 14 0.541118E-01 0.577456E-04 Bottom reflector structures 14. 15 0.332110E-01 0.178309E-06 Bottom reflector structures 15. 16 0.881811E-01 0.358866E-04 Bottom reflector structures
16.
17,55,72, 74,75,76, 78,79
0.765984E-01 0.346349E-02 Boronated carbon bricks
17. 18,56,73 0.797184E-01 0.000000E+00 Carbon bricks
18. 19 0.761157E-01 0.344166E-02 Boronated carbon bricks 19. 20 0.878374E-01 0.471597E-06 Graphite reflector structure 20. 21 0.579696E-01 0.311238E-06 Graphite reflector structure
21.
22,23,25, 49,50,52, 54,66,67, 69,71,80
0.882418E-01 0.473769E-06 Graphite reflector structure
23. 26 0.846754E-01 0.454621E-06 Graphite reflector structure 24. 27 0.589319E-01 0.266468E-02 Boronated carbon bricks 25. 28,82 0.678899E-01 1.400000E-05 Graphite reflector structure 26. 29 0.403794E-01 1.400000E-05 Graphite reflector structure 27. 30,41 0.678899E-01 0.364500E-06 Graphite reflector structure
28. 31-40 0.634459E-01 0.340640E-06 Graphite reflector, control rod borings region
29. 42 0.676758E-01 0.125331E-03 Graphite reflector structure 30. 43,45 0.861476E-01 0.462525E-06 Graphite reflector structure 31. 44 0.829066E-01 0.445124E-06 Graphite reflector structure 32. 46 0.747805E-01 0.338129E-02 Boronated carbon bricks 33. 47 0.778265E-01 0.000000E+00 Carbon bricks
34. 48 0.582699E-01 0.312850E-06 Graphite reflector structure 35. 53 0.855860E-01 0.459510E-06 Graphite reflector structure 36. 57 0.728262E-01 0.391003E-06 Graphite reflector structure
37. 58,59,61,
63 0.760368E-01 0.408240E-06
Graphite reflector, cold helium flow region
38. 60 0.757889E-01 0.145082E-03 Graphite reflector, cold helium flow region
39. 62 0.737484E-01 0.395954E-06 Graphite reflector, cold helium flow region
40. 64 0.660039E-01 0.298444E-02 Boronated carbon bricks 41. 65 0.686924E-01 0.000000E+00 Carbon bricks
42. 70 0.861500E-01 0.861500E-01 Graphite reflector structure 43. 77 0.749927E-01 0.339088E-02 Boronated carbon bricks
44. 81 0.847872E-01 0.000000E+00 Dummy balls, but artificially taken as carbon bricks
Figure 2. Results of HTGR-10MWt construction modeling using VISED program
The neutron energy distribution curve was obtained by determining the binary energy grid/group structure number in the EGS99304 program using 36 vitamin C groups. This distribution curve is needed to ensure that on the HTGR-10 MWt core there has been a nuclear reaction that transmits neutron particles. The neutron energy distribution curve for flux change per energy has a unique shape of the curve
The next stage was calculating neutron multiplication and neutron flux which had been normalized on every cell on HTGR-10 MWt core with 17% enrichment level and kernel amount at fuel pebble of 8335 curve shape. The ratio of pebble fuel to pebble moderator used is 100: 0, 80:20, 60:40, 57:43, 52:48, 50:50, 40:60 and 20:80. All calculations of neutron multiplication and neutron flux were conducted using MCNP6.1 with KCODE 2500 1.0 10 110 and KSRC 0.0 0.0 0.0 and Mode n p. Thus the calculation will follow 1000 total cycles with the first 10 cycles skipped and the source position lies on the coordinates (0,0,0). While the Tally which is used is the option Tally F4 and Tally En. Tally F4 serves to calculate the average flux in the cell while the En tally is used to obtain the flux distribution obtained by the desired energy bin.
RESULTS AND DISCUSSION
The results of the neutron energy distribution against the neutron spectrum on the HTGR-10 MWt core obtained are shown in Figure 3. This distribution curve is required to ensure that on the HTGR-10 MWt core has been a nuclear reaction with the neutron particle emitter.The resulting curve corresponds to the curves obtained by other researchers on the nuclear reactor core [20-21]. so it can be ascertained that on the HTGR- 10MWt has happened nuclear reaction.
Figure 3. Neutron spectrum profile of neutron energy at center of HTGR-10MWth core
Figure 3 shows the characteristic neutron spectrum shape on HTGR 10 MWth core. In the rapid neutron region, there is a peak decline. This condition is due to the construction on HTGR 10 MWth core is dominated by carbon element. Accordingly, many fast neutrons are moderated.
In position height 0, zone 1 or altitude 0, zone 5 shows the same shape.The higher of the neutron energy than the lower the neutron spectrum. Figure 3 also shows that the maximum neutron spectrum occurs at low neutron energies within the thermal neutron energy group with an energy interval below 0.5 eV. From the neutron spectrum curve, it can be seen that the HTGR-10 MWt reactor core dominantly emits thermal neutrons.
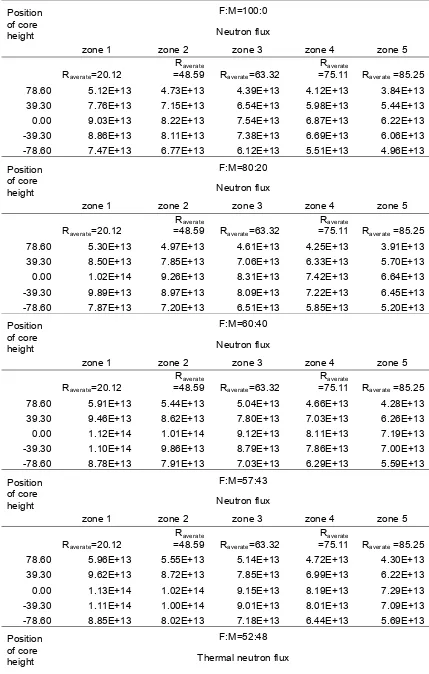
Tabel 3.Results of MCNP 6.1 for neutron flux on HTGR-10 MWth core
78.60 5.12E+13 4.73E+13 4.39E+13 4.12E+13 3.84E+13
39.30 7.76E+13 7.15E+13 6.54E+13 5.98E+13 5.44E+13
0.00 9.03E+13 8.22E+13 7.54E+13 6.87E+13 6.22E+13
-39.30 8.86E+13 8.11E+13 7.38E+13 6.69E+13 6.06E+13
-78.60 7.47E+13 6.77E+13 6.12E+13 5.51E+13 4.96E+13
Position
78.60 5.30E+13 4.97E+13 4.61E+13 4.25E+13 3.91E+13
39.30 8.50E+13 7.85E+13 7.06E+13 6.33E+13 5.70E+13
0.00 1.02E+14 9.26E+13 8.31E+13 7.42E+13 6.64E+13
-39.30 9.89E+13 8.97E+13 8.09E+13 7.22E+13 6.45E+13
-78.60 7.87E+13 7.20E+13 6.51E+13 5.85E+13 5.20E+13
Position
78.60 5.91E+13 5.44E+13 5.04E+13 4.66E+13 4.28E+13
39.30 9.46E+13 8.62E+13 7.80E+13 7.03E+13 6.26E+13
0.00 1.12E+14 1.01E+14 9.12E+13 8.11E+13 7.19E+13
-39.30 1.10E+14 9.86E+13 8.79E+13 7.86E+13 7.00E+13
-78.60 8.78E+13 7.91E+13 7.03E+13 6.29E+13 5.59E+13
Position
78.60 5.96E+13 5.55E+13 5.14E+13 4.72E+13 4.30E+13
39.30 9.62E+13 8.72E+13 7.85E+13 6.99E+13 6.22E+13
0.00 1.13E+14 1.02E+14 9.15E+13 8.19E+13 7.29E+13
-39.30 1.11E+14 1.00E+14 9.01E+13 8.01E+13 7.09E+13
-78.60 8.85E+13 8.02E+13 7.18E+13 6.44E+13 5.69E+13
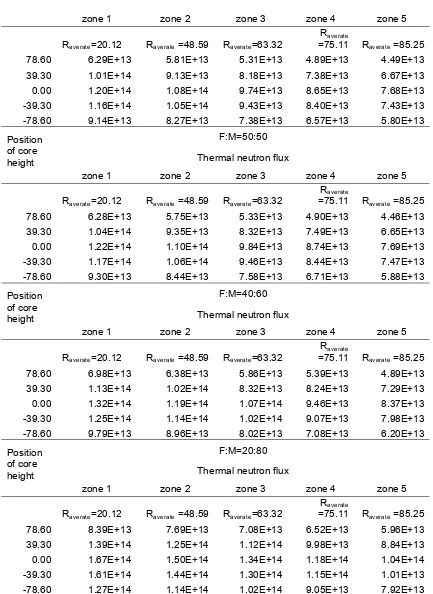
Position of core height
F:M=52:48
zone 1 zone 2 zone 3 zone 4 zone 5
Raverate=20.12 Raverate =48.59 Raverate=63.32
Raverate
=75.11 Raverate =85.25
78.60 6.29E+13 5.81E+13 5.31E+13 4.89E+13 4.49E+13
39.30 1.01E+14 9.13E+13 8.18E+13 7.38E+13 6.67E+13
0.00 1.20E+14 1.08E+14 9.74E+13 8.65E+13 7.68E+13
-39.30 1.16E+14 1.05E+14 9.43E+13 8.40E+13 7.43E+13
-78.60 9.14E+13 8.27E+13 7.38E+13 6.57E+13 5.80E+13
Position
78.60 6.28E+13 5.75E+13 5.33E+13 4.90E+13 4.46E+13
39.30 1.04E+14 9.35E+13 8.32E+13 7.49E+13 6.65E+13
0.00 1.22E+14 1.10E+14 9.84E+13 8.74E+13 7.69E+13
-39.30 1.17E+14 1.06E+14 9.46E+13 8.44E+13 7.47E+13
-78.60 9.30E+13 8.44E+13 7.58E+13 6.71E+13 5.88E+13
Position
78.60 6.98E+13 6.38E+13 5.86E+13 5.39E+13 4.89E+13
39.30 1.13E+14 1.02E+14 8.32E+13 8.24E+13 7.29E+13
0.00 1.32E+14 1.19E+14 1.07E+14 9.46E+13 8.37E+13
-39.30 1.25E+14 1.14E+14 1.02E+14 9.07E+13 7.98E+13
-78.60 9.79E+13 8.96E+13 8.02E+13 7.08E+13 6.20E+13
Position
78.60 8.39E+13 7.69E+13 7.08E+13 6.52E+13 5.96E+13
39.30 1.39E+14 1.25E+14 1.12E+14 9.98E+13 8.84E+13
0.00 1.67E+14 1.50E+14 1.34E+14 1.18E+14 1.04E+14
-39.30 1.61E+14 1.44E+14 1.30E+14 1.15E+14 1.01E+13
-78.60 1.27E+14 1.14E+14 1.02E+14 9.05E+13 7.92E+13
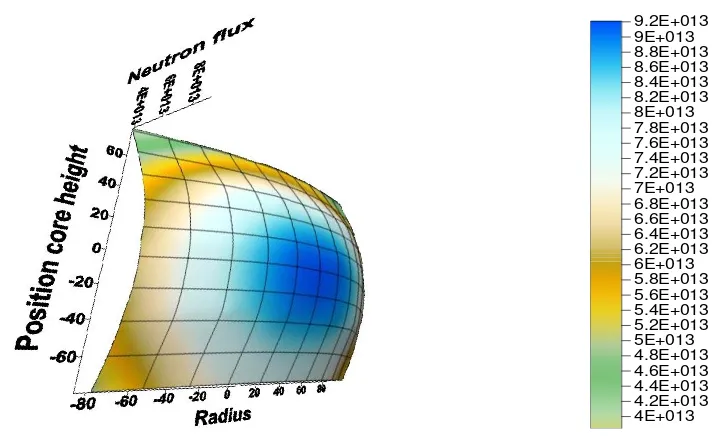
Figure 4. Profile of neutron flux on HTGR-10 MWt in 3-dimensional form F: M = 100: 0
Table 3 and Figure 4, shows that the largest neutron flux is in the middle of the HTGR-10 MWth core at height position of 0 cm and at an interval of 20.12 cm radius zone which is at the center of the terrace and the zone became the center of a nuclear reaction.
Description of the maximum neutron flux distribution based on F: M variation by using the 2-dimensional graph for axial neutron flux distribution can be seen in Figure 5 while for neutron flux radial distribution shown in Figure 6. From Figure 5 it can be seen that the highest neutron flux value occurs when the ratio F: M = 20: 80 while the smallest neutron flux occurs when the ratio F: M = 100: 0. This condition indicates that the more moderator balls that filled the HTGR-10 MWth core then the greater the neutron interaction. In addition from Figure 5 it also gives information that for all FM ratio, the neutron flux value will be lower when the position height of core is higher or lower altitude positions. While from Figure 6 shows that the greater the radius of the core (the more towards the reflector) the more decreasing the value of flux neutrons that occur. While based on the ratio F: M the highest neutron flux distribution value occurs at F: M = 20:80 and the lowest flux distribution value occurs at F: M = 100: 0.
Figure 5. Axial neutron flux distribution for variation F: M at the center core of the radial direction
(R radial) = 0
Figure 6. The radial neutron flux distribution for variation F: M at altitude 0
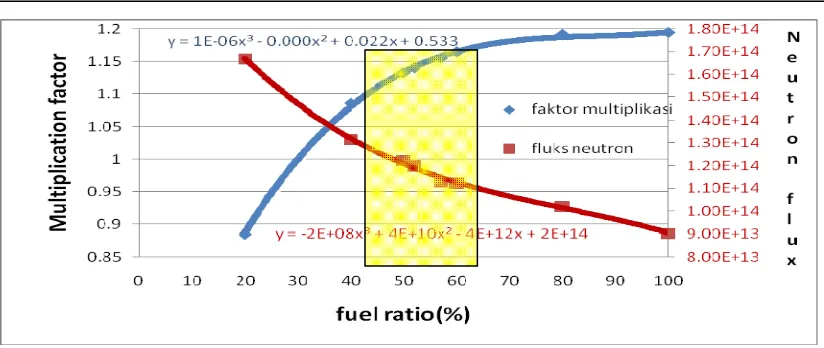
The relationship of neutron flux and the multiplication value against for fuel ratio can be seen in Figure 7. Figure 7, explains that the higher the fuel ratio to the moderator entering the reactor core will result in increased neutron multiplication value following the equation :
y = 0,000001 x3 + 0,022 x + 0,1 (1) Where :
y : multiplication factor x : fuel ratio (%)
This condition is caused by the more fuel the U-238 enriched or the more moderators inside the core will cause the larger the moderated neutrons so the more neutrons that
pound the fuel kernel.Different is indicated by neutron flux, the higher the ratio of fuel to the
moderator that goes into the reactor core will result in low flux value of neutrons following the equation :
y = -2,0 108 + 4,0 1010 x2 + 2,0 1014 (2) where :
y : neutron flux x : fuel ratio (%)
The more moderators that get into the core then its causing more fuel burning so that the higher the burnup happens. It is therefore necessary to find the optimal co nditions for
the multiplication value to be in the range of values keff = 1.03 to accommodate the reactivity
occurs while the flux value of neutrons remains high. Figure 7, shows that optimum
conditions can be achieved when the ratio of fuel to the moderator is in the interval of 40% to 60%.
Figure 7. Multiplication factor curve and neutron flux on fuel ratio on HTGR-10MWth
CONCLUSION
From the calculation of neutron flux with all the control rods conditions fully lifted is in the middle of the HTGR-10 MWth core at a height of 0 cm and at a radius of 20.12 cm is the nuclear reaction center. The more moderator ratio put into the core will result in higher neutron flux values.
The highest neutron flux value can reach 1.32E + 14 n / cm2 det at F: M = 40:60 with height of 0 cm and radius 20,12 cm (zone 1)Optimal neutron flux conditions can be achieved when the ratio of fuel to the moderator is in the range of 40% to 60%.
ACKNOWLEDGMENT
The author would like to thank Saiful Bahri Ph D. as the Head of Reactor Physics and Technology Division (BFTR) - PTKRN BATAN for his suggestion and improvement so that this paper can be written and completed properly. Encouragement and help and discussion from our BFTR colleagues are greatly appreciated
REFERENCES
1. HERY ADRIAL, “Efek Fraksi Pebble Dalam Perhitungan Koefisien Reaktivitas Doppler RGTT200K”, Prosiding Seminar Nasional Sains dan Teknologi Nuklir PTNBR – BATAN Bandung, 4 Juli 2013
2. Rômulo V. Sousa, Clarysson A. M. Silva, Ângela Fortini, et al,” A Neutronic Evaluation
of the HTR-10 Using Scale, MCNPX and MCNP5 Nuclear Codes”, Proc. ASME. 45936;
Volume 3: Next Generation Reactors and Advanced Reactors; Nuclear Safety and Security, V003T05A034.July 07, 2014
3. Fubing Chen, Yujie Dong, and Zuoyi Zhang, “Temperature Response of the HTR-10 during the Power Ascension Test”, Science and Technology of Nuclear Installations Volume 2015 (2015)
4. ZUHAIR dan SUWOTO, ” Studi Perhitungan Faktor Multiplikasi Reaktor Pebble-Bed Sebagai
Fungsi Radius Kernel Bahan Bakar pada Berbagai Pengkayaan”, Prosiding Pertemuan dan Presentasi Ilmiah Penelitian Dasar Ilmu Pengetahuan dan Teknologi Nuklir, Yogyakarta, 14 Juli 2009.
5. Hans D. Gougar, R. Sonat Sen,” On The Evaluation Of Pebble Bead Reactor Critical Experiments Using The Pebbed Code”, Proceedings of the HTR 2014 Weihai, China, October 27-31, 2014
6. Peng Huang, Xihua Liang and Xiaoming Chen,” The Operation Characteristics Of The Fuel Handling System Of HTR-10”, Proceedings of the 18th International Conference on Nuclear Engineering ICONE18 May 17-21, 2010, Xi'an, China.
8. Meng-Jen Wang, Rong-Jiun Sheu, Jinn-Jer Peir, et al,” Criticality calculations of the HTR-10 pebble-bed reactor with SCALE6/CSAS6 and MCNP5”, Annals of Nuclear Energy”, Annals of Nuclear Energy Volume 64, Pages 1-518 (February 2014).
9. ZUHAIR dan SUWOTO, ”Analisis Perhitungan Koefisien Reaktivitas Bahan Bakar dan Moderator Teras RGTT200K”, Prosiding Seminar Nasional Sains dan Teknologi Nuklir, Bandung, 4 Juli 2013.
10. X-5 MONTE CARLO TEAM,”Monte Carlo N–Particle Transport Code System Including MCNP6.1, MCNP5-1.60, MCNPX-2.7.0 and Data Libraries, 2013
11. X-5 MONTE CARLO TEAM MCNP–A General Monte Carlo N-Particle Transport Code,Version 5 - Vol. I: Overview and Theory, LA-UR-03-1987 (April 2003, revised 2/1/2008).
12. Zuhair, Suwoto, dan Ign. Djoko Irianto A, “Analisis Perhitungan Koefisien Reaktivitas Doppler Partikel Triso Reaktor Temperatur Tinggi”, Jurnal Pengembangan Energi Nuklir Vol. 13 No. 1, Juni 2011
13. Volkan ¸Seker, Üner Çolak ,” HTR-10 full core first criticality analysis with MCNP”, Nuclear Engineering and Design 222 (2003) 263–270
14.
Zuhair, Suwoto, Putranto Ilham Yazid, et al,”
Studi Model Benchmark Mcnp6Dalam Perhitungan Reaktivitas Batang Kendali HTR-10”,
Jurnal Iptek Nuklir
Ganendra Ganendra Journal of Nuclear Science and Technology Vol. 9,
No. 2, Juli 2016: 95-103
15. Do Heon Kim*, Choong-Sup Gil,and Young-Ouk Lee , “Current Status of ACE Format
Libraries for MCNP at Nuclear Data Center of KAERI", J Radiat Prot Res 2016; 41(3): 191-195
16. Holly R. Trellue, Robert C. Little, Morgan C. White, et al, “ENDF70: A Continuous-Energy MCNP Neutron Data Library Based on ENDF/B-VII.0”, Nuclear
Technology / Volume 168 / Number 3 / December 2009 / Pages 832-836
17. Eleonora Bomboni, Nicola Cerullo, Emil Fridman, et al, “Comparison Among MCNP-Based Depletion Codes Applied To Burnup Calculations Of Pebble-Bed HTR Lattices”, Nuclear Engineering and Design 204:918-924 · April 2010
18. Sung-Min Kim and Myung Hyun Kim, “A Study on MCNPX-CINDER90 System for Activation Analysis”, Transactions of the Korean Nuclear Society Autumn Meeting Pyeongchang, Korea, October 30-31, 2014
19. WILLIAM K. TERRY, ET AL, “Evaluation Of The Initial Critical Configuration Of The
Htr-10 Pebble-Bed Reactor”. HTR10-GCR-RESR-001 CRIT-REAC, NEA/NSC/DOC(2006)
20. K Tiyapun1 , M Chimtin, S Munsorn,ët al,” Validation Of The MCNP Computational Model For Neutron Flux Distribution With The Neutron Activation Analysis Measurement”, Journal of Physics: Conference Series 611 (2015) 012007
21. Amir Hamzah, “Analisis Laju Dosis Neutron Reaktor PLTN PWR 1000 MWe Menggunakan Program MCNP:, J. Tek. Reaktor. Nukl. Vol. 14 No.2 Juni 2012, Hal. 65-75.
DISKUSI/TANYA JAWAB:
1. PERTANYAAN: Ihda Husnayani (PTKRN–BATAN)
Kenapa bila F:M=100:0 nilai fluks nya lebih rendah dibandingkan yang lain?
JAWABAN: Hery Adrial (PTKRN - BATAN)
Pada kondisi F:M = 100: 0 maka pada teras reaktor tidak terdapat bola-bola
![Table 1. Characteristic of Pebble Fuel and Moderator Ball [13-14]](https://thumb-ap.123doks.com/thumbv2/123dok/4033019.1976439/3.595.99.513.116.600/table-characteristic-pebble-fuel-moderator-ball.webp)
![Table 2. Atomic zone density at HTGR-10MWth [19] Atomic density](https://thumb-ap.123doks.com/thumbv2/123dok/4033019.1976439/4.595.83.498.390.786/table-atomic-zone-density-htgr-mwth-atomic-density.webp)