Lecturer Profile, Student Satisfaction Rate and
Teaching Method, Its Contribution to the Passing
Rate
Juniarti
1, Sany
2Petra Christian University
1
yunie@peter. petra.ac.id
Abstract. Petra Christian University Faculty of Economics, which consists of 8 programs is one of the faculties which has developed a core competency courses. This courses must be taken by students in all study programs under the Faculty of Economics. To maintain the quality of teaching, faculty management has facilitated with a variety of ways, including debriefing the lecturers, tightly selecting the part-timer lecturers, providing textbooks and various other learning tools. In addition, periodically, the faculty also conducts an evaluation of teaching through a questionnaire to obtain feedback from students related to teaching and learning process. The teachers who obtain a good evaluation score will accept an award as a faculty appreciation of their performance, this activities are called 'faculty award'.
However, these efforts have not achieved optimal results, because the percentage of classes with passing rate less than 70% is still quite low. Therefore, It is needed to conduct an in-depth review with empirical data to get comprehensive information about the factors that influence the passing rate of core competency courses in the Faculty of Economics. The results are then expected to be useful as one of the considerations for determining the policies and efforts to improve the teaching process of Faculty core competency courses. This study will examine whether the lecturer profile, student satisfaction rate that represented by lecture performance score and teaching methodology have a contribution to the passing rate.
Keywords—faculty core competency courses, lecturer profile, student satisfaction rate, teaching methodology, passing rate
INTRODUCTION
The success of the academic process characterized by the efficiency of the teaching and learning process, the level of student satisfaction towards the learning process, and student success rate in taking a particular course. The efficiency of university teaching and the levels of student satisfaction have been a common focus of academic work of great import to the university system and its quality control (Tejedor, J 2002). Universities and educational institutions are aware of the importance of maintaining the quality of teaching and learning process, that is why it has a lot of efforts in improving the quality of teaching and learning. Another seriousness in maintaining quality of education authorities is proved by requirement to set up quality assurance system in each of education institution, especially in higher education.
Institution, either universities or school have an important role in the student achievement, since such institutions are interested to prove their performance to stakeholder. Ferguson (1991) suggest that teacher qualification has an influence in student achievement as well as class size ( Glass et. al 1982, Mosteller et al 1985)., On the other hand, other researcher believed that school just has a little contribution in student achievement. Though it was debatable about universities role in the student
achievement, but many other researches have proved a solid finding that there is an association between many aspect of universities such as teacher experience, teacher education, teaching method to the student achievement.
Faculty of Economics Petra Christian university has facilitated teaching process to enhance student achievement in core competence courses. Unfortunately, certain classes of core competence has not yet reached the minimum standard of percentage of passing rate i.e 70% per class. In-depth study is required to reveal which factors that influence passing rate, so it could contribute and promote more effective policy by the faculty authority.
PREVIOUS RESEARCH
i. Lecturer Profile and Passing Rate
of teacher experience and teacher license test scores on student achievement in North Carolina.
Darling-Hammond (2000), also confirm previous studies through their research which revealed that teacher quality variables appear to be more strongly related to student achievement than class sizes, overall spending levels, teacher salaries at least when unadjusted for cost of living differentials), or such factors as the statewide proportion of staff who are teachers. Furthermore, Darling-Hammond (2000) also revealed that among variables assessing teacher "quality," the percentage of teachers with full certification and a major in the field is a more powerful predictor of student achievement than teachers' education levels (e.g., master's degrees). Moreover, Harris and Tim (2007) find out that more experienced teachers appear more effective in teaching elementary math and reading and middle school math.
Hanushek (1971) in his study about teacher characteristics and gains in student achievement using micro data suggest that teaching experience and graduate education do not contribute to gains in student achievement scores. Betts et al. (2003) find mixed results for teacher characteristics using detailed individual-level data from elementary schools in the San Diego Unified School Distric. Similar results are also shown by Jepsen and Rivkin (2002) using grade-level data from California, they found that teachers experience are associated with student test score, while teacher education and certification have no systematic relationship with achievement.. RAND researchers (2009) found no evidence that these standards i.e teacher characteristic have a substantial effect on student achievement in Los Angeles public elementary, middle, and high schools. However, the lack of significant effects for these teacher characteristics should not be interpreted as evidence that teachers have no impact on student achievement (Jepsen 2005). According to Kasoko, and Oyedoko (2008) indicate generally relationship exist among
the 3 teacher’s profile i.e teacher self-efficacy, teacher’s
training and teacher’s attitude and pupil’s academic
achievement.
ii. Student’s Satisfaction and Passing Rate
At the end of semester, Faculty of Economics, Petra Christian University has always asked student feedback
related to the lecturer’s performance by filling out the
questionnaire. This such assessment of learning outcomes and quality through student evaluation is considered by many as being the single most valid source of data on teaching effectiveness (Kelly, Ponton, & Rovai 2007).
The more students satisfy with the performance of lecturers, the greater the likelihood of students successfully. During in its depth investigation, The Vice-Chancellor’s Office for Quality, Universidad de Oviedo, suggest that student are more satisfied with teaching in subject with a higher pass rate. Similarly, Kelly et al. (2007) found that
students’ evaluation of the course was related to factors
related to instructor attributes, course content and
organization as well as factors related to grading and assessment.
Students overall satisfaction with the course has been found to be associated with a number of factors. Kim, Liu and Bonk (2005) in Wong and Jason (2008) found students satisfaction with the course was positively related to factors which included students feeling they had learned a lot, their sense of community in the class, their engagement in learning, the use of a range of learning techniques, their academic confidence and prompt feedback from the instructor.
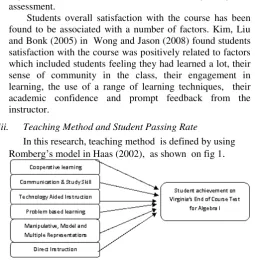
iii. Teaching Method and Student Passing Rate
In this research, teaching method is defined by using Romberg’s model in Haas (2002), as shown on fig 1
.
Figure 1.Theoretical model explaining algebra student achievement by teaching methods (Romberg 1998) in Haas (2002)
Teaching method play an important role in student achievement. According to Haas (2002), the teaching method categories accounted for 9.7% of the variance in
teachers’students’ mean scale scores for the End of Course SOL Test for Algebra I. Further, this research also rank the teacher method categories based on meta analysis and find out that the consecutive strongest variable as follow : direct instruction, problem based learning, technology aided instruction cooperative learning, manipulative model and multiple representations and communication and study skill. Although, Haas (2002) suggest that teacher should emphasize on the three highest of teaching category i.e. direct instruction, problem based learning, technology aided instruction, however this research do not include problem based learning. The exclution of problem based learning from teaching method is due to this method is not widely used in teaching core competence courses. Instead, we use cooperative learning and technology aided as the proxies of teaching method. Moreover, as a preliminary study, this research is not intended to investigate deeply which teaching method is proper, but just to describe roughly whether teaching method contribute to the student achievement or not. Therefore, the selection of teaching category is accustomed with the research objective.
defined as a method of instruction characterized by students working together to reach a common goal (Haas 2002)
Research has shown that cooperative learning techniques will promote student learning and academic achievement, increase student retention, enhance student satisfaction with their learning experience, help students develop skills in oral communication, develop students' social skills, promote student self-esteem and help to promote positive race relations.
Chapman and Kenneth (2006), though humble in scope, demonstrate that the use of cooperative learning groups in a rigorous college level course enhances overall student achievement. The percentage of students who dropped or failed the class for the control group was 29 + 5%., while the percentage of students who dropped or failed the class for the treated group was 13 + 2%. Conversely the pass rate for the control group was 71%, while the pass rate for the treated group increased 23 % (p<0.05) to 87%.
Another powerful teaching method is direct instruction. Binder and Watkins (2000), concluded that precision teaching and direct instruction are mature and extremely powerful instructional technologies that are fully capable of erasing America’s “basic skills crisis” if widely adopted. (Mercer 1997 ) in ( Din 2000) defined direct instruction is as an instructional sequence that includes demonstration, controlled practice with prompts and feedback, and independent practice with feedback. In his study, Din (2000) suggested that the integrated direct instruction approach, when used appropriately, can be both effective and efficient in helping students improve their basic math.
Recently, the using of technology as an aided instruction is become more popular among educator (Collins et al 2008). There are various of using technologies, ranging from simple to complex. Haas (2002), defined technology aided instruction (TAI) as a method of instruction characterized by using computer software application and/or hand-held calculators to enhance instruction. According to Collins et al (2008), shown that the use of Computer Aided Instruction (CAI) is pedagogically effective and that currently available applications are easy to integrate into the student’s in-class experience. It is shown that the use of CAI significantly increased student final exam grades.
RESEARCH METHOD
i. Context of research
Faculty of economics, Petra Christian University has established core competence course that are required for all student under the faculty of economics. The courses in core competence consist of 5 categories i.e accounting, business and management, business, economics, and humanity.
The purposes of the establishment of core competency courses are to equip students under the Faculty of Economics with the basic knowledge of economics and to promote sharing resources among study program.
Unfortunately, the success rate of student in core competency courses do not reach the minimum standard of percentage of passing rate i.e 70% per class. Based on the database of Faculty of Economics, the percentage of classes with passing rate less than 70% is still quite low. This issue become a concern to the faculty policy maker, due to student achievement is one of the indicators of faculty efficiency, in addition, it is also a focus for parents and policy makers (Jepsen 2005).
Therefore, it is needed to conduct a preliminary research. The main objective of this research is to depict what factor that should be focused in teaching and learning process to improve student passing rate.
ii. Operationalisation of Variables
Based on previous research and research context, this study proposed the factors that influence student passing rate, i.e lecturer profile, student satisfaction rate, and teaching methods. For the purposes of this study, the lecturer profile is defined as a teacher quality that is characterized by lecturer experience (Ackerman et. al 2006, Clotfelter et al. 2003, Darling-Hammond 2000), and lecturer rank. Lecturer rank is considered more appropriate in this study, because it is an academic achievement of lecturer that proved his competence in teaching, research and community services. To achieve a higher rank, a lecturer need to accumulate certain score in teaching, research and community service. Therefore, in this study, higher lecturer rank is considered as a higher lecturer competency. Lecturer rank consist of 4 degree i.e Teaching Assistant, Assistant Professor, Associate Professor and Professor.
Student satisfaction rate is a level of student satisfaction with the lecturer performance. In Faculty of Economics, student satisfaction rate is used to measure lecturer performance from the student’s view. The measurement include 6 aspects i.e academic value, tangible, reliability, responsiveness, assurance and empathy. Faculty of Economics also has developed tools to measure student satisfaction rate. These tools have been tested to ensure its validity, before it is applied in regular survey by faculty of economics. In this study, we do not carry out our own survey to obtain the data of student satisfaction rate, but only use available data from Faculty of Economics.
Other proposed variable influence passing rate is teaching methods. For the purpose of study, teaching methods chosen are direct instruction, cooperative learning and technology aided instruction. Summary of research variables and operationalisation are presented in Table 1, below.
TABLE 1
OPERATIONALISATION OF VARIABLES
Lecturer profile Years experience of the lecturer
teaching the
Research model employed in this study is formulized as follow :
PassR = α + β1 Exp+ β2Rank+ β3SatisR+ β4DI + β5 CL+
β6TAI+ε [1].
The above research model, hereinafter referred to as model one, cover some research hypothesis below:
H1A There is an impact of lecturer experience to student passing rate
H2A There is an impact of lecturer rank to student passing rate
H6A There is an impact of technology aided instruction to student passing rate
The survey to assess the level of student satisfaction rate is conducted at final exam, where students have received a portion of the test results. Therefore we are concern that the student assessment of lecturer performance is no longer objective. It means that students who are likely to pass a certain level courses may be satisfied with the performance of lecturers. It is contrary with our suggestion
that higher students satisfaction rate drive students more enthusiastic toward the subject delivered, and finally make them success in certain core competency courses.
Therefore, to reach a consistency of the result of model one, especially hypothesis 3A, we will also test whether there is an existence impact of student passing rate to student satisfaction. Based on our concern above, now we propose the second research model as follow :
SatisR = α + β1 Exp+ β2Rank+ β3PassR + β4DI + β5 CL+
β6TAI+ε [2].
Meanwhile, the hypothesis for model two are as follow :
H7A There is an impact of lecturer experience to student
H11A There is an impact of cooperative learning method to student satisfaction rate
H12A There is an impact to technology aided instruction to student satisfaction rate
iv. Research sample
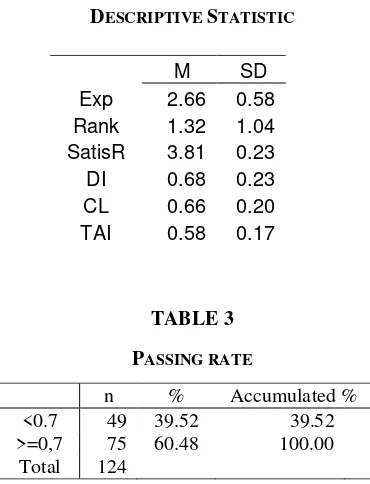
Research sample is all core competency classes that meet with the criteria of the sample, i.e classes are handled by fulltime lecturer who answer question completely and has satisfaction rate data. The summary of sample selection is below :
TABLE 2
DESCRIPTIVE STATISTIC
TABLE 3
PASSING RATE
ii. Model one: Lecturer Profile, Student Satisfaction Rate and Teaching Methods to Passing Rate
The Goodness of Fit test valued adjusted R2 = 0,301 shown in table 4 indicate that the value of the dependent variable can be explained by 30,1% of the independent variables. This value can be considered sufficient because passing rate is influenced by many factors beside the teaching methods, student satisfaction, and lecturer profile.
TABLE 4
MODEL SUMMARY OF MODEL ONE
The F test of the regression analysis shows the result as seen in table 5. The p-value is 0,000 which is less than 0,05 means that the hypothesis of model 1 is supported, that is there is an impact of the independent variables to dependant variable. This means that the independent variables (lecturer profile, student satisfaction, and teaching methods) altogether have significant impact to dependent variable (passing rate).
TABLE 5
F TEST (ANOVA) OF MODEL ONE
TABLE 6.
T TEST RESULT (COEFFICIENTS) OF MODEL ONE
The t test is used to indicate the relative impact of individual variable to the dependent variable. The results in table 6 shows that variable Rank, SatisR (satisfaction rate), CL (cooperative learning), and TAI (technology aided instruction) are significant predictors of passing rate at significance level 0,05. Among the independent variable, SatisR is the most significant predictor (sig .000) of passing rate. Variable DI and Exp is not significantly associated with passing rate at significance level 0,05, however both variable DI and Exp are significant predictors of passing rate at significance level 0,10.
iii. Model two: Lecturer Profile, Passing Rate and Teaching Methods to Student Satisfcation Rate
In model two, we will test whether there is an impact of student passing rate to student satisfaction rate, since the survey to assess student satisfaction rate is conducted when students have already receive a portion of the test results. That is why we concern that student assessment on lecturer performance will no longer objective and it is possible to distort the implication of model one results.
Based on the test of model two, the Goodness of Fit test valued adjusted R2 = 0,387 shown in table 7 indicate that the value of the dependent variable can be explained by 38% of the independent variables. This value can be considered sufficient because student satisfaction rate is influenced by many factors beside the lecturer profile, passing rate, and teaching methods.
.579a .335 .301 .16106
Model 1
R R Square
Adjusted R Square
Std. Error of the Estimate
Predictors: (Constant), TAI, Ex p, CL, SatisR, Rank, DI a.
Dependent Variable: Pas sR b.
1.529 6 .255 9.825 .000a
3.035 117 .026
4.564 123
Regression Residual Total Model 1
Sum of
Squares df Mean Square F Sig.
Predictors: (Constant), TA I, Ex p, CL, SatisR, Rank, DI a.
Dependent Variable: Pass R b.
-.896 .255 -3.507 .001
.069 .035 .208 1.964 .052
-.064 .019 -.347 -3.378 .001
.349 .075 .421 4.646 .000
-.217 .121 -.254 -1.789 .076
.315 .110 .332 2.870 .005
.236 .113 .203 2.084 .039
(Cons tant) Ex p Rank SatisR DI CL TA I Model 1
B Std. Error
Unstandardiz ed Coef f icients
Beta Standardized
Coef f icients
t Sig.
Dependent Variable: Pass R a.
M SD
Exp 2.66 0.58
Rank 1.32 1.04
SatisR 3.81 0.23
DI 0.68 0.23
CL 0.66 0.20
TAI 0.58 0.17
n % Accumulated %
<0.7 49 39.52 39.52 >=0,7 75 60.48 100.00
TABLE 7
MODEL SUMMARY OF MODEL TWO
The F test of the second model shows the result as seen in table 8. With the p-value 0,000, the hypothesis of model two is supported, that is there is an impact of the independent variables to dependant variable. This means
that the independent variables (lecturer’s profile, passing
rate and teaching methods) altogether have significant impact to dependent variable (student satisfaction rate).
TABLE 8
F TEST (ANOVA) OF MODEL TWO
The t test results of model two is shown in table 9. The result shows that variable Rank, PassR (passing rate), and TAI (technology aided instruction) are significant predictors of satisfaction rate at significance level 0,05. Among the independent variable, Rank and SatisR are very significant predictors of satisfaction rate. Variable Exp, DI and CL has no significantly impact to passing rate.
TABLE 9.
T TEST RESULT (COEFFICIENTS) OF MODEL TWO
iv. Discussion and Finding
Based on the test result, model one of this study confirm that lecturer profile, student satisfaction rate and teaching methods have a significant impact to passing rate, with goodness of fit 0.301 and F test significant at p-value 0,000. Though each variable is significant at a significance level 0,05 and 0,10, however, not all variables have a positive sign i.e Rank and DI. Rank has a significant negative impact to passing rate. The possible explanation of this result is lecturers with higher rank may delivered to
many beyond the subject content, so it is possible to make students confuse.
Implication of the finding of model one is faculty authority should pay attention to the student satisfaction due to this variable has the highest contribution to the student success. Further, teaching methods also need to be continuously developed to increase passing rate. On the other hand the faculty authority should establish the policy to assure that the lecturers are delivering material as required. This suggestion is proposed due to the finding that lecturer rank has negative significant impact to passing rate.
Unfortunately, our concern that the result of model one distorted is occurred. It is proved by the result of model two that confirm that passing rate has a significant impact to student satisfaction rate. Besides, model two has a higher goodness of fit than model one , that is 0,387compared with 0,301, it means that model two has a better prediction than model one . Briefly, the results of model two imply that student will be satisfied if they have a higher possibility to pass certain courses. Possible negative impacts in accordance with the findings of model two is on the behavior of lecturer in teaching process. Lecturers have an interested to influence student assessment on lecturer performance through easy to pass.
The finding of model two should be considered in follow up the results of model one, particularly in improving student satisfaction rate. We suggest that student satisfaction do not directly related with lecturer performance. There is a tendency that lecturer try to make student easy to pass in order to get positive feedback from student. Assessment of lecturer performance only from student’s view could be bias and misleading. Lecturer performance should be assessed with other various performance measurement . This suggestion is supported by Aleamoni (1981) in Coburn (1984) stated that the way student ratings are used is of utmost importance. All who use the ratings must be careful to avoid placing inappropriate emphasis on selected student responses. Ideally, student ratings are but one component of a comprehensive instructional evaluation system.
CONCLUSION
Model one of this study confirm the prior research results that suggest lecturer performance has an impact to passing rate as well as student satisfaction rate and teaching method. Model one, also indicate that student satisfaction rate has the most significant impact to passing rate. However, this finding must be followed up carefully, considering the results of model two.
As a preliminary study, this research give an insight to the faculty policy maker to make a proper policy in order to increase student passing rate through develop lecturer quality, teaching method and also other various lecturer
Predictors: (Constant), TAI, Ex p, CL, PassR, Rank, DI a.
Further study need to investigate which aspect of satisfaction (academic value, tangible, reliability, responsiveness, assurance and empathy) has the most significant impact to passing rate. In addition to, there is still open the opportunity to examine thoroughly other various teaching method to passing rate with a larger sample.
REFERENCES
Ackerman, T.,T. Heafner and D. Bartz. (2006). An Examination of the Relationship between Teacher Quality and Student Achievement. Paper presented at the 2006 annual meeting of the American Edu. Res. Assoc. San Fransisco, California.
Betts, Julian R., Andrew C. Zau and Lorien A. Rice. (2003). Determinants of StudentAchievement: New Evidence from San Diego. San Diego: Public Policy Institute ofCalifornia.
C. Jepsen (2005). Teacher characteristic and achievement : evidence from teacher survey. Journal of Urban Economics., 57, 302-319
C. Jepsen, S. Rivkin, What is the tradeoff between smaller classes and teacher quality?Working paper 9205, NBER, 2002.
C.T. Clotfelter, H.F. Ladd, J.L. Vigdor, Teacher sorting, teacher shopping, and the assessment of teacher
Chapman , Paul ; Kenneth Blemings (2006). Improving Retention Rates in Biochemistry: A Quasi-Experiment . Radical Pedagogy. West Virginia University.
Cobur, Louisa (1984). Student evaluation of teacher performance. ERIC Clearinghouse on Tests Measurement and Evaluation Princeton NJ
Collins, David ; Alan Deck ; Myra McCrickard (2008). Journal of College Teaching and Learning, 5, 11, 49-58
Darling-Hammond, L, 2000. Teacher Quality and Student Achievement: A Review of State-Policy Evidence. Education Policy Analysis Archives, 8, 1
D.A. Kasoko, Oyedeko. (2008). Correlate of Teacher Profiles on Pupils Academic Achievement. The Social Sciences 3 (1): 6-11
Din, F.S. (2000). Direct Instruction in remedial match instruction . National Forum of Special Education Journal. Vol 9E
E. Hanushek (1971). Teacher characteristics and gains in student achievement: estimation using micro data, American Economic Review 61 280–288.
F.D., York, R.L. (1966). Equality of educational opportunity. Washington, DC: U.S. Government Printing Office.
Ferguson, R.F. (1991, Summer). Paying for public education: New evidence on how and why money matters. Harvard Journal on Legislation, 28,2, 465-498.
Glass, G.V; Cahen, L.S.; Smith, M.L.; and Filby, N.N. (1982). School class
size:Research and Policy. Beverly Hills, CA: SAGE Publications.
Haas, Mathew Steven (2002). The Influence of Teaching Method on Student’s Achievement on Virginia’s End of Course Standards of Learning
Test for Algebra I. Dissertation. Virginia Polytechnic Institute and State University.
Harris Douglas N. Tim R. Sass. (2007). Teacher, Training, Teacher Quality and Student Achievement. National Center for Analysis of Longitudinal Data in Education Research . Working Paper, March 2007.
J. Betts, A. Zau, L. Rice, Determinants of Student Achievement: New Evidences from San Diego, Public Policy Institute of California, San Francisco, 2003.
Kelly, H. F., Ponton, M. K., & Rovai, A. P. (2007). A comparison of student evaluations of teaching between online and face-to-face courses.
Internet and Higher Education, 10, 89-101.
Mosteller, F. (1995). The Tennessee study of class size in the early school grades. The Future of Children, 5, 2, 113- 127
RAND Education (2009). What Teacher Characteristics Affect Student Achievement? : Findings from Los Angeles Public Schools . RP-1410 at http://www.rand.org/pubs/reprints/RP1410/).
Tella A., 2006. Teachers variable as predictors of primary school pupil’s academic achievement. Paper presented at the 1st African Conference on Universal Basic Education. University of Botswana.