99
LAMPIRAN A
HASIL UJI MUTU FISIK GRANUL BAHAN KO-PROSES
Formula Replikasi Carr’s Index (%) Persyaratan (%) Hausner Ratio Persyaratan F1 I II III Rata-rata ± SD 24,20 23,50 22,30 23,33 0,96
21-25 = agak buruk (Hadisoewignyo dan Fudholi, 2013)
1,31 1,29 1,3 1,3 0,01 < 1,25 (Mathpati et al, 2012) F2 I II III Rata-rata ± SD 20,20 20,40 20,10 20,23 0,15
21-25 = agak buruk (Hadisoewignyo dan Fudholi, 2013)
1,25 1,26 1,25 1,25 0,01 < 1,25 (Mathpati et al, 2012) F3 I II III Rata-rata ± SD 21,00 23,10 22,80 22,30 1,14
21-25 = agak buruk (Hadisoewignyo dan Fudholi, 2013)
1,25 1,3 1,31 1,28 0,03 < 1,25 (Mathpati et al, 2012) F4 I II III Rata-rata ± SD 24,00 25,20 22,90 24,03 1,15
21-25 = agak buruk (Hadisoewignyo dan Fudholi, 2013)
1,31 1,33 1,29 1,31 0,02 < 1,25 (Mathpati et al, 2012) F5 I II III Rata-rata ± SD 20,00 20,00 20,80 20,27 0,46
21-25 = agak buruk (Hadisoewignyo dan Fudholi, 2013)
1,25 1,25 1,26 1,25 0,01 < 1,25 (Mathpati et al, 2012) F6 I II III Rata-rata ± SD 19,80 22,10 18,20 20,03 1,96
21-25 = agak buruk (Hadisoewignyo dan Fudholi, 2013)
1,24 1,28 1,22 1,24 0,03 < 1,25 (Mathpati et al, 2012) F7 I II III Rata-rata ± SD 23,90 25,00 21,00 23,30 2,07
21-25 = agak buruk (Hadisoewignyo dan Fudholi, 2013)
1,31 1,33 1,26 1,3 0,036 < 1,25 (Mathpati et al, 2012) F8 I II III Rata-rata ± SD 19,00 22,00 21,00 20,67 1,53
21-25 = agak buruk (Hadisoewignyo dan Fudholi, 2013)
Hasil Uji Kelembapan
Formula Kelembapan (%) Persyarat
an
F1 F2 F3 F4 F5 F6 F7 F8
Replikasi I Replikasi II Replikasi III 2,56 2,85 2,96 2,65 2,87 2,21 3,58 2,69 2,89 2,89 2,48 2,47 2,77 1,56 2,69 2,65 2,98 1,98 1,98 2,87 2,69 2,65 2,97
101
LAMPIRAN B
HASIL UJI KEKERASAN TABLET KO-PROSES
REPLIKASI I
No Kekerasan Tablet Ko-proses (Kp)
F1 F2 F3 F4 F5 F6 F7 F8
1 2,3 3,9 1,4 2,9 2,5 3,2 2,3 3,2 2 2,6 2,9 5,3 3,3 2,2 3,3 2,1 3,4 3 2,2 4,1 3 2,7 2,2 3,7 1,9 3,6 4 4 1,4 5,7 3,6 2,2 3,4 1,8 3,6
5 1,8 3,6 4 4 2 3,8 2,2 3,5
6 2,9 4,8 4,7 2,8 4 4,2 2,1 3,8 7 3,7 3,8 2,9 3,2 4,5 4,2 2,5 3,7 8 2,3 5,4 4,6 3,1 5 4,1 2,8 3,9 9 2,9 6,5 3,6 4 2,4 4,2 2,6 3,6 10 3,1 1,6 4,4 2,6 3,5 5,3 3,1 5
REPLIKASI II
No Kekerasan Tablet Ko-proses (Kp)
F1 F2 F3 F4 F5 F6 F7 F8
1 3 3,5 1,8 2,3 2,2 5,2 1,7 2,7 2 3,3 5 1,7 1,9 3,4 3,3 1,6 2,6 3 3,5 4,3 1,6 2,4 2 2,5 1,9 2,4 4 3,6 3,3 3,1 2,4 2,8 1,7 1,6 1,7 5 3,3 3,7 3 1,7 3,3 2,8 3,3 4,2 6 3,3 3,9 2,2 2,2 3,3 4,6 3 3,3 7 4,4 5 3,2 2,5 4,1 4,6 3,1 3,6 8 3,3 4,2 2,8 1,8 1,7 4,2 2,8 3,7 9 1,9 1,1 2,2 1,6 2 1,5 2,9 5 10 3,2 1,3 2,7 2,7 3,9 1,9 1,9 3,6
Rata-rata 3,28 3,53 2,43 2,15 2,87 3,23 2,38 3,28 ± SD 0,61 1,35 0,60 0,37 0,85 1,34 0,69 0,95
KV 18,72 38,3 1 24,9 2 17,4 3 29,7 4 41,7 9 29,1 6 29,2 0
REPLIKASI III
No Kekerasan Tablet Ko-proses (Kp)
F1 F2 F3 F4 F5 F6 F7 F8
1 2,3 3,6 3,6 2,5 2,8 3,1 1,9 2,5 2 3 2,2 2,2 2,5 3,5 2,5 2,1 2,1 3 3,2 2,7 2,7 2,1 2 3 1,7 3,9 4 3,5 2,4 2,4 3,3 3,3 3,2 2,3 2,8 5 3,7 2,9 2,9 1,8 2,9 2,3 2,2 3,1 6 3,6 3,3 3,3 2,9 3,2 3,1 2,1 2,8 7 3,3 1,6 1,6 2,5 4,1 2,2 2,7 3,1 8 2,4 5,9 5,9 3,1 4,2 2,9 2,4 3,4 9 3,9 1,9 1,9 2,5 3,1 2,8 2,1 3,3 10 3,6 2,2 2,2 3,3 2,5 4 2 3,4
Rata-rata 3,25 2,87 2,87 2,65 3,16 2,91 2,15 3,04 ± SD 0,54 1,2 1,22 0,49 0,67 0,51 0,27 0,51
103
LAMPIRAN C
HASIL UJI KERAPUHAN TABLET KO-PROSES
LAMPIRAN D
HASIL UJI WAKTU HANCUR TABLET KO-PROSES
REPLIKASI I
No
Waktu Hancur Tablet Ko-proses (detik)
F1
F2
F3
F4
F5
F6
F7
F8
1 102 168 70 150 37 140 109 124 2 72 92 49 143 38 122 128 171 3 97 95 65 116 40 128 112 102 4 100 80 63 103 41 155 77 133 5 90 130 67 100 40 131 72 152Rata-rata 92,2 113 62,8 122,
4 39,2 135,
2 99,6 136,
4 ± SD 12,1 35,9 8,1 22,9 1,64 12,8 24,1 26,4
KV 13,1 31,7 12,9 10,1 4,18 9,46 24,1 9
19,3 5
REPLIKASI II
No Waktu Hancur Tablet Ko-proses (detik)
F1 F2 F3 F4 F5 F6 F7 F8
1 40 136 98 50 106 145 65 118 2 61 119 87 55 134 152 47 152 3 58 86 68 49 108 135 39 102 4 70 135 58 56 114 122 48 126 5 45 108 65 45 130 172 52 133
Rata-rata 54,8 116,8 75,2 51 118,4 145,2 50,2 126,2 ± SD 12,1 20,8 16,6 4,5 12,8 18,7 9,5 18,4
105
REPLIKASI III
No Waktu Hancur Tablet Ko-proses (detik)
F1 F2 F3 F4 F5 F6 F7 F8
1 170 80 43 74 66 157 72 163 2 178 61 57 80 80 135 88 128 3 140 75 34 66 63 160 97 146 4 160 65 44 89 92 116 62 171 5 141 78 41 75 75 150 74 152
LAMPIRAN E
HASIL UJI WAKTU PEMBASAHAN TABLET KO-PROSES
REPLIKASI I
No Waktu Pembasahan Tablet Ko-proses (detik)
F1 F2 F3 F4 F5 F6 F7 F8
1 28 59 45 82 31 145 46 95 2 117 74 41 55 37 178 62 97 3 119 61 25 62 57 174 52 122 4 42 85 58 45 57 162 32 65 5 33 66 35 62 37 177 61 90
Rata-rata 67,8 69 40,8 61,6 43,8 167,2 50,6 93,8 ± SD 46,1 10,6 12,2 12,9 12,2 13,9 12,3 20,3 KV 67,9 15,3 29,9 20,9 27,8 8,31 24,3 21,6
REPLIKASI II
No
Waktu Pembasahan Tablet Ko-proses (detik)
F1
F2
F3
F4
F5
F6
F7
F8
1
46
114
60
33
75
133
56
127
2
51
145
48
58
78
125
42
82
3
42
133
51
71
76
120
51
62
4
89
141
46
54
42
143
50
173
5
114
146
50
64
42
122
3
94
Rata-rata 68,4 141,2 51 56 62,6 128,6 40,4 107,6 ± SD 31,6 5,1 5,3 14,73 18,3 9,4 21,5 43,5
107
REPLIKASI III
No Waktu Pembasahan Tablet Ko-proses (detik)
F1 F2 F3 F4 F5 F6 F7 F8
1 38 99 35 47 33 154 51 85 2 36 54 47 39 44 153 42 61 3 42 70 40 59 40 128 63 82 4 50 38 30 93 47 135 40 118 5 39 28 43 40 20 127 56 105
LAMPIRAN F
HASIL UJI RASIO ABSORPSI AIR TABLET KO-PROSES
REPLIKASI I
Formula Wb (g)
Wa (g)
Rasio Rata-rata ±
109
REPLIKASI II
Formula Wb (mg)
Wa (mg)
Rasio Rata-rata
± SD
REPLIKASI III
Formula Wb (mg)
Wa (mg)
Rasio Rata-rata
± SD
111
LAMPIRAN G
HASIL UJI MUTU FISIK GRANUL KO-PROSES OPTIMUM
Formula Optimum
Kelembapan (%)
Persyaratan (%)
Carr’s Index (%)
Persyaratan (%)
Hausner Ratio
Persyaratan
Batch 1 Batch 2 Batch 3 Rata-rata
± SD
2,89 2,78 2,65 2,77 0,12
2 – 5% (Ansel, 1989)
19,81 19,01 20,2 19,67
0,61
16-20 = cukup (Hadisoewignyo
dan Fudholi, 2013)
1,24 1,23 1,25 1,24 0,01
< 1,25 (Mathpati et
LAMPIRAN H
HASIL UJI KEKERASAN TABLET KO-PROSES OPTIMUM
No
Kekerasan Tablet Ko-proses Optimum (Kp) Batch 1 Batch 2 Batch 3
1 3,5 3,3 3,3
2 3,7 3,5 3,6
3 3,3 3,3 3,4
4 3,4 3,5 3,5
5 2,8 3,4 3,7
6 3,3 3,1 3,7
7 3,2 3,4 3,3
8 3,2 3,6 3,7
9 3,4 3,3 3,3
10 3,2 3,3 3,6
113
LAMPIRAN I
HASIL UJI KERAPUHAN TABLET KO-PROSES OPTIMUM
Formula Replikasi Berat awal (gram)
Berat akhir (gram)
Kerapuhan (%)
Rata-rata ± SD
KV
Batch 1 I 1,933 1,930 0,135
0,164 ± 0,03
22,57 Batch 2 I 1,985 1,982 0,151
LAMPIRAN J
HASIL UJI WAKTU HANCUR TABLET KO-PROSES OPTIMUM
No Waktu Hancur Tablet Ko-proses Optimum (detik) Batch 1 Batch 2 Batch 3
1 98 100 99
2 101 99 103
3 98 101 96
4 99 98 99
5 97 100 98
Rata-rata 98,60 99,60 99,00
± SD 1,52 1,14 2,55
115
LAMPIRAN K
HASIL UJI WAKTU PEMBASAHAN TABLET KO-PROSES
OPTIMUM
No Waktu Pembasahan Tablet Ko-proses Optimum (detik)
Batch 1 Batch 2 Batch 3
1 91 102 94
2 90 96 91
3 97 86 87
4 89 95 98
5 95 100 102
Rata-rata 92,4 95,8 94,4
± SD 3,07 5,53 5,24
LAMPIRAN L
HASIL UJI RASIO ABSORPSI AIR TABLET KO-PROSES
OPTIMUM
Formula Optimum Wb (mg) Wa (mg)Rasio Rata-rata
± SD
117
LAMPIRAN M
HASIL UJI MUTU FISIK GRANUL ODT DOMPERIDONE
Formula ODT Domperidone
Kelembapan (%)
Persyaratan (%)
Carr’s Index (%)
Persyaratan (%)
Hausner Ratio
Persyaratan
Batch 1 Batch 2 Batch 3 Rata-rata
± SD
2,89 2,78 2,65 2,77 0,12
2 – 5% (Ansel, 1989)
19,94 16,06 17,19 17,73 1,99
16-20 = cukup (Hadisoewignyo
dan Fudholi, 2013)
1,24 1,19 1,21 1,21 0,03
< 1,25 (Mathpati et
LAMPIRAN N
HASIL UJI KESERAGAMAN KANDUNGAN TABLET ODT DOMPERIDONE
Formula ODT
Domperidone Absorbansi
Bobot Tablet Kons, Sampel Kadar Bahan Aktif (mg)
Kadar
(mg) (µg/ml) (%)
119
Batch 2 0,238 0,240 0,238 0,241 0,236 0,239 0,226 0,229 0,225 0,237 100 99 98 99 109 107 108 108 109 101 7,576074 7,645761 7,56446 7,66899 7,494774 7,599303 7,146341 7,250871 7,111498 7,529617 9,470093 9,557201 9,455575 9,586237 9,368467 9,499129 8,932927 9,063589 8,889373 9,412021 94,70093 95,57201 94,55575 95,86237 93,68467 94,99129 89,32927 90,63589 88,89373 94,12021 X SD KV 93,23461 2,607364 2,796562 Batch 3LAMPIRAN O
HASIL UJI KEKERASAN TABLET ODT DOMPERIDONE
No Kekerasan Tablet ODT Domperidone (Kp) Batch 1 Batch 2 Batch 3
1 3,5 3,3 3,4
2 3,3 3,1 3,3
3 3,1 3,3 3,1
4 3,3 3,4 3,4
5 3,5 3,5 3,3
6 3,6 3,2 3,5
7 2,8 3,3 3,3
8 3,1 3,1 3,1
9 3 3,3 3,3
10 3,5 3,3 3,4
Rata-rata 0,26 0,12 0,13 ± SD 3,27 3,28 3,31
121
LAMPIRAN P
HASIL UJI KERAPUHAN TABLET ODT DOMPERIDONE
Formula ODT Domperidone
Replikasi Berat awal (gram)
Berat akhir (gram)
Kerapuhan (%)
Rata-rata ±
SD KV
Batch 1 I 2,174 2,170 0,170
0,19 ±
0,07 36,82 Batch 2 I 2,078 2,073 0,265
LAMPIRAN Q
HASIL UJI WAKTU HANCUR TABLET ODT DOMPERIDONE
No Waktu Hancur Tablet ODT Domperidone (detik) Batch 1 Batch 2 Batch 3
1 182 192 197
2 175 184 189
3 195 196 194
4 169 188 199
5 195 194 182
Rata-rata 183,20 190,80 192,20 ± SD 11,71 4,82 6,83
123
LAMPIRAN R
HASIL UJI WAKTU PEMBASAHAN TABLET ODT
DOMPERIDONE
No Waktu Pembasahan Tablet ODT Domperidone (detik)
Batch 1 Batch 2 Batch 3
1 192 216 224
2 204 201 205
3 187 197 199
4 196 185 189
5 205 191 194
Rata-rata 196,80 198,00 202,20 ± SD 7,73 11,75 13,55
LAMPIRAN S
HASIL UJI RASIO ABSORPSI AIR TABLET ODT DOMPERIDONE
Formula ODT Domperidone Wb (g) Wa (g)
Rasio Rata-rata ±
125
LAMPIRAN T
HASIL UJI PENETAPAN KADAR TABLET ODT DOMPERIDONE
Formula Rep, W sampel
(mg)
Abs, C sampel (µg/ml) W Bahan Aktif (mg) W tablet rata-rata (mg) W Bahan Aktif (mg) Kadar (%) Rata-rata ± SD KV (%) Batch 1 I II III 100,6 100,1 100,3 0,241 0,231 0,244 7,67 7,32 7,77 9,59 9,15 9,72 97,25 99,46 98,18 9,29 9,09 9,51 92,9 90,9 95,1 92,97 ± 2,10 2,26 Batch 2 I II II 100,3 100,2 100,4 0,248 0,237 0,238 7,92 7,53 7,56 9,9 9,41 9,45 94,85 96,95 98,26 9,36 9,10 9,25 93,6 91,0 92,5 92,37 ± 1,31 1,42 Batch 3 I II III 100,4 100,1 100,5 0,241 0,232 0,238 7,67 7,36 7,57 9,58 9,2 9,46 96,94 100,39 97,71 9,25 9,22 9,19 92,5 92,2 91,9 92,20 ± 0,30 0,33 Pembanding 1 1 2 3 100,2 100,8 100,5 0,231 0,234 0,229 7,32 7,42 7,25 9,15 9,28 9,06 109,0 108,3 109,3 9,95 9,97 9,85 99,5 99,7 98,5 99,23 ± 0,64 0,64 Pembanding 2 1 2 3 100,6 100,8 100,2 0,236 0,235 0,238 7,49 7,46 7,56 9,37 9,33 9,46 104,0 107,3 106,3 9,69 9,93 10,04 96,9 99,3 100,4 98,87 ± 1,79 1,81
Keterangan: Pembanding 1 = tablet generik domperidone
LAMPIRAN U
HASIL UJI DISOLUSI ODT DOMPERIDONE
Hasil Uji Disolusi Batch 1
Rep, t
(menit)
Abs C
(µg/ml) (mg) Wt
% obat terlepas AUC (µg menit / ml)
127
129
Hasil Uji Disolusi Batch 2
Rep, t
(menit) Abs
C
(µg/ml) (mg) Wt % obat terlepas
AUC (µg menit / ml)
I 1 2 4 6 8 10 15 20 25 30 0,179 0,188 0,229 0,268 0,285 0,289 0,296 0,283 0,283 0,28 5,51 5,82 7,25 8,61 9,20 9,34 9,59 9,13 9,13 9,03 4,96 5,24 6,53 7,75 8,28 8,41 8,63 8,22 8,22 8,13 52,43 53,35 66.44 78.89 84.32 85.60 87.83 83.68 83.68 82,72 2,48 5,10 11,77 14,27 16,03 16,69 42,59 42,11 41,10 40,86 ∑ AUC % ED 232,99 73,44 II 1 2 4 6 8 10 15 20 25 30 0,196 0,212 0,249 0,267 0,275 0,281 0,285 0,288 0,281 0,285 6,10 6,66 7,95 8,57 8,85 9,06 9,20 9,31 9,06 9,20 5,49 5,99 7,15 7,72 7,97 8,16 8,28 8,38 8,16 8,28 58,07 61,01 72,83 78,57 81,13 83,04 84,32 85,28 83,04 84,32 2,75 5,74 13,15 14,87 15,69 16,12 41,10 41,64 41,33 41,10
131
Hasil Uji Disolusi Batch 3
Rep, t
(menit) Abs
C
(µg/ml) (mg) Wt % obat terlepas
AUC (µg menit / ml)
Hasil Uji Disolusi Tablet Pembanding 1 (Obat Generik)
Rep, t
(menit) Abs
C
(µg/ml) (mg) Wt % obat terlepas
AUC (µg menit / ml)
I
1 0,058 1,29 1,17 11,79 0,58
2 0,139 4,12 3,71 37,40 0,24
4 0,202 6,31 5,68 57,26 9,39
6 0,201 6,28 5,65 56,96 11,33
8 0,226 7,15 6,43 64,82 12,08
10 0,294 9,52 8,57 86,39 15,00
15 0,238 7,57 6,81 68,65 38,45
20 0,246 7,85 7,06 71,17 34,68
25 0,246 7,85 7,06 71,17 35,31
30 0,248 7,92 7,12 71,77 35,47
∑ AUC
% ED
194,72 65,43
II
1 0,053 1,12 1,01 10,18 0,50
2 0,119 3,42 3,08 31,05 2,04
4 0,184 5,69 5,12 51,61 8,20
6 0,228 7,22 6,50 65,52 11,61
8 0,214 6,73 6,06 61,09 12,56
10 0,265 8,51 7,66 77,22 13,72
15 0,228 7,22 6,50 65,52 35,39
20 0,251 8,02 7,22 72,78 34,29
25 0,250 7,99 7,19 72,48 36,01
30 0,258 8,26 7,44 75,0 36,56
135
% ED
64,14
III
1 0,057 1,26 1,13 11,39 0,57
2 0,125 3,63 3,27 32,96 2,20
4 0,209 6,56 5,90 59,48 9,17
6 0,221 6,98 6,28 63,31 12,18
8 0,224 7,08 6,37 64,21 12,65
10 0,219 6,91 6,21 62,60 12,59
15 0,248 7,92 7,12 71,77 33,35
20 0,259 8,30 7,47 75,30 36,48
25 0,251 8,02 7,22 72,78 36,72
30 0,244 7,78 7,00 70,56 35,54
∑ AUC
% ED
Hasil Uji Disolusi Tablet Pembanding 2 (Obat dengan Nama Dagang)
Rep, t
(menit) Abs
C
(µg/ml) (mg) Wt % obat terlepas
AUC (µg menit / ml)
I
1 0,079 2,03 1,82 18,40 0,91
2 0,124 3,59 3,24 32,76 2,53
4 0,168 5,13 4,62 46,71 7,85
6 0,228 7,22 6,50 65,72 11,11
8 0,205 6,42 5,78 58,44 12,27
10 0,206 6,45 5,81 58,75 11,58
15 0,230 7,29 6,56 66,33 30,92
20 0,230 7,29 6,56 66,33 32,80
25 0,232 7,36 6,62 66,94 32,96
30 0,244 7,78 7,00 70,78 34,05
∑ AUC
% ED
176,99 59,11
II
1 0,077 1,96 1,76 17,80 0,88
2 0,144 4,29 3,86 39,03 2,81
4 0,171 5,23 4,71 47,62 8,57
6 0,198 6,17 5,56 56,22 10,27
8 0,217 6,84 6,15 62,18 11,71
10 0,226 7,15 6,43 65,02 12,59
15 0,232 7,36 6,62 66,94 32,64
20 0,241 7,67 6,90 69,77 33,82
25 0,225 7,11 6,40 64,71 33,27
30 0,237 7,53 6,78 68,55 32,96
137
% ED
60,50
III
1 0,076 1,92 1,73 17,49 0,86
2 0,121 3,49 3,14 31,75 2,44
4 0,188 5,83 5,24 52,98 8,38
6 0,210 6,59 5,93 59,96 11,18
8 0,216 6,80 6,12 61,88 12,05
10 0,219 6,91 6,21 62,79 12,34
15 0,226 7,15 6,43 65,01 31,62
20 0,238 7,57 6,81 68,86 33,11
25 0,231 7,32 6,59 66,63 33,51
30 0,242 7,71 6,94 70,17 33,82
∑ AUC
% ED
LAMPIRAN V
HASIL UJI STABILITAS TABLET KO-PROSES OPTIMUM
Hasil Uji Stabilitas Kekerasan Tablet Ko-proes Optimum
No Kekerasan Tablet Ko-proses Optimum (Kp) Batch 1 Batch 2 Batch 3
1 3,6 3,3 3,5
2 3,1 3,3 3,3
3 3,2 3,3 3,1
4 3,2 3,5 3,2
5 2,9 3,4 3,5
6 3,3 3,2 3,5
7 3,6 3,4 2,9
8 3,2 3,2 3,2
9 3,4 3 3,3
10 3,5 3,3 3,6
Rata-rata 0,23 0,14 0,22 ± SD 3,30 3,29 3,31
KV 6,85 4,17 6,60
Hasil Uji Stabilitas Kerapuhan Tablet Ko-proses Optimum
Formula Optimum
Replikasi Berat awal (gram)
Berat akhir (gram)
Kerapuhan (%)
Rata-rata ± SD
KV
Batch 1
I 1,982 1,980 0,081
0,08 ±
0,01 15,13 Batch 2 I 1,971 1,970 0,071
139
Hasil Uji Stabilitas Waktu Hancur Tablet Ko-proses Optimum
No Waktu Hancur Tablet Ko-proses Optimum (detik)
Batch 1 Batch 2 Batch 3
1 101 98 100
2 99 101 101
3 95 101 99
4 100 97 99
5 98 99 98
Rata-rata 98,6 99,2 99,4
± SD 2,30 1,79 1,14
Hasil Uji Stabilitas Waktu Pembasahan Tablet Ko-proses Optimum
Hasil Uji Stabilitas Rasio Absorpsi Air Tablet Ko-proses Optimum
Formula Optimum Wb (mg) Wa (mg)
Rasio Rata-rata
± SD
KV Batch 1 0,0953 0,0971 0,0924 0,0985 0,0981 0,1341 0,1419 0,1315 0,1393 0,1395 28,93 31,57 29,73 29,29 29,68 29,84 ± 1,02 3,42 Batch 2 0,0963 0,0991 0,0912 0,0937 0,0919 0,1345 0,1418 0,1289 0,1352 0,1279 28,40 30,11 29,25 30,70 28,15 29,32 ± 1,09 3,71 Batch 3 0,0982 0,0976 0,0977 0,0919 0,0959 0,1411 0,1376 0,1381 0,1336 0,1364 30,40 29,07 29,25 31,21 29,69 29,93 ± 0,88 2,95 No
Waktu Pembasahan Tablet Ko-proses Optimum (detik)
Batch 1 Batch 2
Batch 3
1 93 91 91
2 91 94 93
3 99 89 92
4 91 102 89
5 93 93 94
Rata-rata 93,40 93,80 91,80 ± SD 2,94 4,45 1,72
141
LAMPIRAN W
HASIL UJI STABILITAS TABLET ODT DOMPERIDONE
Hasil Uji Stabilitas Kekerasan Tablet ODT Domperidone
No Kekerasan Tablet ODT DOmperidone (Kp) Batch 1 Batch 2 Batch 3
1 3,3 3 3,5
2 3,6 3,7 3,5
3 3,1 2,9 3,4
4 3,5 3,6 3,1
5 3,2 3,4 3,3
6 3,3 3,3 3,6
7 3,1 3,1 2,9
8 2,9 3,1 2,9
9 3 3,3 3,4
10 3,4 3,3 3,3
Rata-rata 0,22 0,25 0,25 ± SD 3,24 3,27 3,29
KV 6,86 7,77 7,51
Hasil Uji Stabilitas Kerapuhan Tablet ODT Domperidone
Formula
ODT
Domperidone
Replikasi
Berat
awal
(gram)
Berat
akhir
(gram)
Kerapuhan
(%)
Rata-rata
± SD
KV
Batch 1
I
2,186
2,180
0,274
0,18
±
0,10
56,85
Batch 2
I
2,069
2,068
0,072
Batch 3
Hasil Uji Stabilitas Waktu Hancur Tablet ODT Domperidone
No Waktu Hancur Tablet ODT Domperidone (detik) Batch 1 Batch 2 Batch 3
1 194 183 199
2 187 194 205
3 188 184 198
4 195 197 206
5 199 199 199
Rata-rata 192,6 191,4 201,4
±SD 5,03 7,44 3,78
143
Hasil Uji Stabilitas Waktu Pembasahan Tablet ODT Domperidone
No
Waktu Pembasahan Tablet ODT Domperidone (detik)
Batch 1 Batch 2 Batch 3
1 205 228 241
2 199 198 195
3 196 193 207
4 192 204 199
5 201 185 209
Rata-rata 198,60 201,60 210,20 ± SD 4,93 16,32 18,14
KV 2,48 8,09 8,63
Hasil Uji Stabilitas Rasio Absorpsi Air Tablet ODT Domperidone
Formula ODT Domperidone Wb (mg) Wa (mg)
Rasio Rata-rata
± SD
LAMPIRAN X
CONTOH PERHITUNGAN
Contoh perhitungan Indeks kompresibilitas :
Formula optimum ko-proses 1 replikasi 1
Berat gelas ukur : 127,23 g (W
1)
Berat gelas ukur + isi : 162,44 g (W
2)
Berat granul dalam gelas ukur : 35,21 g
V sebelum tapped (V
1) = 100ml, V sesudah tapped (V
2) = 82 ml
Bobot jenis nyata =
)
(
1
1
2
ml
V
W
W
=
100
21
,
35
= 0,3521
Bobot jenis mampat =
)
(
2
1
2
ml
V
W
W
=
82
21
,
35
= 0,4293
% kompresibilitas =
mampat
jenis
bobot
nyata
jenis
bobot
1
x 100% =
4293
,
0
3521
,
0
1
x
100% = 17,98%
bulk tap
HR
=
3521
,
0
4293
,
0
= 1,21
Contoh hasil perhitungan akurasi presisi:
Replikasi I
Kons, Massa (mg) Abs (µg/ml)Kons Teoritis (µg/ml) Perolehan kembali (%)
145
Absorbansi = 0,249
y = 0,0208 + 0,028x
Konsentrasi sample (x) = 7,95
Berat domperidone = 100,4 mg
W matrix = 903,2 mg
W sample = 100,4 mg
Konsentrasi teoritis:
10,04 (dalam 250ml HCl0,1N) = (40,17 ppm x 2 (dipipet) ) / 10(ad) = 8,035
ppm
% perolehan kembali
= (konsentrasi sample / konsentrasi teoritis) x
100%
Contoh perhitungan penetapan kadar :
Batch 1 replikasi 1
Formula Rep, W sampel
(mg)
Abs, Csampel (µg/ml) W Bahan
Aktif (mg)
W tablet
rata-rata (mg)
W Bahan
Aktif (mg)
Kadar (%)
Batch 1 I 100,6 0,234 7,42 9,28 105,5 9,73 97,33
Absorbansi = 0,241
y = 0,0209 + 0,0287x
Konsentrasi sampel (x) = 7,42 ppm
Konsentrasi pengamatan = 7,42 ppm x 5(FP) x (250 ml/1000) = 9,28 mg
Berat tablet rata-rata = 105,5 mg
Berat sampel = 100,6 mg
Berat Domperidone = 105,5/100,6 x 9,28 mg = 9,73 mg
% Perolehan kembali = ( 9,73 mg / 10 mg) x 100% = 97,33 %
KV= (SD / X
rata-rata) x 100% = (1,49 / 98,22) x 100% = 1,522 %
Contoh perhitungan % obat terlepas:
Batch 1 replikasi 1 t = 30menit
Absorbansi = 0,249
y= 0,0208 + 0,028x
C
sampel= 7,95 ppm
W pada PK = 9,3 mg
Wt = 7,95 ppm x 0,9 L = 7,16 mg
147
Contoh perhitungan AUC pada menit 30
tn-1 = 25
tn = 30
W
tn= 7,16 mg
W
tn-1= 7,60 mg
AUC = ((7,16 + 7,60 )/ 2 ) x ( 30 – 25) = 36,9 µg menit/ml
LAMPIRAN Y
SERTIFIKAT BAHAN
153
LAMPIRAN AA
155
LAMPIRAN AC
HASIL UJI STATISTIK
CARR’S INDEX
GRANUL KO-PROSES
ANTAR FORMULA
(
One Way Anova
)
ANOVA
Carrs index
Sum of Squares df Mean Square F Sig, Between Groups 57,130 7 8,161 4,591 ,006
Within Groups 28,440 16 1,778 Total 85,570 23
Keterangan :
F
hitung(4,591) > F
tabel (0,05) (7,16)(2,66), maka H
0ditolak dan ada perbedaan
carrsindex
Tukey HSDa
formula N Subset for alpha = 0.05
1 2
f6 3 20,0333 f2 3 20,2333
f5 3 20,2667 20,2667 f8 3 20,6667 20,6667 f3 3 22,3000 22,3000 f7 3 23,3000 23,3000 f1 3 23,3333 23,3333
f4 3 24,0333
Sig, ,109 ,050
157
LAMPIRAN AD
HASIL UJI STATISTIK
HAUSNER RATIO
GRANUL KO-PROSES
ANTAR FORMULA
(
One Way Anova
)
ANOVA
Hausner ratio
Sum of
Squares
df
Mean Square
F
Sig,
Between
Groups
,014
7
,002
3,595
,016
Within Groups
,009
16
,001
Total
,023
23
Keterangan :
F
hitung(3,595) > F
tabel (0,05) (7,16)(2,66), maka H
0ditolak dan ada perbedaan
bermakna antar formula, Rata-rata
Hausner ratio
granul ko-proses dari
kedelapan formula menunjukkan ada perbedaan yang signifikan antar
formula,
Tukey HSD
aformula
N
Subset for alpha
= 0.05
1
f6
3
1.2467
f2
3
1.2533
f5
3
1.2533
f8
3
1.2567
f3
3
1.2867
f1
3
1.3000
f7
3
1.3000
f4
3
1.3100
Sig.
.070
159
LAMPIRAN AE
HASIL UJI STATISTIK KEKERASAN TABLET KO-PROSES
ANTAR FORMULA
(
One Way Anova
)
ANOVA
Kekerasan
Sum of
Squares
df
Mean Square
F
Sig,
Between
Groups
3,227
7
,461
1,762
,165
Within Groups
4,185
16
,262
Total
7,412
23
Keterangan :
F
hitung(1,762) > F
tabel (0,05) (7,16)(2,66), maka H
0ditolak dan ada perbedaan
Tukey HSD
aformula
N
Subset for alpha =
0.05
1
F7
3
2.2900
F4
3
2.6733
F3
3
2.7967
F5
3
3.0267
F1
3
3.1033
F8
3
3.3500
F6
3
3.3600
F2
3
3.4000
Sig.
.205
Keterangan :
161
LAMPIRAN AF
HASIL UJI STATISTIK KERAPUHAN TABLET KO-PROSES
ANTAR FORMULA
(
One Way Anova
)
ANOVA
Kerapuhan
Sum of
Squares
df
Mean Square
F
Sig,
Between
Groups
,297
7
,042
,485
,831
Within Groups
1,401
16
,088
Total
1,698
23
Keterangan :
F
hitung(0,485) > F
tabel (0,05) (7,16)(2,66), maka H
0ditolak dan ada perbedaan
formula
N
Subset for alpha
= 0.05
1
F3
3
.21833
F6
3
.30900
F8
3
.31733
F2
3
.36733
F5
3
.41600
F4
3
.45233
F1
3
.49033
F7
3
.59733
Sig.
.761
Keterangan :
Hasil uji HSD Tukey dari kedelapan formula, diperoleh nilai sig,< α (0,05)
sehingga H
0ditolak, berarti rata-rata kerapuhan tablet ko-proses dari
163
LAMPIRAN AG
HASIL UJI STATISTIK WAKTU HANCUR TABLET KO-PROSES
ANTAR FORMULA
(
One Way Anova
)
ANOVA
Waktu hancur
Sum of
Squares
df
Mean
Square
F
Sig,
Between
Groups
18050,345
7
2578,621
2,832
,040
Within Groups 14566,880
16
910,430
Total
32617,225
23
Keterangan :
F
hitung(2,832) > F
tabel(0,05) (7,16)(2,66) maka H
0ditolak dan ada perbedaan
formula
N
Subset for alpha =
0.05
1
F3
3
60.60000
F7
3
76.13333
F5
3
77.60000
F4
3
83.40000
F2
3
100.53333
F1
3
101.60000
F8
3
138.20000
F6
3
141.33333
Sig.
.070
Keterangan :
165
LAMPIRAN AH
HASIL UJI STATISTIK WAKTU PEMBASAHAN TABLET
KO-PROSES
ANTAR FORMULA
(
One Way Anova
)
ANOVA
Waktu pembasahan
Sum of
Squares
df
Mean
Square
F
Sig,
Between
Groups
24302,882
7
3471,840
5,096
,003
Within Groups 10901,450
16
681,341
Total
35204,331
23
Keterangan :
F
hitung(5,096) > F
tabel (0,05) (7,16)(2,66) maka H
0ditolak dan ada perbedaan
Tukey HSD
aformula
N
Subset for alpha = 0.05
1
2
F7
3
47.1333
F5
3
47.7333
F4
3
54.4000
F1
3
59.0667
F2
3
89.3333
89.3333
F3
3
96.4633
96.4633
F8
3
97.2000
97.2000
F6
3
145.0667
Sig.
.327
.220
Keterangan :
167
LAMPIRAN AI
HASIL UJI STATISTIK RASIO ABSORPSI AIR TABLET
KO-PROSES
ANTAR FORMULA
(
One Way Anova
)
ANOVA
Ratio aborbsi
Sum of
Squares
df
Mean Square
F
Sig,
Between
Groups
1117,597
7
159,657
3,500
,018
Within Groups
729,815
16
45,613
Total
1847,412
23
Keterangan :
F
hitung(3,500) > F
tabel(0,05) (7,16)(2,66) maka H
0ditolak dan ada perbedaan
Tukey HSD
aformula
N
Subset for alpha = 0.05
1
2
F6
3
22.5333
F2
3
29.2567
29.2567
F1
3
34.8100
34.8100
F4
3
35.6100
35.6100
F8
3
37.4167
37.4167
F5
3
38.5467
38.5467
F3
3
43.2200
F7
3
45.1533
Sig.
.137
.142
Keterangan :
169
LAMPIRAN AJ
HASIL UJI STATISTIK
CARR’S INDEX
GRANUL KO-PROSES
FORMULA OPTIMUM
(
One-Sample T Test
)
One-Sample Statistics
N
Mean
Std, Deviation Std, Error Mean
Carrs index
3
19,6733
,60666
,35025
One-Sample Test
Test Value = 17,77
t df
Sig, (2-tailed)
Mean Difference
95% Confidence Interval of the Difference
Lower Upper
Carrs index -,933 2 ,449 -,32667 -1,8337 1,1804
Keterangan: T
hitung(-0,933)
< T
tabel (0,05) (2)(4,303), menunjukkan bahwa nilai
LAMPIRAN AK
HASIL UJI STATISTIK
HAUSNER RATIO
GRANUL KO-PROSES
FORMULA OPTIMUM
(
One-Sample T Test
)
One-Sample Statistics
N
Mean
Std, Deviation
Std, Error Mean
Hausner ratio
3
1,2400
,01000
,00577
Keterangan: T
hitung(0,000)
< T
tabel (0,05) (2)(4,303), menunjukkan nilai
Hausner ratio
granul ko-proses optimum tidak memiliki perbedaan yang
bermakna terhadap hasil teoritis,
One-Sample Test
Test Value = 1,21
t
Df
Sig,
(2-tailed)
Mean
Difference
95% Confidence
Interval of the
Difference
Lower
Upper
Hausner
ratio
171
LAMPIRAN AL
HASIL UJI STATISTIK KEKERASAN TABLET KO-PROSES
FORMULA OPTIMUM
(One-Sample T test)
One-Sample Statistics
N
Mean
Std, Deviation Std, Error Mean
Kekerasan
3
3,3933
,10693
,06173
One-Sample Test
Test Value = 2,42
t
Df
Sig,
(2-tailed)
Mean
Difference
95% Confidence Interval
of the Difference
Lower
Upper
Kekerasan
,054
2
,962
,00333
-,2623
,2690
Keterangan: T
hitung(0,054)
< T
tabel (0,05) (2)(4,303), yang menunjukkan
LAMPIRAN AM
HASIL UJI STATISTIK KERAPUHAN TABLET KO-PROSES
FORMULA OPTIMUM
(One-Sample T test)
One-Sample Statistics
N
Mean
Std, Deviation
Std, Error Mean
kerapuhan
4
,0925
,07455
,03728
One-Sample Test
Test Value = 0,6934
t
df
Sig,
(2-tailed)
Mean
Difference
95% Confidence
Interval of the
Difference
Lower
Upper
kerapuhan
-7,176
3
,006
-,26750
-,3861
-,1489
Keterangan: T
hitung(-7,176)
< T
tabel (0,05) (2)(4,303), yang menunjukkan
173
LAMPIRAN AN
HASIL UJI STATISTIK WAKTU HANCUR TABLET KO-PROSES
FORMULA OPTIMUM
(One-Sample T test)
One-Sample Statistics
N
Mean
Std, Deviation Std, Error Mean
Waktu hancur
3
99,0667
,50332
,29059
One-Sample Test
Test Value = 95,52
t
df
Sig,
(2-tailed)
Mean
Difference
95% Confidence Interval
of the Difference
Lower
Upper
Waktu
hancur
-7,204
2
,019
-2,09333
-3,3437
-,8430
Keterangan: T
hitung(-7,204)
< T
tabel (0,05) (2)(4,303), yang menunjukkan waktu
LAMPIRAN AO
HASIL UJI STATISTIK WAKTU PEMBASAHAN TABLET
KO-PROSES
FORMULA OPTIMUM
(One-Sample T test)
One-Sample Statistics
N
Mean
Std, Deviation Std, Error Mean
Waktu
pembasahan
3
94,2000
1,70880
,98658
One-Sample Test
Test Value = 369,81
t
df
Sig,
(2-tailed)
Mean
Difference
95% Confidence
Interval of the
Difference
Lower
Upper
Waktu
pembasahan
-,517
2
,657
-,51000
-4,7549
-,517
Keterangan: T
hitung(-0,517)
> T
tabel (0,05) (2)(4,303), yang menunjukkan waktu
175
LAMPIRAN AP
HASIL UJI STATISTIK RASIO ABSORPSI AIR TABLET
KO-PROSES
FORMULA OPTIMUM
(One-Sample T test)
One-Sample Statistics
N
Mean
Std, Deviation Std, Error Mean
Ratio absorpsi
3
29,9667
,43155
,24915
One-Sample Test
Test Value = 36,27
t
df
Sig,
(2-tailed)
Mean
Difference
95% Confidence Interval
of the Difference
Lower
Upper
Ratio absorpsi 1,030
2
,411
,25667
-,8154
1,3287
Keterangan: T
hitung(1,07)0
< T
tabel (0,05) (2)(4,303), yang menunjukkan rasio
LAMPIRAN AQ
HASIL UJI STATISTIK STABILITAS TABLET KO-PROSES
OPTIMUM
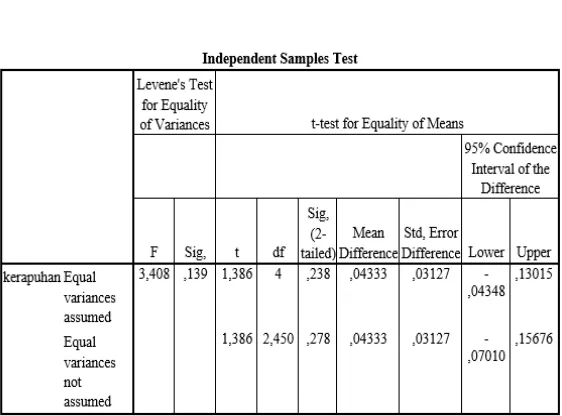
(Independent Samples test)
Hasil Uji Stabilitas Kekerasan Tablet Ko-proses
Keterangan: T
hitung(-0,989)
< T
tabel (0,05) (4)(2,776), yang menunjukkan
177
Hasil Uji Stabilitas Kerapuhan Tablet Ko-proses
Keterangan: T
hitung(1,386)
< T
tabel (0,05) (4)(2,776), menunjukkan kerapuhan
Hasil Uji Stabilitas Waktu Hancur Tablet Ko-proses
Keterangan: T
hitung(0,000)
< T
tabel (0,05) (4)(2,776), menunjukkan waktu
179
Hasil Uji Stabilitas Waktu Pembasahan Tablet Ko-proses
Keterangan: T
hitung(0,510)
< T
tabel (0,05) (4)(2,776), menunjukkan waktu
Hasil Uji Stabilitas Rasio Absorpsi Air Tablet Ko-proses
Keterangan: T
hitung(1,000)
< T
tabel (0,05) (4)(2,776), menunjukkan rasio
181
LAMPIRAN AR
HASIL UJI STATISTIK STABILITAS TABLET ODT
DOMPERIDONE
(Independent-Sample T test)
Hasil Stabilitas Uji Kekerasan Tablet ODT
Keterangan: T
hitung(1,061)
< T
tabel (0,05) (4)(2,776), menunjukkan kekerasan
Hasil Uji Stabilitas Kerapuhan Tablet ODT Domperidone
Keterangan: T
hitung(0,000)
< T
tabel (0,05) (4)(2,776), menunjukkan kerapuhan
183
Hasil Uji Stabilitas Waktu Hancur Tablet ODT Domperidone
Keterangan: T
hitung(1,519)
< T
tabel (0,05) (4)(2,776), menunjukkan waktu
Hasil Uji Stabilitas Waktu Pembasahan Tablet ODT Domperidone
Keterangan: T
hitung(1,162)
< T
tabel (0,05) (4)(2,776), menunjukkan waktu
185
Hasil Uji Stabilitas Rasio Absorpsi Air Tablet ODT Domperidone
Keterangan: T
hitung(0,192)
< T
tabel (0,05) (4)(2,776), menunjukkan rasio
LAMPIRAN AS
HASIL UJI STATISTIK PENETAPAN KADAR
ODT DOMPERIDONE DALAM PELARUT HCl 0,1 N
(
One Way Anova
)
Descriptives
Penetapan kadar
N Mean Std,
Deviation Std, Error
95% Confidence Interval for Mean
Minimum Maximum Lower
Bound
Upper Bound
Formula_ODT 3 96,8367 1,98681 1,14709 91,9011 101,7722 94,56 98,22 Pembanding_
1
3 99,2333 ,64291 ,37118 97,6363 100,8304 98,50 99,70
Pembanding_ 2
3 98,8667 1,78979 1,03333 94,4206 103,3127 96,90 100,40
Total 9 98,3122 1,77227 ,59076 96,9499 99,6745 94,56 100,40
Test of Homogeneity of Variances
Penetapan kadar
Levene Statistic
df1
df2
Sig,
2,276
2
6
,184
ANOVA
Penetapan kadar
Sum of Squares df Mean Square F Sig, Between Groups 9,999 2 5,000 1,983 ,218 Within Groups 15,128 6 2,521
187
Keterangan :
F
hitung(1,983) > F
tabel (0,05) (2,6)(5,14) maka hipotesa 0 ditolak dan hasil
penetapan kadar memiliki perbedaan bermakna antar formula ODT hasil
percobaan dengan tablet pembanding,
Multiple Comparisons
Penetapan kadar Dunnett t (2-sided)a
(I) Formula (J) Formula
Mean Difference
(I-J) Std, Error Sig,
95% Confidence Interval
Lower Bound
Upper Bound
Pembanding 1 Formula ODT
2,39667 1,29650 ,190 -1,3149 6,1082
Pembanding 2 Formula ODT
2,03000 1,29650 ,274 -1,6816 5,7416
a, Dunnett t-tests treat one group as a control, and compare all other groups against it,
*, The mean difference is significant at the 0,05 level,
Keterangan :
LAMPIRAN AT
HASIL UJI STATISTIK PERSEN OBAT TERLEPAS TABLET
ODT DOMPERIDONE PADA t = 30 MENIT
(One Way Anova)
Descriptives
%Obat terlepas
N Mean Std,
Deviation Std, Error
95% Confidence Interval for Mean
Minimum Maximum Lower
Bound
Upper Bound
Formula_ODT 3 81,7933 1,28103 ,73960 78,6111 84,9756 80,59 83,14
Pembanding_1 3 72,4433 2,29531 1,32520 66,7415 78,1452 70,56 75,00
Pembanding_2 3 69,8333 1,15249 ,66539 66,9704 72,6963 68,55 70,78
Total 9 74,6900 5,63196 1,87732 70,3609 79,0191 68,55 83,14
Test of Homogeneity of Variances
%Obat terlepas
Levene Statistic df1 df2 Sig,
189
ANOVA
%Obat terlepas
Sum of Squares df Mean Square F Sig,
Between Groups 237,276 2 118,638 43,206 ,000
Within Groups 16,475 6 2,746
Total 253,752 8
Keterangan :
F
hitung(43,206) > F
tabel (0,05) (2,6)(5,14) maka H
0ditolak dan menunjukkan
persen obat terlepas memiliki perbedaan yang bermakna antar formula ODT
hasil percobaan dengan tablet pembanding,
Multiple Comparisons
%Obat terlepas
Dunnett t (2-sided)
a(I) Formula
(J)
Formula
Mean
Difference
(I-J)
Std,
Error
Sig,
95% Confidence
Interval
Lower
Bound
Upper
Bound
Pembanding
1
Formula
ODT
11,96000
*1,35300 ,000
8,0867
15,8333
*Pembanding
2
Formula
ODT
2,61000
1,35300 ,171
-1,2633
6,4833
Multiple Comparisons
%Obat terlepas
Dunnett t (2-sided)
a(I) Formula
(J)
Formula
Mean
Difference
(I-J)
Std,
Error
Sig,
95% Confidence
Interval
Lower
Bound
Upper
Bound
Pembanding
1
Formula
ODT
11,96000
*1,35300 ,000
8,0867
15,8333
*Pembanding
2
Formula
ODT
2,61000
1,35300 ,171
-1,2633
6,4833
a, Dunnett t-tests treat one group as a control, and compare all other groups
against it,
*, The mean difference is significant at the 0,05 level,
Keterangan :
191
LAMPIRAN AU
HASIL UJI STATISTIK PERSEN EFISIENSI DISOLUSI
TABLET ODT DOMPERIDONE
(One Way Anova)
Descriptives
Efisiensi Disolusi
N Mean Std,
Deviation Std, Error
95% Confidence Interval for Mean
Minimum Maximum Lower
Bound
Upper Bound
Formula_ODT 3 74,7633 1,20268 ,69437 71,7757 77,7510 73,42 75,74
Pembanding_1 3 64,6333 ,69644 ,40209 62,9033 66,3634 64,14 65,43
Pembanding_2 3 60,0133 ,78309 ,45212 58,0680 61,9586 59,11 60,50
Total 9 66,4700 6,58230 2,19410 61,4104 71,5296 59,11 75,74
Test of Homogeneity of Variances
Efisiensi Disolusi
Levene Statistic df1 df2 Sig,
ANOVA
Efisiensi Disolusi
Sum of
Squares
df
Mean Square
F
Sig,
Between
Groups
341,524
2
170,762
201,315
,000
Within Groups
5,089
6
,848
Total
346,613
8
Keterangan :
F
hitung(201,315) > F
tabel(0,05) (2,6)(5,14) maka H
0ditolak dan ada perbedaan
193
Multiple Comparisons
Efisiensi Disolusi
Dunnett t (2-sided)
a(I) Formula
(J)
Formula
Mean
Difference
(I-J)
Std,
Error
Sig,
95% Confidence
Interval
Lower
Bound
Upper
Bound
Pembanding
1
Formula
ODT
-10,13000
*,75199
,000
-12,2828 -7,9772
*Pembanding
2
Formula
ODT
-14,75000
*,75199
,000
-16,9028
-12,5972
*a, Dunnett t-tests treat one group as a control, and compare all other groups
against it,
*, The mean difference is significant at the 0,05 level,
Keterangan :
LAMPIRAN AV
UJI F KURVA BAKU DENGAN HCl 0,1 N UNTUK UJI
PENETAPAN KADAR DOMPERIDONE
Replikasi C(ppm) Abs X2 Y2 XY
I
2,04 0,081 4,1616 0,0066 0,16524 4,08 0,141 16,6464 0,0199 0,57528 6,12 0,191 37,4544 0,0365 1,16892 8,16 0,253 66,5856 0,0640 2,06448 10,20 0,314 104,0400 0,0986 3,2028 12,24 0,374 149,8176 0,1399 4,57776 14,28 0,431 203,9184 0,1858 6,15468
Total 582,6240 0,5512 17,9092
II
2,02 0,078 4,0643 0,0061 0,157248 4,03 0,139 16,2570 0,0193 0,560448 6,05 0,204 36,5783 0,0416 1,233792 8,06 0,270 65,0281 0,0729 2,17728 10,08 0,327 101,6064 0,1069 3,29616 12,09 0,386 146,3132 0,1490 4,669056 14,11 0,442 199,1485 0,1954 6,237504
Total 568,9958 0,5912 18,3315
III
2,02 0,078 4,0643 0,0061 0,157248 4,03 0,135 16,2570 0,0182 0,54432 6,05 0,185 36,5783 0,0342 1,11888 8,06 0,252 65,0281 0,0635 2,032128 10,08 0,307 101,6064 0,0942 3,09456 12,09 0,359 146,3132 0,1289 4,342464 14,11 0,422 199,1485 0,1781 5,955264
Total 568,9958 0,5233 17,2449
Persamaan regresi :
Replikasi I
: y = 0,0287x + 0,0209 (r
hitung/ r
tabel= 0,9997/ 0,754)
Replikasi II
: y = 0,0303x + 0,0196 (r
hitung/ r
tabel= 0,9993/ 0,754)
195
Jumlah X2
Jumlah XY
Jumlah
Y2 n Residual SS
Residual DF
Pers, Reg, I 582,984 17,909 0,551 7 8,4377 , 10-4 5 Pers, Reg, II 568,996 18,331 0,591 7 4,4126 , 10-4 5 Pers, Reg, III 568,996 17,245 0,523 7 3,4250 , 10-4 5
Pooled reg, 16,2753 ,10-4 15
Common reg,
1720,976 53,485 1,665 2,7770,10-3 17
SS1
= ∑ (Y
2) –
= 0,551 –
= 8,4377 , 10
-4SS2
= ∑(Y
2) –
= 0,591 –
= 4,4126 , 10
-4SS3
= (Y
2) –
= 0,523 –
= 3,4259 , 10
-4SSe
= Common regression = 1,665 –
= 2,777 , 10
-4F
hitung= 2,777 , 10
-4– 16,2753 , 10
-4x 15
5 -1 16,2753 , 10
-4= 2,777 , 10
-4– 16,2753 , 10
-4LAMPIRAN AW
HASIL UJI ANAVA
CARR’S INDEX
DENGAN
DESIGN EXPERT
Response 2 carrs index ANOVA for selected factorial model
Analysis of variance table [Partial sum of squares - Type III]
Sum of Mean F p-value
Source Squares df Square Value Prob > F
Model 56,53333 7 8,07619 4,52659 0,0059 significant A-PVPK-30 51,04167 1 51,04167 28,60813 < 0,0001
B-VIVASOL 0,106667 1 0,106667 0,059785 0,8099 C-MANITOL 2,281667 1 2,281667 1,278842 0,2748 AB 2,041667 1 2,041667 1,144325 0,3006 AC 0,96 1 0,96 0,538066 0,4738 BC 0,041667 1 0,041667 0,023354 0,8805 ABC 0,06 1 0,06 0,033629 0,8568 Pure Error 28,54667 16 1,784167
Cor Total 85,08 23
The Model F-value of 4,53 implies the model is significant, There is only
a 0,59% chance that a "Model F-Value" this large could occur due to noise,
Values of "Prob > F" less than 0,0500 indicate model terms are significant,
In this case A are significant model terms,
Values greater than 0,1000 indicate the model terms are not significant,
If there are many insignificant model terms (not counting those required to support hierarchy), model reduction may improve your model,
Std, Dev, 1,335727 R-Squared 0,664473
Mean 21,7
Adj
R-Squared 0,517679
C,V, % 6,155424
Pred
R-Squared 0,245063
PRESS 64,23
Adeq
Precision 5,230064
197
Coefficient Standard 95% CI 95% CIFactor Estimate df Error Low High VIF Intercept 21,7 1 0,272654 21,122 22,278 A-PVPK-30 -1,45833 1 0,272654 -2,03633 -0,88033 1 B-VIVASOL -0,06667 1 0,272654 -0,64467 0,511334 1 C-MANITOL 0,308333 1 0,272654 -0,26967 0,886334 1 AB 0,291667 1 0,272654 -0,28633 0,869668 1 AC -0,2 1 0,272654 -0,778 0,378001 1 BC 0,041667 1 0,272654 -0,53633 0,619668 1 ABC 0,05 1 0,272654 -0,528 0,628001 1
Final Equation in Terms of Coded Factors: carrs index = 21,7 -1,45833 * A -0,06667 * B 0,308333 * C 0,291667 * A * B
-0,2 * A * C 0,041667 * B * C 0,05 * A * B * C Final Equation in Terms of Actual Factors:
carrs index = 21,7
-1,45833 * PVPK-30 -0,06667 * VIVASOL 0,308333 * MANITOL
0,291667 * PVPK-30 * VIVASOL -0,2 * PVPK-30 * MANITOL 0,041667 * VIVASOL * MANITOL
0,05 * PVPK-30 * VIVASOL * MANITOL
The Diagnostics Case Statistics Report has been moved to the Diagnostics Node,
In the Diagnostics Node, Select Case Statistics from the View Menu,Proceed to Diagnostic Plots (the next icon in progression), Be sure to look at the: 1) Normal probability plot of the studentized residuals to check for normality of residuals, 2) Studentized residuals versus predicted values to check for constant error,
3) Externally Studentized Residuals to look for outliers, i,e,, influential values, 4) Box-Cox plot for power transformations,
LAMPIRAN AX
HASIL UJI ANAVA
HAUSNER RATIO
DENGAN
DESIGN EXPERT
Response 1 hausner ratio ANOVA for selected factorial model
Analysis of variance table [Partial sum of squares - Type III]
Sum of Mean F p-value Source Squares df Square Value Prob > F Model 0,014529167 7 0,002076 3,745435 0,0136
A-PVPK-30 0,0135375 1 0,013538 24,42857 0,0001 significant
B-VIVASOL 3,75E-05 1 3,75E-05 0,067669 0,7981
C-MANITOL 0,000204167 1 0,000204 0,368421 0,5524 AB 0,000504167 1 0,000504 0,909774 0,3544 AC 0,000204167 1 0,000204 0,368421 0,5524 BC 3,75E-05 1 3,75E-05 0,067669 0,7981 ABC 4,16667E-06 1 4,17E-06 0,007519 0,9320 Pure Error 0,008866667 16 0,000554
Cor Total 0,023395833 23
The Model F-value of 3,75 implies the model is significant, There is only a 1,36% chance that a "Model F-Value" this large could occur due to noise, Values of "Prob > F" less than 0,0500 indicate model terms are significant, In this case A are significant model terms,
Values greater than 0,1000 indicate the model terms are not significant, If there are many insignificant model terms (not counting those required to support hierarchy),
model reduction may improve your model,
Std, Dev, 0,023540745 R-Squared 0,621015 Mean 1,275416667 Adj R-Squared 0,455209 C,V, % 1,845729747 Pred R-Squared 0,147284 PRESS 0,01995 Adeq Precision 4,659859
The "Pred R-Squared" of 0,1473 is not as close to the "Adj R-Squared" of 0,4552 as one might
normally expect, This may indicate a large block effect or a possible problem with your model
199
Coefficient Standard 95% CI 95% CIFactor Estimate df Error Low High
Intercept 1,275416667 1 0,004805 1,26523 1,285603 VIF A-PVPK-30 -0,02375 1 0,004805 -0,03394 -0,01356
B-VIVASOL -0,00125 1 0,004805 -0,01144 0,008937 1
C-MANITOL 0,002916667 1 0,004805 -0,00727 0,013103 1 AB 0,004583333 1 0,004805 -0,0056 0,01477 1 AC -0,00291667 1 0,004805 -0,0131 0,00727 1 BC 0,00125 1 0,004805 -0,00894 0,011437 1 ABC 0,000416667 1 0,004805 -0,00977 0,010603 1 1 Final Equation in Terms of Coded Factors:
hausner ratio = 1,275416667
-0,02375 * A -0,00125 * B 0,002916667 * C 0,004583333 * A * B
-0,00291667 * A * C 0,00125 * B * C 0,000416667 * A * B * C Final Equation in Terms of Actual Factors:
hausner ratio = 1,275416667
-0,02375 * PVPK-30 -0,00125 * VIVASOL 0,002916667 * MANITOL
0,004583333 * PVPK-30 * VIVASOL -0,00291667 * PVPK-30 * MANITOL
0,00125 * VIVASOL * MANITOL
0,000416667 * PVPK-30 * VIVASOL * MANITOL
The Diagnostics Case Statistics Report has been moved to the Diagnostics Node,
In the Diagnostics Node, Select Case Statistics from the View Menu,Proceed to Diagnostic Plots (the next icon in progression), Be sure to look at the: 1) Normal probability plot of the studentized residuals to check for normality of residuals, 2) Studentized residuals versus predicted values to check for constant error,
3) Externally Studentized Residuals to look for outliers, i,e,, influential values, 4) Box-Cox plot for power transformations,
LAMPIRAN AY
HASIL UJI ANAVA KERAPUHAN DENGAN
DESIGN EXPERT
,
Response 4 kerapuhan ANOVA for selected factorial model
Analysis of variance table [Partial sum of squares - Type III]
Sum of Mean F
p-value
Source Squares df Square Value
Prob > F
Model 0,182822 7 0,026117 1,171260666 0,3715 not significant A-PVPK-30 4,27E-05 1 4,27E-05 0,001913429 0,9657
B-VIVASOL 0,0602 1 0,0602 2,699735596 0,1199
C-MANITOL 0,007633 1 0,007633 0,342294433 0,5667 AB 0,098304 1 0,098304 4,408539422 0,0520 AC 0,0105 1 0,0105 0,470890286 0,5024 BC 0,000561 1 0,000561 0,025143647 0,8760 ABC 0,005582 1 0,005582 0,250307849 0,6237 Pure Error 0,356777 16 0,022299
Cor Total 0,539599 23
The "Model F-value" of 1,17 implies the model is not significant relative to the noise, There is a 37,15 % chance that a "Model F-value" this large could occur due to noise,
Values of "Prob > F" less than 0,0500 indicate model terms are significant, In this case there are no significant model terms,
Values greater than 0,1000 indicate the model terms are not significant,
If there are many insignificant model terms (not counting those required to support hierarchy), model reduction may improve your model,
Std, Dev, 0,149327 R-Squared 0,338810863 Mean 0,35425 Adj R-Squared 0,049540615
C,V, % 42,15299 Pred R-Squared
-0,487675559 PRESS 0,802748 Adeq Precision 3,11241158
A negative "Pred R-Squared" implies that the overall mean is a better predictor of your response than the current model,
201
Coefficient Standard 95% CI 95% CIFactor Estimate df Error Low High VIF Intercept 0,35425 1 0,030481 0,289632661 0,418867339 A-PVPK-30 -0,00133 1 0,030481 -0,065950672 0,063284006 1 B-VIVASOL -0,05008 1 0,030481 -0,114700672 0,014534006 1 C-MANITOL -0,01783 1 0,030481 -0,082450672 0,046784006 1 AB 0,064 1 0,030481 -0,000617339 0,128617339 1 AC -0,02092 1 0,030481 -0,085534006 0,043700672 1 BC 0,004833 1 0,030481 -0,059784006 0,069450672 1 ABC -0,01525 1 0,030481 -0,079867339 0,049367339 1
Final Equation in Terms of Coded Factors: kerapuhan =
0,35425
-0,00133 * A -0,05008 * B -0,01783 * C
0,064 * A * B -0,02092 * A * C 0,004833 * B * C
-0,01525 * A * B * C Final Equation in Terms of Actual Factors:
kerapuhan = 0,35425
-0,00133 * PVPK-30 -0,05008 * VIVASOL -0,01783 * MANITOL
0,064 * PVPK-30 * VIVASOL -0,02092 * PVPK-30 * MANITOL 0,004833 * VIVASOL * MANITOL
-0,01525 * PVPK-30 * VIVASOL * MANITOL
The Diagnostics Case Statistics Report has been moved to the Diagnostics Node,
In the Diagnostics Node, Select Case Statistics from the View Menu,Proceed to Diagnostic Plots (the next icon in progression), Be sure to look at the: 1) Normal probability plot of the studentized residuals to check for normality of residuals, 2) Studentized residuals versus predicted values to check for constant error,
3) Externally Studentized Residuals to look for outliers, i,e,, influential values, 4) Box-Cox plot for power transformations,
LAMPIRAN AZ
HASIL UJI ANAVA KEKERASAN DENGAN
DESIGN EXPERT
Response 3 kekerasan ANOVA for selected factorial model
Analysis of variance table [Partial sum of squares - Type III]
Sum of Mean F p-value
Source Squares df Square Value Prob > F
Model 3,226933 7 0,46099 1,762421 0,1646 not significant A-PVPK-30 1,938017 1 1,938017 7,409265 0,0151
B-VIVASOL 0,432017 1 0,432017 1,65165 0,2170 C-MANITOL 0,160067 1 0,160067 0,611954 0,4455 AB 0,035267 1 0,035267 0,134829 0,7183 AC 0,55815 1 0,55815 2,133873 0,1634 BC 0,030817 1 0,030817 0,117816 0,7359 ABC 0,0726 1 0,0726 0,277558 0,6055 Pure Error 4,185067 16 0,261567
Cor Total 7,412 23
The "Model F-value" of 1,76 implies the model is not significant relative to the noise, There is a 16,46 % chance that a "Model F-value" this large could occur due to noise,
Values of "Prob > F" less than 0,0500 indicate model terms are significant, In this case A are significant model terms,
Values greater than 0,1000 indicate the model terms are not significant,
If there are many insignificant model terms (not counting those required to support hierarchy), model reduction may improve your model,
Std, Dev, 0,511436 R-Squared 0,435366
Mean 3
Adj
R-Squared 0,188339
C,V, % 17,04786
Pred
R-Squared -0,27043
PRESS 9,4164
Adeq
Precision 3,759174
A negative "Pred R-Squared" implies that the overall mean is a better predictor of your response than the current model,
"Adeq Precision" measures the signal to noise ratio, A ratio of 3,76 indicates an inadequate signal and we should not use this model to navigate the design space,
Coefficient Standard 95% CI 95% CI
203
Final Equation in Terms of Coded Factors:kekerasan = 3
0,284167 * A -0,13417 * B -0,08167 * C 0,038333 * A * B
0,1525 * A * C 0,035833 * B * C
0,055 * A * B * C Final Equation in Terms of Actual Factors:
kekerasan = 3
0,284167 * PVPK-30 -0,13417 * VIVASOL -0,08167 * MANITOL
0,038333 * PVPK-30 * VIVASOL 0,1525 * PVPK-30 * MANITOL 0,035833 * VIVASOL * MANITOL
0,055 * PVPK-30 * VIVASOL * MANITOL
The Diagnostics Case Statistics Report has been moved to the
Diagnostics Node,
In the Diagnostics Node, Select Case Statistics from the View Menu,
Proceed to Diagnostic Plots (the next icon in progression), Be sure to
look at the:
1) Normal probability plot of the studentized residuals to check for
normality of residuals,
2) Studentized residuals versus predicted values to check for constant
error,
3) Externally Studentized Residuals to look for outliers, i,e,, influential
values,
4) Box-Cox plot for power transformations,
LAMPIRAN BA
HASIL UJI ANAVA WAKTU HANCUR DENGAN
DESIGN EXPERT
Response 5 waktu hancur ANOVA for selected factorial model
Analysis of variance table [Partial sum of squares - Type III]
Sum of Mean F p-value Source Squares df Square Value Prob > F
Mod