T
T
T anzania
C
C
Coastal
M
M
Management
P
P
P
artnership
A joint initiative between the National Environment Management Council, the University of Rhode Island/Coastal Resources Center and the
United States Agency for International Development
SOCIOECONOMIC ASSESSMENT OF
TANZANIA'S COASTAL REGIONS
A Background Study prepared for the Tanzania Coastal Management Partnership
BACKGROUND DOCUMENT
October, 1998
Prepared by:
Susan Wagner, University of Dar Salaam and Ignace Mchallo, National Environment Management Council
With James Tobey, University of Rhode Island
PREFACE
This study reviews socioeconomic conditions and trends in the five coastal regions of mainland Tanzania—Lindi, Tanga, Mtwara, Coast and Dar es Salaam. Regional statistics do not necessarily give an accurate picture of life in coastal communities. Nevertheless, since most information is collected on a regional basis, regional information was used as a starting point for this assessment of socioeconomics and coastal management. The study was prepared as a background report for the Tanzania Coastal Management Partnership (TCMP). It was written by Susan Wagner, University of Dar es Salaam, and Ignace Mchallo, National Environment Management Council (NEMC), with the supervision of James Tobey, University of Rhode Island Coastal Resources Center (CRC).
This is a preliminary, fact-finding study and does not pretend to be a comprehensive treatment of socioeconomic issues. The objective was to become familiar with existing socioeconomic information specific to the coastal regions, to identify key issues, and to help identify selected topics for further and more focused research. The draft is being made available to elicit reviewer comments. Field visits to selected coastal communities to observe, interview and collect baseline information would be an important part of follow-up activities to improve understanding of key socioeconomic issues.
The limitations of data need to be noted from the outset. Data availability, reliability and consistency across different regions are problematic. Socioeconomic data are scattered and often do not exist or are outdated, and then extrapolated into the future. The last population census in Tanzania was in 1988. The capacity of the government to collect and process information is lagging behind the changes taking place in the economy. In particular, the Bureau of Statistics does not have the financial resources to adequately undertake all the data collection activities under its mandate. Data are scattered and inconsistent. Normally, regional authorities produce annual “Socioeconomic Profiles” that contain essential information on the socioeconomic status of the region. However, these reports are not comprehensive, nor is the data they present consistent across regions. Price information is typically missing. An additional problem is that the employment and products of the informal sector—a critical component of Tanzania’s coastal regions—are not counted in official statistics.
Information was gathered from primary and secondary sources. Most information was obtained from national government agencies such as the Planning Commission, Dar es Salaam City Commission, Bureau of Statistics, National Environmental Management Council (NEMC) and various libraries and information centers in the capital. Time and resources allowed for only one field trip to Tanga. During the field visit, consultations were held with the Tanga Coastal Zone Conservation Development Programme and various regional authorities. Interviews were also held with the district authorities of Pangani and Muheza.
Seaweed farming and other mariculture activities are not covered in this study. Mariculture, as well as coastal salt and lime production, is addressed in the reports of the TCMP Core Policy Working Group and Mariculture Working Group prepared in parallel with this study.
TABLE OF CONTENTS
PREFACE ...i
LIST OF TABLES...iv
EXECUTIVE SUMMARY... 1
1.0 POPULATION DYNAMICS ... 3
2.0 THE CONTRIBUTION OF COASTAL REGIONS TO THE
ECONOMY OF TANZANIA ... 4
2.1 AGRICULTURE... 5
2.2 LIVESTOCK... 10
2.3 FORESTRY... 10
2.4 FISHERIES... 12
2.5 MINING... 14
2.6 TOURISM... 15
2.7 MANUFACTURING AND INDUSTRY... 16
3.0 THE INFORMAL SECTOR... 17
4.0 WOMEN’S DEVELOPMENT GROUPS IN COASTAL
REGIONS ... 17
5.0 BALANCING DEVELOPMENT AND ENVIRONMENTAL
SUSTAINABILITY ... 18
6.0 HEALTH AND SOCIAL SERVICES ... 19
6.1 HEALTH... 20
6.2 SANITATION... 22
6.3 NUTRITION... 22
6.4 EDUCATION... 23
6.5 WATER SUPPLY... 24
7.0 COMMUNICATION AND TRANSPORTATION
INFRASTRUCTURE ... 25
7.1 ROADS... 25
7.2 PORTS AND HARBORS... 26
7.3 AIR SERVICES... 27
7.4 RAILWAYS... 27
7.5 TELECOMMUNICATIONS... 27
7.6 ELECTRICAL POWER... 28
LIST OF TABLES
1.1 Population density and annual population growth rate by region 1.2 Lifetime migration by region
2.1 Regional contribution to national GDP 2.2 GDP per capita, 1994
2.3 Food crop production, coastal regions, 1991 (tons) 2.4 Food and cash crop production, Mtwara region (tons) 2.5 Cashewnut production by major producing regions (tons) 2.6 Agricultural production, Dar es Salaam region
2.7 Contribution of agriculture to total income, Coast region, 1991 and 1996 2.8 Hectares of major food crops under production, Lindi region
2.9 Production of major food crops, Lindi region (tons) 2.10 Simsim production in major producing regions (tons) 2.11 Production of food and cash crops, Tanga region (tons) 2.12 Livestock population by region
2.13 Forest product imports, Dar es Salaam, 1991 2.14 Forest product revenues, Mtwara region
2.15 Forest product revenues, Dar es Salaam region, 1991 2.16 Forest product revenues, Coast region (Tshs.) 2.17 Marine and freshwater fishery resources 2.18 Marine fishery resources by region, 1993 2.19 Mineral deposits by district, Tanga region 2.20 Mineral deposits, Mtwara region
6.1 Top ten diseases by number of cases, Coast region 6.2 Number of health facilities by region, 1996
6.3 Hospitals and dispensaries per capita by region, 1996 6.4 Life expectancy at birth by region, 1978 and 1988 census
6.5 Infant mortality rate and under five mortality rate by region (per 1,000)
6.6 Urban and rural infant mortality rate and under five mortality rate by coastal region, 1988
6.7 Type of toilet facility by region (percentage of households, 1988 census) 6.8 Nutrition status of children by region, 1995
6.9 Number of secondary schools by region
6.10 Number of village water committees and water funds by region, 1996 7.1 Kilometers of roads, Coast region, 1996
EXECUTIVE SUMMARY
The coastal regions of Tanzania are critical to its future social and economic development. They are rich in natural resources and currently contribute a more than proportionate share of national income (32 percent). There is substantial potential for agriculture, mariculture and fisheries, tourism, small-scale mining, and manufacturing. The country’s principal urban area—Dar es Salaam—and 75 percent of the country’s industry are located in coastal regions.
One of the challenges for coastal management is to harness the potential of the coastal regions’ natural and human resources in a way that is environmentally, socially, and economically sustainable. Promoting sustainable development in coastal regions is important because of the growing human pressures on the resource base.
Promoting and managing balanced growth in coastal regions will mean addressing issues of rural poverty, equity, resource use, and underlying development constraints. This study shows that a large percentage of the coastal population lives at very low levels of welfare. The level of per capita income, health and educational standards, and basic infrastructure is very low, especially in rural areas. Some coastal regions are ranked among the poorest in the nation. This is the context in which national and local coastal management efforts must operate. A conclusion that can be drawn is that sustainable coastal management strategies and activities should maintain a focus on promoting social and economic development.
The main findings of the study are listed below.
1. There is a significant pattern of rural-urban migration, particularly to the city of Dar es Salaam. It is anticipated that over 33 percent of the country’s population will live in urban areas by the turn of the century, compared to 18 percent in 1988 (World Bank, 1996). Major reasons are the lack of communication and transportation infrastructure in rural coastal areas, especially in southern regions, lack of livelihood opportunities and social services, and poor performance of agriculture and fishing.
2. In the coastal regions overall, agriculture is the most important sector in terms of employment and income. Most men and women are farmers. The agricultural potential remains to be harnessed as productivity is low. The main constraints relate to the need to access more productive, appropriate technology, including reliable low-cost implements, extension service support, supply of inputs (including fertilizers, fuel and seeds), and provision of rural infrastructure (including transport and water resources). Rural farmers need advice on sound farming practices. Improved rural infrastructure, particularly rural roads and low-cost public transport, is essential to the effective functioning of markets. Other than the Postal Banks, rural financial institutions are lacking.
4. The demand for forestry products in coastal regions is growing rapidly, especially due to population increases and growing demand of the city of Dar es Salaam. Timber cutting and sale of wood is an important economic activity for villagers. The revenues from timber product licenses are also important source of district revenue. Forests in coastal regions are cut for household cooking; for fuelwood in the production of lime, salt, and charcoal; construction; boat building; crafts; and to clear land for low input, extensive agriculture. Wood and charcoal are the source of energy for most residents of coastal regions in Tanzania in both urban and rural areas. Hardwood species are exploited for woodcarvings and woodwork.
5. In coastal regions, particularly in urban areas, the informal sector is becoming a more significant component of the economy. The number of people in the informal sector has grown as the economic situation has worsened and real wages have declined. The informal sector has an important role to play because it provides income-earning opportunities for large numbers of unskilled and otherwise jobless people.
6. Health, nutrition, sanitation, safe water access, and educational standards are low, especially in rural areas. It is increasingly difficult to finance basic public services from domestic revenues.
7. There is great potential to empower and increase the role of women in the economy and social development of coastal communities. Credit schemes in coastal regions are having an impact on the establishment and strengthening of women’s groups, providing them with credit and technology, improving their marketing skills, and thus helping to improve their income earning potential.
8. Problems with infrastructure, including roads and other transport, port facilities, electrical power, and telecommunications, are fundamental and underlying issues in almost all aspects of development in coastal regions. They have a major impact on economic growth, decisions to migrate, health, education, and sanitation.
Finally, there are a number of complex and multi-dimensional issues that this preliminary study does not address, but that have direct relevance for coastal resource stewardship, and should be priorities for further socioeconomic research. They include:
• How the rural poor make decisions on resource use, strategies for coping with poverty, and the essential factors that determine the prosperity or poverty of a community.
• Gender, inequality, and the quantity and quality of associational life and related norms in coastal communities.
• The impact of the land tenure system on equity, migration, and flexibility and adaptation in the economy. There is currently a shift to a private, market-based economy, yet there is no market-based system for land purchase and sale.
1.0
POPULATION DYNAMICS
Tanzania’s coastal zone stretches 800 kilometers from North to South along the Western Indian Ocean. The five coastal regions encompass about 15 percent of the country’s land area and are home to approximately 25 percent of the country’s population. Most of the country’s major urban areas and industrial activities are located in coastal regions,
including Dar es Salaam, the national capital.
Recent estimates indicate that the population of the five coastal regions has increased to about seven million, with a growth rate of 2-6 percent (Linden and Lundin, 1996). The growth rate for mainland Tanzania overall, according to 1988 census data, is 2.8 percent. Data on population in coastal regions is shown in Table 1.1.
Table 1.1. Population density and annual population growth rate by region
1988 1996 2000
Region Land Area Km.2 Actual Population Annual Growth Rate % Population Density per Km.2 Population Estimates Population Density per Km.2 Population Estimates Population Density per Km.2 Tanga 27,348 1,280,262 2.1 46.8 1,514,550 55.4 1,647,185 60.2 Dar es
Salaam
1,350 (city)
1,360,900 4.7 1,008 1,982,355 1,468 2,392,039 1,772 Coast 32,450 638,000 2.1 19.7 754,714 23.3 820,848 25.3 Lindi 67,000 646,345 2.0 9.6 758,493 11.3 821,665 12.3 Mtwara 16,710 875,977 1.4 52.4 979,792 58.6 1,036,225 62.0 Mainland
Tanzania
*883,590 22,486,000 2.8 25.4 *28,131,560 (includes Zanzibar)
31.8 31,465,537 35.6 Source: Regional land area and year 1988 population and growth rate from Bureau of Statistics, 1988 census.
Year 1996 and 2000 estimates are extrapolated from 1988 population and growth rates. *World Bank, African Development Indicators, 1997.
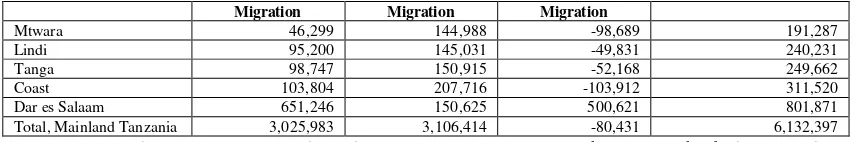
Statistics show a significant rural-urban migration pattern, particularly to the city of Dar es
Salaam (Table 1.2). Major reasons are the lack of communication and transportation
infrastructure in coastal regions, especially in southern regions; lack of livelihood opportunities; and poor performance of agriculture and fishing. The failure of the agricultural sector in terms of production of both food and cash crops discourages potential farmers. Availability of arable agricultural land is also an issue. Most of the arable land is owned by “customary law.” Especially in Mtwara and Lindi regions, cash crop plantations such as coconut and cashewnuts occupy large expanses of land leaving nowhere for the young to farm. Fishing along the coastline provides little attraction due to the low level of technology and the poor condition of gear. Incomes generated do not meet the economic needs of fishermen throughout the year. To reduce the tendency of rural-urban migration there is a need to identify actions to increase productivity of current economic activities in rural areas; promote alternative, environmentally sustainable livelihood opportunities; and strengthen infrastructure and social programs in rural areas. Expanding access to farmland by making unused government farms available to small farmers would also help reduce migration.
Poverty in the Lindi region and lack of infrastructure has led to large-scale migration of youths to urban areas, especially Dar es Salaam. The influx of youths to Dar es Salaam from Lindi and Mtwara has led to the formation of a distinctive social group known as ‘Wamachinga.’ With little education or money, most of the immigrants depend upon petty trading for survival. Young immigrants from Lindi and Mtwara are so recognized as street merchants that every youth in Dar es Salaam who participates in this activity is called “ Machinga,” after the name of the immigrants.
Table 1.2. Lifetime migration by region
Migration Migration Migration
Mtwara 46,299 144,988 -98,689 191,287 Lindi 95,200 145,031 -49,831 240,231 Tanga 98,747 150,915 -52,168 249,662 Coast 103,804 207,716 -103,912 311,520 Dar es Salaam 651,246 150,625 500,621 801,871 Total, Mainland Tanzania 3,025,983 3,106,414 -80,431 6,132,397 Source: 1988 Population Census, National Profile. Lifetime migration refers to changes in individuals’ regional domicile over their lifetime based on surveys completed for the 1988 Population Census.
2.0
THE CONTRIBUTION OF COASTAL REGIONS TO THE ECONOMY
OF TANZANIA
Over the period 1980-1994, the five coastal regions have contributed, on average,
about 32 percent of the national GDP (see Table 2.1). The distribution of this contribution
across the coastal regions is uneven, with Dar es Salaam and Tanga among the leading regional economies, and Lindi, Mtwara and Coast regions among the smallest. The economy of the Dar es Salaam region dominates the country. The cities of Dar es Salaam, Tanga, Mtwara, and Lindi are the major urban areas in the coastal regions.
Table 2.1. Regional contribution to national GDP Region 1994 GDP
(million Tshs.)
Contribution to GDP 1994
(%)
Contribution to GDP 1980-1994 Average
(%)
National Ranking 1980-1994 Average
Dar es Salaam 317,541 19.1 20.3 1 Arusha 145,192 8.7 7.8 2 Mwanza 107,553 6.5 7.7 3 Mbeya 84,903 5.1 6.0 4 Shinyanga 110,353 6.6 5.8 5 Iringa 92,021 5.5 5.5 6 Tanga 92,821 5.6 5.5 7 Morogoro 88,073 5.3 4.7 8 Kagera 80,537 4.9 4.6 9 Kilimanjaro 72,898 4.4 3.7 10 Mara 50,127 3.0 3.5 11 Tabora 55,012 3.3 3.4 12 Ruvuma 49,565 3.0 3.3 13 Mtwara 62,491 3.8 3.3 14 Rukwa 66,160 4.0 3.1 15 Dodoma 57,856 3.5 3.1 16 Singida 51,995 3.1 2.9 17 Kigoma 30,545 1.8 2.5 18 Lindi 29,253 1.8 2.0 19 Coast 17,033 1.0 1.0 20 Total 1,660,000 100.00
Source: National Account of Tanzania 1976-1994, 11th Edition, August 1995. (Totals are rounded off.)
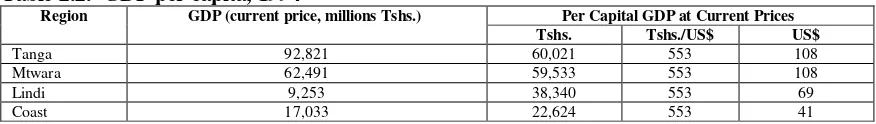
Some coastal regions are ranked nationally as among the poorest includingTanga,
Lindi, Mtwara, and Coast region. (Table 2.2 shows 1994 income per capita for these
Table 2.2. GDP per capita, 1994
Per Capital GDP at Current Prices Region GDP (current price, millions Tshs.)
Tshs. Tshs./US$ US$
Tanga 92,821 60,021 553 108 Mtwara 62,491 59,533 553 108 Lindi 9,253 38,340 553 69 Coast 17,033 22,624 553 41 Source: National Account of Tanzania 1976-1994, 11th Edition, August 1995; Socioeconomic Profile, Tanga region, 1997.
The economy of rural coastal regions depends mainly on small-holder farming and cash crop farming; subsistence forestry and charcoal production; artisanal fishing; lime production; salt production; seaweed mariculture; livestock husbandry; small-scale trade (esp. selling of fish, mangrove poles, coconut, salt, lime and retail goods); and handicrafts. Most families in the coast are involved in more than one economic activity. Common food crops are paddy, cassava, legumes, sorghum, sweet potatoes, millet, bananas, fruits, and vegetables. The major cash crops are cotton, sisal, cashews, and coconuts. In coastal communities, coconut is the most important cash crop in terms of land area in production and number of farms. Coconuts are primarily brought to market and sold in Dar es Salaam for domestic consumption.
For over a decade, the country has pursued a program of reforming restrictive state controls that led to economic stagnation and deterioration of living conditions between the 1970s and early 1980s (World Bank, 1996). For example, controls on agricultural input and output markets and prices were abolished; restrictions on traditional exports and import controls were lifted; taxes were simplified; official exchange rate controls were phased out; and interest rate controls and restrictions on private banking were lifted. Privatization of state-owned enterprise has progressed rapidly since the parastatal reform program was initiated in 1993. Investment policies were liberalized and in 1996 the National Investment Promotion Policy was adopted. A new National Land Policy was adopted by the cabinet in March 1995. These economic and land reforms were accompanied by political and administrative reforms. The country is moving toward a more decentralized government structure—giving district authorities greater fiscal and planning autonomy.
The National Development Plan still acts as an umbrella policy from which regional and district plans draw guidance. The emphasis in national development planning continues to be on achieving sustained increases in national income, with the expectation that this will improve social welfare. Environmentally sustainable development is not well incorporated in national and regional planning.
2.1
Agriculture
Agriculture is the country’s most important sector in terms of employment and
income. Most men and women are farmers. In 1994 the agricultural GDP was 57 percent of
the total GDP for the country. About 84 percent of the labor force are engaged in the agricultural sector. However, agricultural productivity is low. Output levels are below or not much greater than those of the early 1970s for some important crops. For example, total export of cashewnuts was over 100,000 metric tons during 1972-74, compared to less than 60,000 in 1994 and 108,000 metric tons in 1997. The southern coastal regions are the main producers of cashewnuts.
Much of Tanzania’s agricultural potential remains to be harnessed. Most of the
would enhance productivity. Maize yield, for example, is about a third of the world average.
Improved agricultural productivity is critical to reducing rural poverty. The main constraints
relate to the need to access more productive technology; durable, low-cost implements; extension service support; supply of inputs, including fertilizers, fuel and seeds; and provision of rural infrastructure, including transport and water resources (World Bank, 1996). Poor farmers need extension assistance on sustainable farm practices. Improved rural infrastructure, particularly rural roads and low-cost public transport, is essential to the effective functioning of markets. Other than the Postal Banks, rural financial institutions are lacking. Because transactions are small and costs high, formal institutions tend to limit their rural activities to market centers.
There is a need to strengthen extension, training, and awareness-building to promote sustainable agricultural practice; develop mechanisms to provide rural credit; make available low-cost, appropriate technologies; demonstrate the feasibility of small irrigation schemes; improve marketing of agricultural products; and test the feasibility of alternative agricultural activities (e.g. high value horticulture and beekeeping).
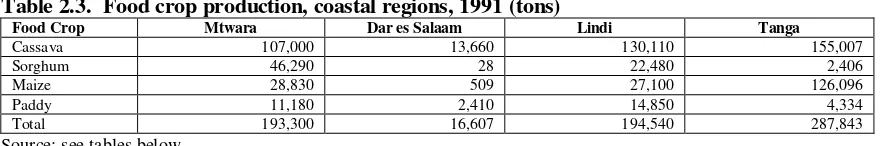
Table 2.3 summarizes agricultural output for major food crops across the coastal regions for which data was obtained for this study.
Table 2.3. Food crop production, coastal regions, 1991 (tons)
Food Crop Mtwara Dar es Salaam Lindi Tanga
Cassava 107,000 13,660 130,110 155,007 Sorghum 46,290 28 22,480 2,406 Maize 28,830 509 27,100 126,096 Paddy 11,180 2,410 14,850 4,334 Total 193,300 16,607 194,540 287,843 Source: see tables below.
Mtwara region. Agriculture is the predominant economic sector, with about 90 percent of agricultural output from individual, small-holder farmers. The main food crops are cassava, sorghum, millet, and increasingly maize, and paddy. The local population generally prefers paddy and maize, but regional authorities emphasize cassava and sorghum due to their resistance to drought. Cash crops include cashewnuts, sesame, groundnuts and coconuts.
Area under cultivation is about 270,300 ha., or only about 55 percent of total arable land
area in the region (599,500 ha.). Regional production of food crops is low, and in some
years the region is a net importer of food. Small irrigation schemes would improve
production. Table 2.4 shows trends in food and cash crop production between 1990-1997.
Table 2.4. Food and cash crop production, Mtwara region (tons)
Food Crops 1990/91 1991/92 1992/93 1993/94 1994/95 1995/96 1996/97
Cassava 107,000 101,410 129,415 177,310 230,140 332,704 404,463 Sorghum 46,290 11,610 90,203 14,000 27,040 52,091 63,823 Maize 28,830 19,650 74,671 15,120 58,130 90,343 106,444 Paddy 11,180 15,300 43,592 17,440 33,620 53,612 24,716 Cow/pigeon peas 220,380 65,880 22,750 34,000 21,210 17,260 30,252
Cash Crops
Cashewnuts 15,209 21,286 17,943 21,834 27,463 49,106 --Groundnuts 6,150 21,790 41,220 13,010 12,040 27,771 --Sesame 4,020 2,940 7,380 1,860 3,920 10,965 --Other (Soya and Sunflower) 5,270 230 1,948 - 170 95 --Source: Regional Agricultural Development Office, Mtwara, 1997.
Cashewnuts are produced primarily for export and are an important source of foreign exchange earnings for the country. In 1994, cashewnut exports accounted for 5.8
percent of total national exports (World Bank, 1996). Mtwara is the main producer—about
Table 2.5. Cashewnut production by major producing regions (tons)
Region 1991/92 1992/93 1993/94 1994/95 1995/96 Total As % of Total
Lindi 5,913 7,435 5,944 9,063 11,585 39,940 14.7 Mtwara 22,125 17,943 21,834 27,536 49,107 138,545 51. Coast 4,163 2,333 7,468 12,200 6,855 33,019 12.1 Tanga 2,246 2,122 2,148 500 978 7,994 3. Ruvuma 2,854 5,165 4,981 6,640 7,997 27,637 10.2 Dar es
Salaam
3,840 4,131 3,576 5,864 1,591 19,002 7. Others 97 194 652 1,000 3,613 5,556 2. Total 41,238 39,323 46,603 62,803 81,726 271,693 100 Source: Ministry of Agriculture, 1997.
Dar es Salaam region. The land area of the city of Dar es Salaam is 1,350 sq. km. About 430 sq. km. is reserved for urban development and 900 sq. km. are suitable for agriculture. Agricultural land use is summarized in Table 2.6.
Table 2.6. Agricultural production, Dar es Salaam region
Food Crop Hectares Tons
Cassava 5,464 13,660 Paddy 4,414 2,410 Sweet potatoes 3,242 4,084 Sorghum 48 28 Beans 170 42 Maize 2,033 509 Bananas 3,795 45,540
Cash Crop
Cashewnut 3,836 11,138 Coconut 6,385 6,000 Oranges 1,694 5,082 Pineapples 774 1,548 Sesame 560 1,792 Cotton 177 56 Source: Regional Agricultural Office, Dar es Salaam 1992.
Coast region. The Coast region’s economy is mainly agricultural. More than 90 percent of the population is employed in agriculture and it contributes more than 80 percent of regional income (see Table 2.7).
Table 2.7. Contribution of agriculture to total income, Coast region, 1991 and 1996 Agriculture Other Sectors
Year
Income (Tshs.)
Percent of Regional Income
Income (Tshs.)
Percent of Regional Income
Total Regional Income (Tshs.)
1991 4,912,600,000 84.7 887,400,000 15.3 5,800,000,000 1996 17,310,400,000 83.3 3,462,088,000 16.7 20,772,488,000 Source: Coast region, Socioeconomic Profile, 1997.
Agriculture is dominated by individual, small-holder farms relying on family labor and traditional farming methods. Only 18.6 percent of the total arable land in the region is
farmed suggesting that the potential to increase regional agricultural output is large. The
main food crops are paddy, maize, cassava, millet and sorghum. In 1995, paddy production was 52,562 tons on 15,000 ha. of land for an average of 3,504 tons per ha. Export of perishable food crops outside the region (e.g. fruits like oranges, pineapples and mangos) is constrained by poor transportation infrastructure, although there is an abundant supply. The major cash crops in the region are cashewnuts, cotton, coconuts, sesame, vegetables and fruits.
Lindi region. Individual, small-holder farms using traditional techniques are also predominant in the Lindi region—producing about 90 percent of agricultural output. Yields
are low and output growth is not keeping pace with population growth (estimated at 2.0
the biggest single food crop grown in Lindi, accounting for about 33 percent of land under cultivation. In 1997, 49,100 ha. out of 150,500 ha. of cultivated land were planted with cassava for a total yield of 88,400 tons.
Table 2.8. Hectares of major food crops under production, Lindi region
Crop 1991/92 1992/93 1993/94 1994/95 1995/96 1996/97 1997/98
Maize 25,000 53,300 60,000 30,400 63,000 62,300 62,300
Sorghu m
26,000 28,800 29,300 28,700 28,300 27,400 27,400
Paddy 14,300 10,800 1,600 12,800 12,200 11,700 11,700
Cassava 50,000 46,300 53,900 50,800 51,700 49,100 49,100
Source: Basic Data, Agriculture and Livestock Sector, Ministry of Agriculture, September 1998.
Table 2.9. Production of major food crops, Lindi region (tons)
Crop 1991/92 1992/93 1993/94 1994/95 1995/96 1996/97 1997/98
Maize 27,100 52,800 54,000 26,800 56,700 56,700 56,100
Sorghu m
22,480 35,800 12,200 33,600 25,800 21,300 22,000
Paddy 14,850 10,800 1,600 12,300 14,700 14,000 14,000
Cassava 130,110 120,400 140,200 92,400 93,300 88,500 88,400
Source: Basic Data, Agriculture and Livestock Sector, Ministry of Agriculture, September 1998.
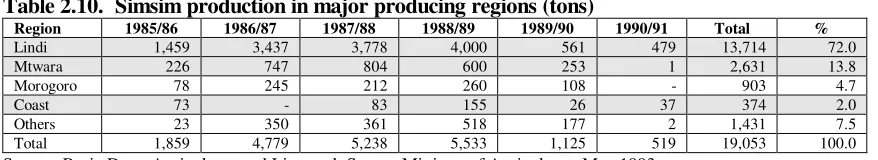
The region’s important cash crops are cashewnuts and simsim. The region is the biggest simsim producer in the country, contributing about three-quarters of total production
(see Table 2.10). Lindi is also the second largest producer of cashewnuts in the country. In the 1995/96 crop year the region harvested 39,940 tons, second only to Mtwara whose output was 138,545 tons.
Table 2.10. Simsim production in major producing regions (tons)
Region 1985/86 1986/87 1987/88 1988/89 1989/90 1990/91 Total %
Lindi 1,459 3,437 3,778 4,000 561 479 13,714 72.0 Mtwara 226 747 804 600 253 1 2,631 13.8 Morogoro 78 245 212 260 108 - 903 4.7 Coast 73 - 83 155 26 37 374 2.0 Others 23 350 361 518 177 2 1,431 7.5 Total 1,859 4,779 5,238 5,533 1,125 519 19,053 100.0 Source: Basic Data, Agriculture and Livestock Sector, Ministry of Agriculture, May 1993.
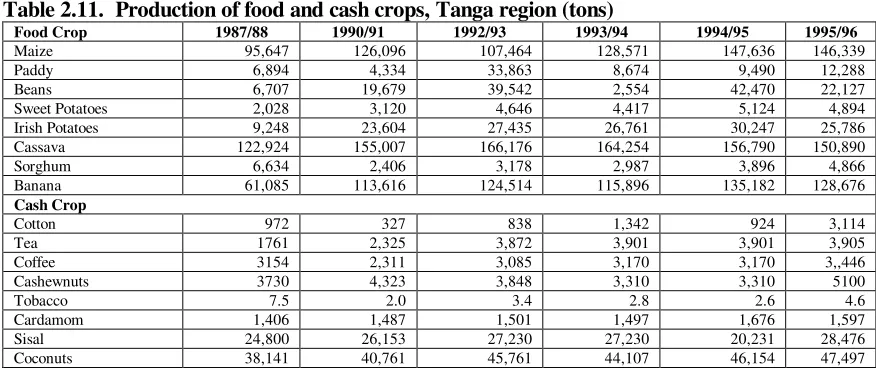
Table 2.11. Production of food and cash crops, Tanga region (tons)
Food Crop 1987/88 1990/91 1992/93 1993/94 1994/95 1995/96
Maize 95,647 126,096 107,464 128,571 147,636 146,339 Paddy 6,894 4,334 33,863 8,674 9,490 12,288 Beans 6,707 19,679 39,542 2,554 42,470 22,127 Sweet Potatoes 2,028 3,120 4,646 4,417 5,124 4,894 Irish Potatoes 9,248 23,604 27,435 26,761 30,247 25,786 Cassava 122,924 155,007 166,176 164,254 156,790 150,890 Sorghum 6,634 2,406 3,178 2,987 3,896 4,866 Banana 61,085 113,616 124,514 115,896 135,182 128,676
Cash Crop
Cotton 972 327 838 1,342 924 3,114 Tea 1761 2,325 3,872 3,901 3,901 3,905 Coffee 3154 2,311 3,085 3,170 3,170 3,,446 Cashewnuts 3730 4,323 3,848 3,310 3,310 5100 Tobacco 7.5 2.0 3.4 2.8 2.6 4.6 Cardamom 1,406 1,487 1,501 1,497 1,676 1,597 Sisal 24,800 26,153 27,230 27,230 20,231 28,476 Coconuts 38,141 40,761 45,761 44,107 46,154 47,497 Source: Socioeconomic Profile, Tanga region, 1997.
2.2
Livestock
Relative to the rest of the country, the livestock sector is small in all coastal regions, except
Tanga (see Table 2.12). Although the data of Table 2.12 is dated, it is presented to illustrate
the relative size of the livestock sector across the regions.
Table 2.12. Livestock population by region
Region Cattle Goats Sheep
Arusha 1,855,880 1,231,014 758,476 Coast 57,542 18,682 4,938 Dar es Salaam 6,158 9,524 1,449 Dodoma 1,001,840 539,648 169,779 Iringa 480,410 197,110 91,635 Kagera 364,795 344,262 53,784 Kigoma 62,319 167,348 36,428 Kilimanjaro 408,457 438,087 221,059 Lindi 6,217 13,205 8,582 Mara 969,766 394,444 215,558 Mbeya 901,077 171,486 101,365 Morogoro 332,683 139,948 53,274 Mtwara 15,046 84,864 14,519 Mwanza 1,357,535 570,142 249,943 Rukwa 392,234 75,319 21,115 Ruvuma 39,010 138,435 19,716 Shinyanga 1,882,081 871,826 486,798 Singida 939,821 476,532 280,349 Tabora 925,904 309,836 174,540 Tanga 472,909 258,284 116,840 Total 12,471,684 6,449,996 3,080,147 Source: Basic Data Agriculture and Livestock Sector, Ministry of Agriculture, various years 1983/84-1987/88.
2.3
Forestry
ebony. Other forests include mangroves along deltas, creeks, and estuaries and on coastal shores.
Forest timber is used for many purposes. A major use is for firewood and the production of charcoal. Wood and charcoal are the source of energy for most residents of
coastal regions in Tanzania in both urban and rural areas. The demand for timber for house
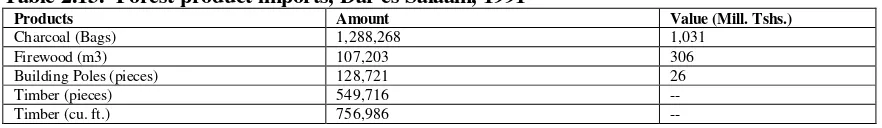
construction is another source of pressure on forests. In rural areas, mud and wood houses are built at least twice during a lifetime. Demand for firewood, charcoal and wood for construction is tremendous in the rapidly growing city of Dar es Salaam. Table 2.13 shows indicators of forest product imports into the city. The southern coastal regions in Tanzania are famous for carvings, carpentry and other woodwork. Hardwoods, such as teak and ebony are used for this purpose. The high international and domestic demand for hardwoods and fuelwood suggests that renewable forestry (e.g. farming fuelwood or hardwood trees as a cash crop through village plantations, small-holder tree farming or farm forestry) may be feasible in the coastal regions.
Table 2.13. Forest product imports, Dar es Salaam, 1991
Products Amount Value (Mill. Tshs.)
Charcoal (Bags) 1,288,268 1,031 Firewood (m3) 107,203 306 Building Poles (pieces) 128,721 26 Timber (pieces) 549,716 --Timber (cu. ft.) 756,986 --Source: Dar es Salaam Environmental Profile, Dar es Salaam City Commission, 1991.
In all regions, forests are cut to clear land for low input, extensive agriculture. In some locations wood is used in the production of lime and in the production of salt by
boiling. In coastal communities, wood is used in the preservation of fish. Salt production by
boiling is very fuel intensive and occurs mostly in the coastal area around Tanga and Pangani, in the area south of the Rufiji, and in the Rufiji Delta itself. The boiling method produces fine salt crystals needed to preserve sun-dried fish, whereas the solar evaporation method produces big crystals which have to be ground first, resulting in further processing and transport costs. Burning coral for the production of lime is an activity carried out mainly by people who live in coastal areas. It provides a building material that is less costly than the cement produced by industry. The production process is extremely fuel intensive. So far, license fees for salt production by boiling, and the manufacture of lime have not reflected environmental costs of
forest degradation and loss. Finally, there is illegal trade in hardwood forest products.
Export is primarily to the Near East and Iran, via Mafia and Zanzibar. Illegal trade of forest products by people outside local villages is the most significant source of mangrove deforestation in some areas.
All of these human activities exert enormous pressure on the country’s forests in coastal regions and the extent of forest cover. There are no reliable, scientific estimates of losses in forest cover. However, fuelwood extraction and land clearing for agriculture are
clearly the greatest causes of deforestation. In some specific coastal locations, as in villages
of Mtwara, woodcutting for lime production is the most serious pressure on forest cover. The socioeconomic impacts of forest loss on the poor who depend on forests for firewood and building material are significant and can even lead to resettling.
A license fee is charged on forest products based on the quantity of the product brought to market (such as bags of charcoal, firewood, building poles, or timber). Checkpoints along roads allow authorities to monitor compliance with the quantity of wood products that the license permits. Penalties for noncompliance can be severe (financial penalties and jail).
revenues were about 11, 5, 24, and 19 percent of total government revenues in the coast
region for the four fiscal years from 1992/93 to 1995/96, respectively. In a time of
government and fiscal decentralization, there is an incentive for local governments to encourage forest product trade and increase enforcement of the licensing system to generate much needed local revenues.
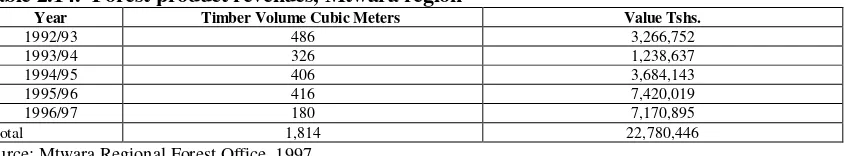
Timber harvest data and total revenues for Mtwara, Dar es Salaam and Coast region are shown in Tables 2.14, 2.15, and 2.16. Comparison of Table 2.13 with 2.15 shows the very large excess demand for forest products over the locally available supply in the Dar es Salaam region. Table 2.16 shows that forest product revenues have rapidly increased over the last 11 years in the Coast region. This probably reflects increased demand for the products due to population growth, particularly in the adjacent city of Dar es Salaam, and increased license fees.
Table 2.14. Forest product revenues, Mtwara region
Year Timber Volume Cubic Meters Value Tshs.
1992/93 486 3,266,752 1993/94 326 1,238,637 1994/95 406 3,684,143 1995/96 416 7,420,019 1996/97 180 7,170,895 Total 1,814 22,780,446 Source: Mtwara Regional Forest Office, 1997.
Table 2.15. Forest product revenues, Dar es Salaam region, 1991
Products Amount Value (Mill. Tshs.)
Charcoal (bags) 7,324 6.0 Firewood (m3) 1,405 4.0 Building Poles (pieces) 1,440 0.3 Source: Forestry Department, Dar es Salaam City Commission, 1991.
Table 2.16. Forest product revenues, Coast region (Tshs.)
Year Round Wood Charcoal Firewood Building Poles Total Revenue
1985/86 550,418 3,359,946 1,412,242 158,348 5,480,954 1986/87 876,828 6,279,285 129,334 1,119,249 8,404,696 1987/88 1,048,450 4,092,294 92,918 1,774,949 7,008,611 1988/89 1,428,578 4,411,690 57,815 183,145 6,081,228 1989/90 3,060,305 4,252,170 143,818 240,125 7,696,418 1990/91 10,209,417 8,185,980 173,004 479,790 19,048,191 1991/92 7,596,688 16,421,940 1,998,700 874,600 26,891,928 1992/93 12,728,667 23,571,750 583,300 2,964,358 39,848,075 1993/94 11,787,213 16,271,440 55,200 1,316,350 29,430,203 1994/95 14,740,700 29,977,700 1,066,500 805,840 46,590,740 1995/96 26,939,020 41,248,300 2,141,700 4,097,060 74,426,080 Source: Regional Forestry Division, Kibaha, 1997.
2.4
Fisheries
Fishing is the major livelihood and source of income for inhabitants of coastal
villages. A large percentage of the male population in coastal villages or towns are fishermen.
Mollusks (which are collected by women and children) and fish are the main source of protein for coastal people. Fish are also an important source of income not only for the fishermen, but also for many others engaged in the processing, frying and trading of fish.
With the exception of a few urban and overseas-based companies, most of the catch
in coastal regions is from the artisanal fishery using traditional techniques—hooks and lines,
fisheries contribute to more than 96 percent of total marine fish landings. There are three main types of artisanal fisheries vessels: ngalawa (sailing outrigger canoe), hori and mitumbwi (dugout canoes), and mashua (dhow). The bulk of artisanal fishing is concentrated in the area between the shoreline, the outer edge of the fringing reef, and on the shallow shelf of Mafia and Zanzibar channel. Fresh water fishing is carried out in large coastal rivers with small boats (2 to 8 meters in length). Dynamite fishing is common along the coast although it is prohibited by the government.
Domestic commercial fishing practices are largely carried out using trawlers and longliners. Offshore fishing is very limited. The most important variety of fish often caught by offshore commercial fishermen are pelagics such as tuna and swordfish. There is also a growing number of foreign commercial vessels that are operating illegally inside the exclusive zone.
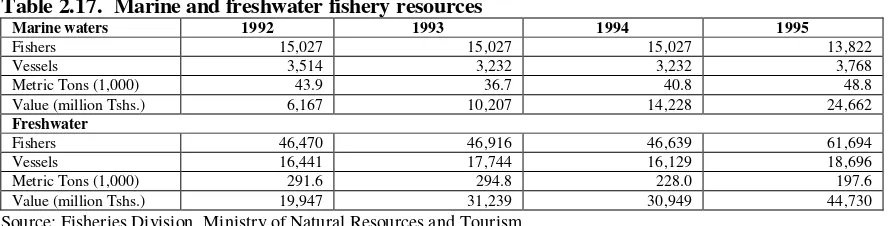
Table 2.17 shows that the inland freshwater fishery is over four times as large as the marine fishery in terms of number of fishers, vessels and quantity of catch. The difference between the two fisheries in terms of value, however, is not as great. In 1994 and 1995, the estimated value of the marine fishery catch was 46 and 55 percent, respectively, of the value of the freshwater fishery catch.
Table 2.17. Marine and freshwater fishery resources
Marine waters 1992 1993 1994 1995
Fishers 15,027 15,027 15,027 13,822 Vessels 3,514 3,232 3,232 3,768 Metric Tons (1,000) 43.9 36.7 40.8 48.8 Value (million Tshs.) 6,167 10,207 14,228 24,662
Freshwater
Fishers 46,470 46,916 46,639 61,694 Vessels 16,441 17,744 16,129 18,696 Metric Tons (1,000) 291.6 294.8 228.0 197.6 Value (million Tshs.) 19,947 31,239 30,949 44,730 Source: Fisheries Division, Ministry of Natural Resources and Tourism.
Table 2.18 shows fisheries resources by region for 1993.
Table 2.18. Marine fishery resources by region, 1993 Region Fishers Vessels Outboard
Engines
Metric Tons Production (% of total)
Value (million Tshs.)
Contribution to GDP (%)
Lindi 1,207 599 1 3,271 9.6 616 2.1 Coast 4,551 996 52 8,609 25.1 1,482 8.7 Dar es Salaam 3,276 577 116 14,867 43.4 5,555 1.8 Mtwara 1,508 362 1 2,624 7.7 574 0.9 Tanga 4,485 698 72 4,856 14.2 1,171 1.3 Source: Annual Statistics Report, Fisheries Division, Ministry of Natural Resources and Tourism, 1993.
The 1997 Socioeconomic Profile of the Tanga region indicates that there are 2,213 fishers and 787 vessels, representing a decline in the number of fishers but increase in number of vessels when compared with the table above from 1993. The artisanal fishery contributes just over 1 percent of the region’s GDP.
Fishing in the Mtwara and Lindi regions is limited to the artisanal fishery. The marine resources in the two regions are generally underfished. The fishing industry in Mtwara and Lindi regions contributes approximately 1 and 2 percent of regional GDP, respectively. In specific locations in Mtwara region, dynamite fishing has impacted fish abundance and catch.
The artisanal fisheries account for about 8 percent of GDP in the Coast region. It is a primary economic activity and source of food for coastal communities. One of the most important artisanal fish species in the Coast region, particularly the Rufiji district, is prawn.
About 80 percent of the commercial prawn catch of Tanzania takes place in the Rufiji Delta,
and about 40 percent of the catch comes from small-scale fishermen. The foreign market for prawns is large and the opportunity to increase harvest of this species has not been realized.
The lack of reliable transport and cooling facilities are the biggest obstacles to further
development of the prawn fishery. Large mangrove crabs are also an under-exploited resource
with great market potential in both the domestic tourism market and abroad, if transportation and marketing constraints could be overcome.
In summary, the main constraints to improved performance of the marine fisheries sector appear to be the lack of transportation and infrastructure to market products; lack of rural credit to finance growth; and the need for extension services to build awareness and demonstrate low-cost, appropriate technologies.
2.5
Mining
Officially, mining accounts for less than 2 percent of national GDP, but the actual
potential for expansion is considered to be enormous (World Bank, 1996). Small-scale
mining is growing, but large-scale mining performance has been limited by inadequate management, poor physical infrastructure; and poor technology for exploring, extracting and processing mineral resources. Small-scale mining offers an opportunity to increase income in coastal regions. Extension services and technical assistance should be provided to promote
the activity in a way that is environmentally sustainable.
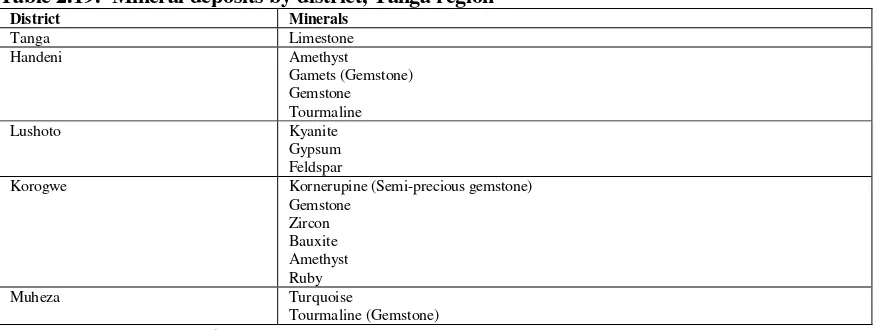
Tanga region. Mining is only small scale, although there is great potential for increasing scale in production. Mineral deposits in the region are shown by districts in table 2.19.
Table 2.19. Mineral deposits by district, Tanga region
District Minerals
Tanga Limestone Handeni Amethyst
Gamets (Gemstone) Gemstone Tourmaline Lushoto Kyanite
Gypsum Feldspar
Korogwe Kornerupine (Semi-precious gemstone) Gemstone
Zircon Bauxite Amethyst Ruby Muheza Turquoise
Tourmaline (Gemstone) Source: Socioeconomic Profile, Tanga region, 1997.
Calcite (in various colors such as white, black, pink and red) is mined in Miono, Mkange and Mandera in Bagamoyo district. The mineral, which is commonly known as “terrazo,” is used for marbles, chicken feed, and in glass making. It is extracted by small-scale miners for sale mainly in Dar es Salaam. Gemstones are mined in Mkange, Mbwewe and Miono in Bagamoyo district. High quality Kaolin (clay) deposits are found in the Pugu hills in Kisarawe district. The Pugu Kaolin Company holds a mining license for the mine and has a factory for processing the raw product.
Mtwara region. Known mineral deposits are shown in Table 2.20. As of 1996, 21 gemstone dealers were licensed to mine in the region, but only 50 percent had extracted and marketed minerals for a total value of Tshs. 113.2 million (Mtwara, Socioeconomic Profile, 1997). The lack of reliable data on deposits has slowed development of this sector.
Table 2.20. Mineral deposits, Mtwara region
District Minerals
Newala Rhodolite, Sapphire, Amethyst and Red Garnets Tandahimba Sapphire, Tourmaline, Red Garnets, Graphite
Masasi Red Garnets, Sapphire, Marble, Chrysoberyl, Alexandrite, Tourmaline and Rhodolite Source: Southern Geological Zone Office, Mtwara, 1997.
Lindi region. Minerals with potential for exploitation are gold in Nachingwea and common salt along the coastline.
2.6
Tourism
Coastal tourism is growing, although much of its potential is under developed. The majority of hotels are located in and near the city of Dar es Salaam (at least 57 hotels). The number of hotel facilities is growing in the coastal regions of Tanga (at least 15 hotels) and Coast. There are few or no hotel facilities for foreign tourists in the Mtwara and Lindi regions. National data on numbers and types of hotels, rooms, and beds is not available.
Tourism offers the potential to boost the coastal economy of Tanzania. Pristine coral
reefs, white sandy beaches, and crystal clear waters are obvious attractions. The coast also possesses other sites of interest such as old trade centers and markets; colonial buildings, forts and ruins; archaeological sites such as Ras Kisimani on Mafia Island; unique natural and geological sites like the Amboni caves; and bird colonies on Latham Island; and coastal game reserves, such as the Selous and Saadani reserves in Tanga region. Major constraints to coastal tourism growth are availability of good transportation, communication, power, and trained service staff. As infrastructure is improved and tourism facilities spread to new areas, careful management of sites will be critical to ensure development that is environmentally and socially sustainable.
A number of hotels were recently constructed in Bagamoyo, both for its scenic beaches and its historic and cultural attributes (the Kaole Ruins and historic colonial buildings of the once national capital). More hotel development is anticipated.
There are camping sites along the Rufiji River, such as at Mbuyu and Stigler’s Gorge, where photography, game viewing, swimming and boating are the attractions. The natural beauty of the beaches and marine environment are attractions of Mafia Island.
Lindi region. Part of the Selous game reserve is in Liwale district in Lindi region. However, poor transportation and communications infrastructure has hindered tourism development.
Mtwara region. There is currently little, if any, tourism in Mtwara region. As in Lindi region, transportation and communications are the principal problems. With an improved road to Mtwara from the capital, the potential for tourism will increase dramatically. The region has two game reserves covering an area of 65,450 ha. These are Msanjesi and Lukwika/Lumesile, both of which are in Masasi district, and contain a variety of wild animals. Msimbati Bay with 125 km. of coastline, Mikindani historical sites, and the famous “ makonde” carvings are other potential tourist attractions.
2.7
Manufacturing and Industry
The coastal regions of Tanzania account for some 75 percent of the county’s
industries which are mainly concentrated in Dar es Salaam and Tanga. In the country as a
whole, the contribution of industry to national GDP in 1994 was 16.7 percent (World Bank, 1996). Major industries in Tanga and Dar es Salaam regions include manufacture of fertilizer, textiles, cement, hardwood floor tiles, sisal rope/twine, steel rollers, plastics, cigarettes, soap and detergents, food processing, soft drinks, and breweries.
Industries located in the Coast region include:
• Tanzania Automobile Assembly Company (TAMCO) in Kibaha district. It assembles trucks, buses and tractors. In 1985 the company assembled 700 trucks per year, but trade liberalization has brought the plant to a near standstill.
• Cashewnut Processing Factory in Kibaha. Disease, low productivity, and falling cashew prices have reduced sales dramatically.
• African Wood, Ltd. in Mkuranga. Manufactures wood flooring for export.
• Two cotton ginneries in Bagamoyo and Rufiji.
• Pugu Kaolin mineral processing factory in Kisarawe district.
There is very little industry in the Lindi and Mtwara regions. In Lindi,
cashewnut-processing plants built by the government have long been closed due to the lack of spare parts, fuel, and low agricultural productivity. There are two oil-processing mills, four saw mills and two backyard soap-manufacturing plants. The poor transportation system within the region is a major reason for limited industrial development. Also, the national electrical power grid does not reach Lindi. The major industries in Mtwara region are also agriculture-based. There are five cashewnut and two sisal processing plants, but they have all performed poorly. The cashewnut plants are now being privatized.
• Selous Basin covers an area of 50,000 km.2. The site is isolated with no major town or roads except for Liwale on the eastern side. The Shell Company has 4,700 km. of seismic data; one well was drilled, but was abandoned in 1995.
• Rufiji Trough covers an area of 16,000 km.2..mostly within the Rufiji River flood plain and delta. The Shell Company has recorded 2,200 km. of seismic data on the site.
• Ruvu Basin covers an area of approximately 18,000 km.2. Some 5,000 km. of seismic data was recorded and five wells were drilled.
• Pemba and Zanzibar Basins cover an area of 2,000 km.2. The BP Company drilled three wells in 1969 and found the first offshore well in the United Republic of Tanzania. About 9,000 km. of seismic data was recorded.
• Songo Songo gas field is to the south of Kilwa district in the Coastal/Mafia Basin. The basin was licensed to Shell in 1991. It is expected that oil drilled from the gas field will contribute significantly to the nation’s economy.
• Mandawa Basin covers an area of 15,000 km.2. Three deep wells drilled by Shell in 1991 prove the existence of mature oil-prone source rocks. Tanganyika Oil Co. is negotiating with potential partners to drill two structures near the Indian Ocean about 270 km. southwest of Dar es Salaam.
3.0
THE INFORMAL SECTOR
In coastal regions, particularly in urban areas, the informal sector, or “second”
economy, is becoming an increasingly substantial component of the economy. Growth of the
informal sector has occurred as the economic structure shifts from a centrally-planned to a market-oriented. The number of people in the informal sector also grew as the economic situation worsened and real wages declined. The informal sector has expanded faster than official GDP, but is not measured by official statistics because of underreporting or non-reporting.
Informal sector activities are characterized by easy establishment; reliance upon indigenous resources both financial and material, family ownership; small-scale operation; labor intensity and dependence on family labor; adopted technology which requires skills that can be acquired outside the formal school system; and unregulated and competitive markets (Omari, 1989; Maliyamkono and Bagachwa, 1990). In Tanzania, the informal sector involves child labor, sometimes to the detriment of their education (Wagner, 1991).
In developing countries worldwide, the informal sector has an important role to play because it provides income-earning opportunities for large numbers of unskilled and otherwise jobless people. The informal sector is particularly important for women because it provides income-earning opportunities while still fulfilling their domestic and child-rearing role. In Tanzania, the informal sector has been important in providing essential commodities and services not provided by the government or any other non-government organization.
4.0
WOMEN’S DEVELOPMENT GROUPS IN COASTAL REGIONS
There is great potential to empower and increase the role of women in the economy
and social development of coastal communities and coastal regions (see EPIQ 1998).
upon the social class they belong to, as well as their education, age, occupation, tribe and religion (Wagner, 1991). Women in the middle and upper income brackets may operate livestock and poultry projects, export/import businesses, quarries, private day care centers, and tutorial classes (a common activity for professional teachers).
There are about 170 women’s economic development groups with a total of 2,073
members in the Coast region (1997 Socioeconomic Profile of the Coast region). These
women’s groups are involved in many different economic activities including vegetable gardens, retail shops of different types, restaurants and guest houses, sales of cooked food (mama Ntilie), embroidery and tailoring, pottery making, raising dairy cattle and poultry, grain milling, fishing, and buying and selling maize.
One-hundred and fourteen of the women’s groups in the Coast region received loans and grants from various institutions, and another 57 groups are running their projects with their own resources. Ninety-six women’s groups received loans from the government valued at a total of Tshs. 21 million under the Women’s Development Fund. The basic objectives of the Women’s Development Fund and other credit schemes are to establish or strengthen women’s groups, provide them with credit and technology, improve their marketing skills, and thus help improve their income earning potential.
Other institutions that provide loans and grants to women’s economic groups in the Coast region include UNDP (Women Appropriate Food Technology project), and the Ford Foundation (Rural Women Initiated Economic Participation project). Both institutions have provided loans or grants to a total of 18 women’s economic groups amounting to over Tshs. 10 million.
In Lindi region, women’s economic activities were funded by the Women’s Development Fund for a total amount of Tshs. 35 million. In Mtwara region there are 459
women’s economic development groups with 6,452 members involved in a variety of income
generating activities including services, production, and trade. Thirty-one women’s groups have obtained loans through the Women’s Development Funds project for a total amount of Tshs. 11 million.
In Tanga region, women’s economic groups are involved in a wide array of activities, including farming, trading, tailoring, livestock husbandry, and food processing. Eighty-two groups with 330 members received loans totaling Tshs. 10 million from the government in 1997 under the Poverty Africa Project.
5.0
BALANCING DEVELOPMENT AND ENVIRONMENTAL
SUSTAINABILITY
The coastal zone is a dynamic area surrounding the interface between land and sea. It encompasses the shoreline environment as well as adjacent coastal and marine waters. The coastal area and its natural resources offer great benefits and opportunities for human use. Most coastal activities in Tanzania rely on the natural resources that the coast offers (fishing, forestry, agriculture, tourism, mining, salt production, mariculture). Therefore, the condition of coastal ecosystems and social well-being are closely linked. A decline in coastal
ecosystem productivity has a direct negative impact on society.
resource base and the very foundation of current and future livelihood opportunities. Coastal stewardship means that pollution, habitat destruction, and overexploitation of resources are kept in check. Without adequate government regulations and oversight, the carrying capacity of complex and fragile coastal ecosystems is soon exceeded resulting in degradation, or even collapse of ecosystem functions.
In general, Tanzania is fortunate in that coastal ecosystems are in relatively good condition as a result of limited economic development and low population density in rural areas. The challenge for the future is to increase coastal development and the well-being of
coastal communities while continuing to protect the natural resource base.
There are already many cases of the impacts of coastal activities on the delicate balance of the coastal ecosystem, and in urban areas, the trade-off between development and
the environment is readily observed. The importance of forest product trade on forest
resource exploitation was already noted in Section 2. Other examples of the impact of coastal activities on ecosystem health include:
• Extensive extraction of sand (for construction) from stream beds draining into the Kunduchi beach area (located approximately 18 km. north of Dar es Salaam) has contributed to beach erosion (Linden and Lundin, 1996).
• All along the coast, coral ecosystems are damaged from dynamite fishing, overfishing, mining of coral rocks for production of lime used in construction, and boat anchoring.
• Marine pollution from urban areas (e.g. Dar es Salaam and Tanga) is a growing problem. Sewage from homes, municipal buildings, and factories, is discharged into the sea untreated. Sewage systems are not abundant in Tanzania, and are limited to cities. In Dar es Salaam only 15 percent of more than two million inhabitants are connected to the sewer system (Linden and Lundin, 1996). Even where sewage systems are present, they are typically in poor condition and leak. Soak-away pit and septic tank systems are used in the city suburbs, where sludge is collected from the pits and taken to dump sites within the city limits. Settling pond systems are used in a few selected sites in the city. During rainy seasons, the pits and septic tanks tend to overflow and discharge into the sea via creeks, streams, and the surface drainage system. This results in the contamination of coastal waters especially in the vicinity of runoff, and in creeks and estuaries where there is little water exchange.
• Untreated wastes from industries on the coast are dumped in the open and leach into the ground or runoff into the sea. The city and region of Dar es Salaam contain about 70 percent of the country’s industry ranging from textiles, food processing, beverages, tanneries, sisal factories, cement factories, and power generation.
6.0
HEALTH AND SOCIAL SERVICES
The improved well-being of coastal inhabitants, as indicated by education, health, sanitation, and social welfare is a major long-term goal of coastal management. This section presents a number of social indicators that demonstrate that the standard for social welfare is low in coastal regions. The findings suggest the need to:
• Develop targeted public education and awareness-building activities
• Promote formation of women’s groups and community groups to increase public health awareness, share best methods for coping with difficult situations, and identify actions to resolve problems and improve conditions
• Provide technical assistance to selected villages to enhance effectiveness of Village Water Committees
• Increase household income and local revenues to improve standard of living
• Support social programs through enhanced performance of current livelihood activities and support alternative livelihood options.
6.1
Health
Health and health carein Tanzania’s coastal regions are hindered by a number of
problems relating to the low level of development. These include poor communications, unsafe water supplies, poverty, traditional belief systems, lack of education, poorly run
health services, and malnutrition. The majority of people along the coast are exposed to
environmental and nutritional related health problems. Water borne diseases such as malaria, cholera, and diarrhea are prevalent. Measles, pertussis, diphtheria, tetanus, and polio are serious heath problems among children. Malnutrition is also a common problem that exacerbates the risks from these diseases. Other health problems of significant importance are AIDS, upper respiratory tract infections, tuberculosis and leprosy. Table 6.1 shows the frequency of these and other communicable diseases for the Coast region.
Table 6.1. Top ten diseases by number of cases, Coast region
1991 1993 1995
Type of Disease
Cases % Cases % Cases %
Malaria 414,809 42.9 390,194 51.6 122,620 46.8 URTI 110,672 11.5 74,512 9.9 34,434 13.2 Diarrhea 101,486 10.5 75,890 10 25,324 9.7 Anemia 67,717 7 67,568 8.9 18,208 7 Skin Diseases 72,405 7.5 39,900 5.3 15,646 6 Helminthes 57,288 5.9 40,226 5.4 16,436 6.3 Eye Diseases 63,580 6.6 24,966 3.3 17,278 6.6 Pneumonias 37,845 3.9 19,481 2.6 11,469 4.4 Venereal Diseases 25,256 2.6 9,360 1.2 - -Malnutrition 15,256 1.6 13,858 1.8 - -Total 966,314 100 755,955 100 261,415 100 Source: Regional Medical Office, Kibaha, 1997.
Health facilities for coastal regions are shown in table 6.2.
Table 6.2. Number of health facilities by region, 1996
Hospitals Health Centers Dispensaries Region
Public Private Public Private Public Private
Tanga 6 7 17 248 --Mtwara 3 1 12 2 108 18 Coast 5 1 13 1 105 35 Dar es Salaam -- -- -- -- -- --Lindi 4 3 12 0 106 14 Source: Adapted from Health Statistics Abstract, 1997.
The distribution of health facilities relative to population is shown in Table 6.3.
Table 6.3 Hospitals and dispensaries per capita by region, 1996 Region 1996 Population
(est.)
Number of Hospitals
Hospitals per capita
Number of Dispensaries
Dispensaries per capita
Dar es Salaam -- -- -- -- --Mtwara 1,005,405 4 251,351 126 7,979 Source: Adapted from Regional Socioeconomic Profiles, 1997.
The population per hospital bed (681) for Mtwara is the third best in the nation after Ruvuma (604) and Kilimanjaro (680). The national average is 981. The worst-served region is Shinyanga with 1,448 per hospital bed.
The life expectancy for Tanzania in 1988 was age 48 for males and age 51 for females. Life expectancy for coastal and other regions is shown in Table 6.4.
Table 6.4. Life expectancy at birth by region, 1978 and 1988 census
1978 Census 1988 Census
Region
Male Female Male Female
Arusha 50 57 57 58 Coast 47 48 46 51 Dar es Salaam 50 50 50 50 Dodoma 45 46 45 47 Iringa 41 45 44 47 Kagera 45 45 44 45 Kigoma 40 48 47 49 Kilimanjaro 58 59 57 62 Lindi 42 47 46 48 Mara 44 47 46 48 Mbeya 41 47 45 48 Morogoro 44 46 45 48 Mtwara 40 46 45 48 Mwanza 44 48 46 50 Rukwa 40 45 44 48 Ruvuma 43 49 48 51 Shinyanga 42 50 48 51 Singida 44 55 54 55 Tabora 44 53 53 54 Tanga 44 49 48 51 Average for Tanzania 45 49 48 51 Source: Health Statistics Abstract, 1994.
The infant mortality rate and under age five mortality rate are common indicators for the success of health programs. Health Statistics Abstract 1997 shows that Mtwara and Lindi regions have the highest infant mortality rate and under five mortality rate among all the
regions of the country (Table 6.5). Although the infant mortality rate and under five mortality
rate numbers are better today than they were in 1975, they are still high. In Lindi region, for example, nearly 22 percent of children born today will not reach the age of five.
Table 6.5. Infant mortality rate and under five mortality rate by region (per 1,000) Infant Mortality Rate Under Five Infant Mortality Rate Region
1975 1985 1995 (est.) 1975 1985 1995 (est.)
Tabora 140 101 73 236 166 116 Tanga 112 106 100 187 176 166 Source: Health Statistics Abstract, 1997.
Table 6.6 shows that rural areas have considerably higher infant mortality rate and
under five mortality rates than urban areas.
Table 6.6. Urban and rural infant mortality rate and under five mortality rate by coastal region, 1988
Infant Mortality Rate Under Five Mortality Rate Region
Rural Urban Rural Urban
Mtwara 143 108 241 180 Lindi 143 121 241 204 Coast 115 104 193 172 Dar es Salaam 121 103 203 169 Tanga 109 89 182 144 Source: Population Census, 1988.
6.2
Sanitation
The availability of toilet facilities is an important aspect in health and environmental sanitation. Table 6.7 shows the distribution of toilet facilities in private households. The table shows that pit latrines are most common, access to flush toilets is much higher in urban than in rural areas, and the percentage of households without any toilet facilities is high in rural coastal regions (15-23 percent depending on the region). Particularly in coastal communities, there is a high percentage of households without any toilet facilities.
Table 6.7. Type of toilet facility by region (percentage of households, 1988 census)
Rural Urban
Region
Flush Pit Latrine None Flush Pit Latrines None
Dodoma 0.6 81.0 18.2 16.5 78.6 4.2 Arusha 1.2 65.9 32.8 18.4 79.5 2.0 Kilimanjaro 2.7 92.5 4.5 24.4 71.3 4.3 Tanga 0.8 80.8 18.3 16.2 79.2 4.5 Morogoro 1.3 88.6 9.5 12.7 84.8 2.5 Coast 0.9 76.1 23.0 4.8 88.3 6.7 Dar es Salaam 3.8 80.9 15.2 15.9 83.1 1.0 Lindi 0.6 77.2 22.2 4.7 85.0 10.3 Mtwara 1.0 84.2 14.8 7.4 86.1 6.6 Ruvuma 1.3 95.4 3.2 4.0 94.7 1.3 Iringa 0.9 97.1 2.0 4.0 94.9 1.1 Mbeya 1.4 94.3 4.4 6.1 91.8 2.1 Tabora 0.7 91.9 7.4 9.1 89.5 1.5 Rukwa 0.5 73.2 26.3 4.2 92.4 3.4 Kagera 0.5 86.6 12.9 13.0 81.4 5.7 Singida 0.9 78.6 20.5 7.0 87.6 5.5 Kigoma 0.7 94.1 5.2 5.3 91.9 2.8 Shinyanga 1.0 84.3 14.7 16.1 79.4 4.6 Mwanza 0.6 86.9 12.4 11.9 80.7 7.3 Mara 0.8 76.0 23.2 9.0 85.0 6.0 Source: Population Census, 1988.
6.3
Nutrition
The percentage of children underweight is another indicator of poverty and is related to school enrollment and education. The national average of children underweight (below 80 percent of normal weight) is nine percent. The average in coastal regions varies from 3 percent (Dar es Salaam) to 22 percent (Mtwara). Lindi, Mtwara and Coast are among the regions
Table 6.8. Nutrition status of children by region, 1995
Children Undernutrition Weight (as percent of normal)
Region Number weighed
<60% 60-80%
Total Percent Underweight
Lindi 22,779 868 1,932 2,800 12 Arusha 68,418 709 2,845 3,554 5 Dar es Salaam 50,370 435 1,206 1,641 3 Dodoma 52,957 500 1,686 2,186 4 Iringa 45,459 847 8,083 8,930 20 Kagera 60,417 1,002 4,606 5,608 9 Kigoma 42,408 1,392 5,227 6,619 16 Kilimanjaro 42,903 211 968 1,179 3 Mbeya 84,231 1,528 10,062 11,590 14 Mara 45,944 651 1,918 2,569 6 Morogoro 51,329 1,045 3,215 4,260 8 Mtwara 23,127 850 4,138 4,988 22 Mwanza 89,166 1,416 4,648 6,064 7 Coast 22,934 734 2,607 3,341 15 Rukwa 33,454 876 3,611 4,487 13 Ruvuma 26,630 646 2,599 3,245 12 Shinyanga 74,715 559 2,244 2,803 4 Singida 31,254 376 1,276 1,652 5 Tabora 45,648 431 1,734 2,165 5 Tanga 54,006 701 2,060 2,761 5 Total 968,149 15,777 66,665 82,442 9 Source: Health Statistics Abstract, 1997.
6.4
Education
In Tanzania, school enrollment rates are low compared to other sub-Saharan
countries. The gross primary school enrollment rate is 69 percent (World Bank, 1996). This
compares with 95 percent in Kenya and 71 percent in Uganda. For poor families, primary education (of girls in particular) is not a top priority in the short run. Secondary school enrollment is 5-7 percent, compared to 29 percent in Kenya and 13 percent in Uganda (World Bank, 1996). A sustained improvement will require a re-allocation of government
expenditures to support social sector objectives. Tanzania devotes about 15 percent of its
recurrent budget to education, which is low relative to neighboring countries. Spending on social programs is not keeping up with growth in the economy, and is falling as a percentage of GDP.
In contrast, Tanzania is performing relatively well in terms of illiteracy rate when
compared with other sub-Saharan African countries. The adult illiteracy rate is 23 percent of
the population.
The number of secondary schools in Mtwara, Coast, Lindi and Tanga regions is shown in Table 6.9.
Table 6.9. Number of secondary schools by region
Region Public Private Total
6.5
Water Supply
Water supply and access to clean water varies by coastal region. In Mtwara and Lindi regions, 87 and 61 percent, respectively, of the villages are supplied with clean water. In Tanga, about 48 and 90 percent of the rural and urban population, respectively, are supplied with clean water. Relative to the country as a whole, water access is good in coastal regions. On average in Tanzania, only about 22 percent of the people in rural areas have access to safe water. During the dry season, drinking water problems are worse—it takes more time and effort to obtain water and disease problems are much more severe.
In Mtwara, the main sources of water are the Ruvuma, Mbuo, Mambi and Mbangala Rivers; Lakes Kitere and Chidya; and groundwater and rainwater. With respect to urban water supply systems, Masasi has four main sources of water: Mchema dam, five deep wells at Magumchila, 50 shallow wells dug within the town area, and the water catchment from Mwena and Mwili springs. A variety of sources also supply Mtwara and Mikindani townships. There are seven deep wells in Mtawanya valley, two deep wells within the Mikindani area, and a spring at Mchuchu. Newala town is served by the extensive Makonde plateau piped water system that relies on electricity.
Groundwater is the largest water supply source in the Lindi region. It is plentiful and accessible from shallow wells. Shallow wells served by water pumps are common in the villages. Because they are not open as the discharge is made through pumping, the wells are not exposed to the risks of infestation and contamination. In 1996, about 50 percent of the region’s population obtained their water needs from piped water. There are also numerous rivers and dams that can provide surface water.
The Tanga region has abundant water sources from underground and surface sources. Surface water supplies include the Pangani, Ruvu, Soni, Mkulumuzi and Sigi rivers. In 1995 the region had 85 water supply schemes (gravity and pump), 475 shallow wells fitted with hand pumps, 19 deep wells, and 11 dams.
About 26 percent of the population of the Coast region get their water supplies from the Wami, Rufiji and Ruvu rivers. Other sources of water are deep and shallow wells, natural and man-made water dams, piped water, and rainwater h