ADSORPTION OF GIBBERELLIC ACID (GA
3) ONTO ACID ACTIVATED KAOLIN
Sunardi1,*, Yateman Arryanto2, and Sutarno2
1Department of Chemistry, Faculty of Mathematics and Natural Sciences, Lambung Mangkurat University,
Jl. A. Yani Km. 35,8 Banjarbaru 70714
2Department of Chemistry, Faculty of Mathematics and Natural Sciences, Universitas Gadjah Mada,
Sekip Utara, Jalan Kaliurang, Yogyakarta 55281
Received February 22, 2010; Accepted July 27, 2010
ABSTRACT
Preparation, activation and adsorption study of natural kaolin from Tatakan, Tapin, South Kalimantan have been conducted. The activation of kaolin was done using 6 M HCl solutions at 90 °C for 3 h. The characterizations of kaolin were carried out by Fourier Transform Infrared, X-ray diffraction, and surface area analyzer. Adsorption parameters studied included the effect of pH, contact time, and concentration of gibberellic acid (GA3) onto kaolin samples. The amount of gibberellic acid adsorbed was determined using UV spectrophotometer. The adsorption capacity of kaolin was determined by Langmuir adsorption isotherm model. The result showed that activation of kaolin was resulted the larger specific surface area and more homogeneous composition of kaolin without any destruction of kaolin structure. Adsorption of gibberellic acid onto kaolin before and after activation showed that optimal adsorption was obtained at pH ≈ 7 and reached the equilibrium within 4 h. The calculations result by Langmuir adsorption isotherm model showed that the increasing of adsorption capacity of acid activated kaolin is about 35%.
Keywords: kaolin, acid activated, gibberellic acid
INTRODUCTION
Immobilization techniques of chemical substances such as proteins, enzymes, fertilizer, pesticide, hormones and other organic molecules has been developed in wide areas of industry producing medicine, food, health and agricultural products [1]. Some materials have been proven to be promising as carrier materials for immobilization of organic molecules, as these materials are able to enhance the mechanic and thermal stability of the molecules being carried. There are also some findings showing that these materials enhance the resistance of molecules towards attacks from microorganism and organic solvents [2]. Bindings of bioactive species on inorganic substances as their supportive materials also offer some advances as they enhance the safety of users and untargeted organism. Moreover, this method can also be alternatives to reduce environmental problems [3].
Applications of clay materials and modified clay as carrier material are done on the basis of some advantageous properties of them. Clay owns a relatively wide surface area, a high adsorption capacity, favorable rheology properties, high stability which is followed with a low toxicity [4]. Interactions between clay and organic molecules are dependent on properties and type of the clays. In addition, the interactions will also be influenced by characteristics of the adsorbate, which include size,
shape, solubility and hydrophobicity of the adsorbate. Kaolin is a natural material which is relatively inexpensive and has shown good potency as carrier material. This is due to its high adsorption capacity, accompanied with its ability to easily desorb the adsorbates attached on its surface [5].
Recently, to enhance the capacity of clay minerals, either to adsorb or immobilize organic molecules, researchers have tried to improve the properties of clay by chemical methods in order to adjust it with the adsorbate properties. Acid activation with inorganic acids has been widely studied as a chemical treatment for the improvement of the surface. This process causes disaggregation of clay particles, eliminates of mineral impurities, and dissolves of the external layers, thus altering the chemical composition and the structure of the clays and increasing the surface area and porosity [6].
Gibberellic Acid (C19H22O6) or 2,4a,7-trihydroxy-1
methyl-8-methylenegibb-3-ene-1,10-dicarboxylic acid (Fig. 1) is one of the most attractive plant growth regulators hormone (PGR) that regulates the growth of plants, including triggering seed germination [7]. The objective of this study was to characterize the product of acid activated kaolin from Tatakan, South Kalimantan, Indonesia and to evaluate their adsorptive potential as a carrier material of gibberellic acid.
* Corresponding author. Tel/Fax : +62-511-4772428 Email address : [email protected]
Sunardi et al.
EXPERIMENTAL SECTION
Materials
Material used in this study is natural kaolin obtained from Tatakan, Tapin, at the province of South Kalimantan, Indonesia. The chemical reagents used are NaOH (Merck), HCl 37% (Merck), Gibberellic Acid (Merck) and ethanol (Merck).
Instrumentation
Instruments used in this study are FTIR Spectrophotometer Shimadzu Prestige-21, X-Ray Diffractometer Shimadzu XRD-6000, UV-Visible Spectrophotometer Shimadzu Model 1661, and Surface area analyzer (Quantachrome).
Procedure
Kaolin Preparation
Kaolin sample from Tatakan, South Kalimantan was oven-dried at 80 °C for 24 h. The dried kaolin was pulverized by using mortar and sieved through 200-mesh sieve. The purification method was carried out through sedimentation following previous research. The purified kaolin consists of 73.03% kaolinite, 22.6% halloysite, 0.77% chlorite, 1.37% quartz and 2.23% christobalite [8]. Purified kaolin was then redried at 100 °C for overnight.
Acid Activation
Acid activation was carried out with reflux technique of 5.0 g of the kaolin that was mixed with 60 mL of the acid solutions at 90 °C and stirred for 3 h. The suspensions were decanted and the solids were washed with distilled water until no chloride anion detected with AgNO3. Acid activated kaolin was then
dried at 100 °C for overnight and was characterized by X-ray diffraction (XRD), Fourier Transform Infrared Spectroscopy (FTIR), and specific surface area was determined by BET methods.
Adsorption of Gibberellic Acid
As much as 0.5 g of activated kaolin was used to adsorb 25 mL of known concentration of gibberellic acid solution. The adsorption process was carried out at ambient temperature in a batch system by using rotary shaker. The effect of pH on gibberellic acid adsorption was studied in different pH (varying from 4.0 to 12.0) with an initial gibberellic acid concentration of 300 mg/L. The effect of contact time on gibberellic acid adsorption was studied in different contact time (varying from 1 to 24 h) for an initial gibberellic acid concentration of 300 mg/L. The gibberellic acid solution was then
separated from adsorbent by centrifugation at 10.000 rpm for 15 min. The amount of gibberellic acid that was not absorbed by the adsorbent was determined spectrophotometrically using UV spectrophotometer at λ = 254 nm (Shimadzu Model 1661) [7] and the adsorption capacity was determined through Langmuir approach for isotherm adsorption.
The amount of gibberellic acid adsorbed per unit weight of kaolin, q (mg/g) was obtained by calculating the difference using the formula:
(Ci C Ve) q
m
−
= (1)
Ci is the initial gibberellic acid concentration (mg/L), Ce is the concentration of gibberellic acid after adsorption process (mg/L), V is the volume of solution (L) and m is the mass of kaolin (g). In order to study the adsorption isotherm, 0.5 g of activated kaolin was used to adsorb 25 mL gibberellic acid of different concentration (100, 150, 200, 250 and 300 mg/L) at pH 7 for 4 h (to get confirm that the equilibrium has been reached).
Langmuir equation for isotherm adsorption can be mathematically written as follows:
1
The equation can be rewritten as a linear equation as follow:
1 1 1 1
e m L m
q = q +K q Ce
(3)
qm (adsorption capacity) represent the maximum
amount of adsorbate that can be binded by the adsorbent’s surface (mg/g), while KL stands for
Langmuir constants (L/mg or mL/mg), qe represents the
amount of adsorbate being adsorbed when adsorption process has reached its equilibrium, while Ce is the
concentration of the solution at the point of adsorption equilibrium.
The value of KL and qm can be determined by
drawing a graph of 1/Ce versus 1/qe.
According to Hall et al. [9], the appropriateness of this Langmuir isotherm pattern can be represented by using RL at the parameter of equilibrium which is an
undimensional separation factor, mathematically written as:
Basically, the value of RL can be classified into four
categories that indicate the pattern of isotherm adsorption that occurred. When the value of RL > 1, the
type of adsorption is not appropriate. While the value of RL = 1 indicates that it is a linear type, 0 < RL < 1
indicates that it is an appropriate type of isotherm,
while RL = 0 means the adsorption process is
Sunardi et al.
Fig 1. Molecular structure of gibberellic acid
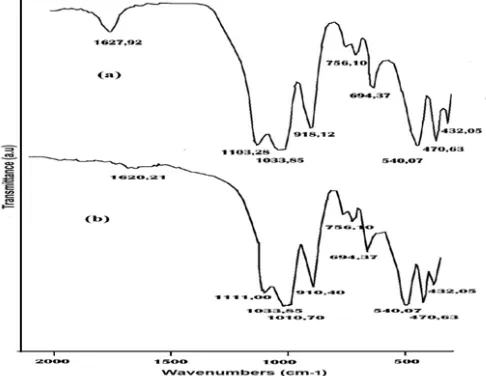
Fig 2. FTIR spectroscopy spectra of acid activated
kaolin (a) and untreated kaolin (b)
Fig 3. X-ray diffraction patterns spectra of acid activated
kaolin (a) and untreated kaolin (b)
RESULT AND DISCUSSION
Effect of Acid Activation
Activation of natural kaolin using inorganic acid is intended to improve the surface characteristics of natural kaolin in interacting with the adsorbate. FTIR and XRD analysis were used to verify the result of activation of kaolin using inorganic acid. FTIR spectral patterns of natural kaolin samples before and after activation using
6 M HCl acid at a temperature of 90 °C for 3 h of as shown by Fig. 2 did not show significant changes between the kaolin before and after treatment with acid, which indicates there is no significant changes of the samples of kaolin. Slight shift occurred in the absorption spectra at wave numbers around 900 cm-1 which is a bending vibration of the Al – OH. In this case, the pattern of infrared absorption spectra which still shows a fairly sharp absorption peak at wave numbers around 900 cm-1 for both of samples showed that, there is no change takes place in the composition of octahedral Al atoms caused by acid activation [10]
The Si-O-Si stretching band appeared at 1010-1111 cm-1 for both of samples, a position characteristic of this vibration for silica. The presence of absorption at wave numbers 1033 cm-1 which still appear after acid activation is the Si-O stretching vibrations specific for the structure of kaolin [11] shows the resistance of the kaolin structure against acid attack as reported by Jozefaciuk [12] compared to other types of clay minerals. The resistance was due to the kaolin structure, which cannot swelling (non-swelling clay). Thus, acid attacks can only occur through the surface only, and does not occur in between silicate layers through the side-edge kaolin. This is consistent with the observation by Komadel et al. [13] that non-swelling phyllosilicate layer were more resistant to acid attack than swelling layers because in the swelling clays occurred the initial exchange of H+ for Na and Ca in the interlayer and further dissolution of the minerals.
Increased intensity of absorption at wave numbers around 1600 cm-1 which is a bending vibration absorption of H-O-H from water adsorbed shows the increasing ability of natural kaolin after acid activation in binding water molecules. This is an early indication of changes in surface properties of natural kaolin using acid treatment that can be associated with increased adsorption capacity of kaolin. Acid activation is also able to increase the amount of protonated species on the surface of kaolin as a result of replacing balancing cations by H+ ions that can serve as sites binding water molecules.
Sunardi et al.
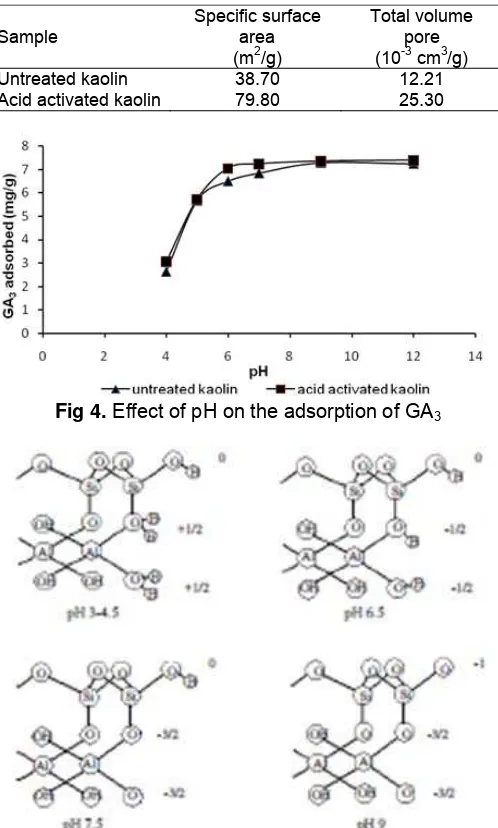
Table 1. Specific surface area and total volume pore of
kaolin
Sample
Specific surface area (m2/g)
Total volume pore (10-3 cm3/g) Untreated kaolin
Acid activated kaolin
38.70 79.80
12.21 25.30
Fig 4. Effect of pH on the adsorption of GA3
Fig 5. Effects of pH on the charge of the kaolinite edge [30]
this case, the kaolinite has a type of crystal with a fairly good similarity the form of hexagonal layers with a size of 1-10 μm, while halloysite has a smaller unit cell with a size of 0.01-1 μm, with a relatively various form of spherical or irregular shapes [17].
The results of analysis of specific surface area and total pore volume of the kaolin before and after acid activation (Table 1) shows that the acid activation process with a concentration of 6 M acid at temperature of 90 °C has been able to increase the specific surface area and total pore volume significantly. The increase of surface area and total pore volume according to Belver et al. [6] and Mahmoed et al. [18] presumably because of the disaggregation/separation of kaolin particles.
Adsorption of gibberellic acid (GA3)
The test of adsorption of gibberellic acid began with the study of the effect of pH on the adsorption ability and determination of optimum adsorption equilibrium time. Further discussion, includes the determination of adsorption capacity of kaolin before activation and kaolin after acid activation.
Effect of pH
Determination of the optimum pH for adsorption system is an important parameter in controlling the adsorption process, since the pH of the solution in the adsorption process can affect (i) the surface charge of adsorbent, (ii) the degree of ionization of the adsorbate
molecule and (iii) the extend of dissociation of
functional groups on the active site of the adsorbent [19]. To determine the effect of pH on kaolin adsorption of GA3, pH variation was set in a range of pH 4.0 to 12.
Adsorption was done in a batch system with initial concentration of 300 ppm, and contact time of 24 h. Results of the study on effect of pH at the adsorption of kaolin towards GA3 is shown in Fig. 4. From the figure,
it can be observed that the adsorption of kaolin before and after acid activation showed a similar adsorption pattern. The adsorption ability of the adsorbents (untreated and acid activated kaolin) in acidic conditions (pH 4-6) increased sharply and in alkaline conditions (pH 8-12) kaolin adsorption ability is relatively constant. Similar results were demonstrated by several researchers who studied kaolin adsorption of various organic molecules, such as dyes crystal violet and Brilliant Green [19-20], Congo red [21-22] and proteins of Bacillus thuringiensis [23]. According to Ozcan et al. [24], optimum pH in the process of adsorption using adsorbent kaolin can be explained that directly affect the pH of the adsorbent surface charge of kaolin and also the degree of ionization of the adsorptive molecule.
Sunardi et al.
Effect of contact time
The contact time of adsorption of GA3 onto kaolin
is related with how long it takes for GA3 in order to be
absorbed by the kaolin optimally. To investigate the effect of contact time, the study was carried out by varying the adsorption time of 1, 2, 4, 6 and 24 h with a concentration of 300 ppm and at pH 7.0 which is assumed as an optimum pH of adsorption process. From Figure 6 it can be observed that the adsorption pattern of GA3 on the kaolin before and after acid
activation on some variation tends to be same, where the adsorption equilibrium time was achieved in approximately four hours. Before the equilibrium time is reached, the pattern of uptake showed a relatively high increase and then tends to be constant after reaching equilibrium. These results are in accordance with the results of the study of Zhou et al. [23] which shows the equilibrium time for adsorption of organic molecules on kaolin is reached in about four hours.
Fig 6. Effect of contact time on the adsorption of GA3
The mechanism of adsorption of GA3 onto kaolin
is due to physical adsorption: hydrogen bonding and van der Waals forces (depending on the particle size) and the presence of electrostatic interactions (depending on the pH used). Kaolin minerals do not exhibit a strong affinity for nonionic molecules. However, the adsorption equilibrium for GA3 is much
slower than ion-exchange processes. In this case, the equilibrium is achieved in a relatively long time (above 2 h) due to a large size of the GA3 molecule, so it takes
a long time to achieve stability to be bonded on the surface of kaolin
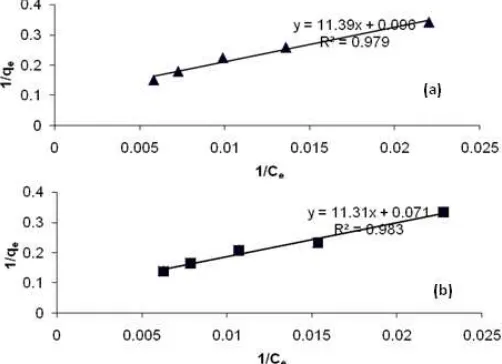
Fig 7. The Langmuir adsorption isotherm for adsorption of
GA3 on untreated kaolin (a) and acid activated kaolin (b) From Fig. 6 it can be seen that there is an
increase in adsorption capacity of kaolin after acid activation compared to before the activation. The adsorption capacity of each type of kaolin was quantitatively determined by using Langmuir adsorption isotherm.
with GA3. In alkaline conditions (pH > 9), the surface of
kaolin becomes more negatively charged on both of the surface silicate and the edge-side of kaolin (Fig. 5).
In the solution system, GA3 has pKa = 3.8; at lower
pH the molecule mainly occurs in the undissociated form, whereas at higher pH it is in the anionic form. As the pH increased to more than 8, the edge charges turned negative and did not favor the adsorption of anionic form of GA3 at pH > 8. This can be attribute to
ionic repulsion between the kaolin surface and the anionic GA3 molecules. Also, an abundance of OH
-
ions in basic solution creates a competitive environment with anionic ion of GA3 for the adsorption sites causing a
decrease of adsorption. Despite being more disaggregated (greater surface area), on the other side there will be greater repulsions between the negative charge on the surface of kaolin with GA3 molecules,
which in alkaline conditions begin to dissociate and produces O- and COO-, therefore, the adsorption ability does not tend to increase.
Adsorption capacity
Table 2. Langmuir isotherm constant for the adsorption of GA3 on kaolin
Adsorbent Langmuir constant
KL(ml/mg) qm (mg/g) R2 RL
Untreated kaolin 8.45 10.38 0.98 0.39
Acid activated kaolin 6.35 13.91 0.98 0.46
affinity for adsorpting and form a single layer (monolayer) [19-20].
To assess the influence of acid activation on adsorption capacity of kaolin adsorption process, the study is carried out with various concentration of 100 ppm to 300 ppm at pH 7 and a contact time of 4 h in accordance with the results obtained previously. Based on the obtained data, the graphs of Langmuir adsorption patterns for kaolin before and after acid activation is shown in Fig. 7. From the graph in Fig. 7, it can be concluded that the adsorption pattern of kaolin before and after acid activation patterns tend to follow the Langmuir adsorption isotherm as indicated by r2≈0.98, so the adsorption capacity values (qm) of the adsorbents
can be determined directly by using the Langmuir isotherm. The suitability Langmuir adsorption isotherm pattern is also supported by the constant value of separation factor or equilibrium parameter (RL), GA3
adsorption on kaolin was favorable as RL < 1 (Table 2).
Based on data in Table 2, the acid activation of kaolin with 6M HCl at 90 °C temperatures for 3 h proved to increase the adsorption of kaolin from 10.38 mg/g to 13.91 mg/g for GA3. It is in accordance with the results of
research from Komadel [28] and Bhattacharyya and Gupta [29], indicating that the activation process using the acid at high temperatures can dissolve the impurities of the clay, increase the surface area and the amount of acid sites having an effect in increasing the adsorption capacity of clay.
CONCLUSION
Acid activation on natural kaolin from Tatakan, South Kalimantan, Indonesia using 6M HCl at a temperature of 90 °C for 3 h is able to increase surface area and to increase the homogeneity of the kaolin minerals without damaging the structure of kaolin. Acid treatment can improve the adsorption capacity of natural kaolin about 35% for gibberellic acid.
ACKNOWLEDGEMENT
A deep gratitude and appreciation for the Directorate General of Higher Education, Ministry of Education of Indonesia, which has provided scholarships BPPS S2 in the Department of Chemistry, Faculty of Mathematics and Natural Sciences, Universitas Gadjah Mada in 2007/2008.
REFERENCES
1. Liang, J.F., Li, Y.T., and Yang, V.C., 2000, J. Pharm. Sci., 89, 8, 979–990.
2. Park, S.W., Kim, Y.I., Chung, K.H., Hong, S.I., and Kim, S.W., 2002, React. Funct. Polym., 5, 79–92. 3. Qiu, D., and Hou, W., 2009, Colloids Surf., A, 336,
12–17.
4. Carretero, M.I., 2002, Appl. Clay Sci., 21, 3-4, 155–163.
5. Rahman, M.B., Tajudin, S.M., Hussein, M.Z., Rahman, R.N.Z.R.A., Salleh, A.B., and Basri, M., 2005, Appl. Clay Sci., 29, 2, 111–116.
6. Belver, C., Muoz, M.A.B., and Vicente, M.A., 2002, Chem. Mater., 14, 2033–2043.
7. Ergun, N., Topcuoglu, S.F., and Yildiz, A., 2002, Turk. J. Bot., 26, 13–18.
8. Sunardi, Arryanto, Y., and Sutarno, 2009, Indo. J. Chem., 9, 3, 373–379.
9. Hall, K.R., Eagleton, L.C., Acrivos, A., and Vermeulen, T., 1966, Ind. Eng. Chem. Fundam., 5, 212–223.
10. Falaras, P., Kovanis, I., Lezou, F., and Seigara, G., 1999, Clay Miner., 34, 221–232.
11. Ekosse, G.E., 2005, J. Appl. Sci. Environ.
Manage., 9, 2, 43–48.
12. Jozefaciuk, G., 2002, Clays Clay Miner., 50, 647– 656.
13. Komadel, P., Bujdak, J., Madejova, J., Sucha, V., and Elsas, F., 1996, Clay Miner., 31, 333–345. 14. Saikia, N.J., Bharali, D.J., Sengupta, P., Bordoloi,
D., Goswamee, R.L., Saikia, P.C., and Borthakur., 2003, Appl. Clay Sci., 24, 93–103.
15. Tan, K.H., 1982, Dasar-dasar Kimia Tanah.
Penerjemah Goenadi, D.H., cet. 5, Universitas Gadjah Mada Press, Yogyakarta.
16. Hradil, D., Hostomsky, J., and Soukupova, J., 2002, Geologica Carphica, 53, 117–121.
17. Lee, S.Y., and Kim, S.J., 2002, Appl. Clay Sci., 22, 55–63.
18. Mahmoud, S., Hammoudeh, A., and Al Naomi, M., 2003, Clays Clay Miner., 51, 52–57.
19. Nandi, B.K., Goswami, A., and Purkait, M.K., 2009, Appl. Clay Sci., 42, 583–590.
20. Nandi, B.K., Goswami, A., and Purkait, M.K., 2009, J. Hazard. Mater., 161, 387–395.
21. Vimonses, V., Lei, S., Jin, B., Chow, C.W.K., and Saint, C., 2009, Appl. Clay Sci., 43, 465–472.
Sunardi et al.
22. Vimonses, V., Lei, S., Jin, B., Chow, C.W.K., and Saint, C., 2009, Chem. Eng. J., 148, 354–364. 23. Zhou, X., Huang, Q., Chen, S., and Yu, Z., 2005,
Appl. Clay Sci., 30, 87–93.
24. Ozcan, A.S., Erdem, B., and Özcan, A., 2005, Colloids Surf., A, 266, 73–81.
25. Goodwin, J.W., 2004, Colloids and Interfaces with Surfactant and Polymer-An Introduction, John Wiley & Son, Ltd., Sussex, England.
26. Lopez, Y.M.C., 2005., FTIR Microscopy of RDX interaction with clay mineral, Thesis, University of Puerto Rico, Mayagues.
27. Emmanuel, U., Kayode, O.A., and Folasegun, A.D., 2008, J. Hazard. Mater., 157, 397–409. 28. Komandel, P., 2003, Clay Miner., 38, 127–138. 29. Bhattacharyya, K.G., and Gupta, S.S., 2008, Adv.