*Author to whom all correspondence should be addressed. E-mail: [email protected].
Adsorption of Acid Blue 129 from Aqueous Solutions onto Raw and
Surfactant-modified Bentonite: Application of Temperature-dependent
Forms of Adsorption Isotherms
Yesi1,2, Fiona Patricia Sisnandy1,2, Yi-Hsu Ju1, Felycia Edi Soetaredjo2 and Suryadi
Ismadji2* (1) Department of Chemical Engineering, National Taiwan University of Science and Technology, 43, sec. 4 Keelung Rd., Taipei, 106 Taiwan. (2) Department of Chemical Engineering, Widya Mandala Surabaya Catholic University, Kalijudan 37, Surabaya 60114, Indonesia.
(Received 25 September 2010; revised form accepted 15 December 2010)
ABSTRACT:Modification of raw bentonite from Ponorogo, East Java, Indonesia by microwave irradiation using cetyltrimethylammonium bromide (CTAB) was studied. The adsorption capabilities of raw bentonite and its modified form were examined through their use in the removal of Acid Blue 129 from aqueous solution. The adsorption isotherm and kinetic experiments were conducted at four temperatures (25, 30, 40 and 50 ºC). The fitting of the corresponding experimental data was tested using the temperature-dependent forms of the Langmuir, Freundlich, Sips and Toth equations. The Sips equation gave a better representation of the adsorption data, together with reasonable values of the fitted parameters. Two well-known kinetic models, the pseudo-first- and pseudo-second-order, were used to correlate the adsorption kinetic data, with the pseudo-first-order model giving the better results. Both physical and chemical adsorption mechanisms occurred during the adsorption process, with the main controlling mechanism being physical adsorption.
INTRODUCTION
Thousands of synthetic dyes have been produced for various kinds of purposes. These synthetic dyes are available in a vast range of colours and they possess better properties than natural dyes. Most synthetic dyes are synthesized from benzene and its derivatives. Some synthetic dyes are quite safe, but some are extremely toxic (carcinogenic) to the environment. Synthetic dyes are widely used to colour fabrics, and in every fabric-dyeing process a solution of dye in water is used into which the fabrics are dipped and then washed. Most countries have regulations that require fabric factories to treat dye effluent before it is discharged into the water system. However, for small factories such as home industries which are widely found in Indonesia and other developing countries, building facilities to treat dye-containing wastewater would be very expensive, and the easiest and cheapest way to handle dye effluents in their cases is to dump them into a river.
efficiency, high adsorption capacity and applicability in a large-scale operation (Aksu et al. 2008; Ziólkowska et al. 2009; Guiza et al.2004; Paula et al.2009).
Bentonite is widely used in many fields of material science technology (Zhou 2010) and the utilization of this clay material for the treatment of wastewater containing dyes is receiving increasing attention, since it offers a very attractive method for pollution remediation. In addition, bentonite is plentiful, inexpensive and available in many countries. Indonesia has a huge bentonite reserve located in several provinces. However, studies regarding the utilization of bentonite originating from Indonesia for the treatment of dye effluents are still very scarce. In the present study, raw bentonite from Ponorogo (East Java, Indonesia) was used as the raw material for organobentonite preparation. A cationic surfactant, cetyltrimethylammonium bromide (CTAB), was employed as the modifying agent.
The relevant equilibrium adsorption data provide the most important information for understanding a given adsorption process, since these are needed for the design and analysis of adsorption systems (Ismadji and Bhatia 2000). Authors of most studies on liquid-phase adsorption, especially the removal of organic compounds or heavy metal ions using various kinds of adsorbents, have only fitted the corresponding experimental results with isotherm equations obtained at a single temperature. It is also important that the experimental data obtained at various temperatures should be correlated by different isotherms equations.
In the present study, several temperature-dependent adsorption models (Langmuir, Freundlich, Sips and Toth) have been employed to correlate the experimental adsorption data obtained. The temperature-dependent forms of these equations were originally developed for gas-phase adsorption processes; here, they have been used to the correlate the experimental data for the adsorption of the dye Acid Blue 129 from the aqueous phase onto an organobentonite. The validity and physical meaning of the equation parameters employed for correlating the adsorption experimental data has also been discussed.
TEMPERATURE-DEPENDENT FORMS OF ISOTHERM MODELS
Adsorption equilibrium data, commonly known as adsorption isotherms, are the basic requirements for the design of adsorption systems. These data provide fundamental physicochemical information for evaluating the applicability of an adsorption process as a unit operation as well as for design purposes. For optimizing the design of an adsorption system, it is important to establish the most appropriate correlation for the experimental equilibrium curve. Hence, the correlation of equilibrium data using either a theoretical or an empirical equation is essential for the interpretation of the adsorption process and for predicting the extent of adsorption. Different adsorption models have been developed and applied successfully for correlating adsorption data for various systems. Most of these models were originally developed for gas-phase adsorption data, but later these models were extended to liquid-phase adsorption processes.
Since the adsorption of an adsorbate onto an adsorbent is affected by temperature, it is important that the isotherm models employed should also possess temperature-dependent forms. Four adsorption isotherm models together with their temperature-dependent forms were used in the present study. They were the Langmuir, Freundlich, Toth and Sips isotherms.
The Langmuir isotherm
solutions due to its simplicity. The Langmuir model was derived on the basis of three assumptions and may be written in the form:
(1)
where qmaxis the maximum amount of adsorbate adsorbed by the adsorbent to achieve complete monolayer coverage of the adsorbent surface (mmol/g) and KLis the Langmuir affinity constant (ᐉ/mmol). The variables q
e(mmol/g) and Ce(mmol/ᐉ) are the amounts of dye adsorbed per unit weight of adsorbent and the equilibrium concentration, respectively.
The parameter qmax is assumed to correspond to saturation of a fixed number of identical surface sites and should logically be independent of the temperature. In real situations, however, qmaxis variable and depends on the adsorption temperature. This means that the saturation limit is associated with the surface functional groups rather than with a set of identical surface sites. The saturation limit can be affected by several factors, such as the number of sites on the adsorbent surface and the affinity between the adsorbate and the adsorbent (Febrianto et al.2009).
The parameter KL, which is related to the adsorption energy, can also be used to determine the type of adsorption process involved. If the value of KLdecreases with increasing temperature, this means that an exothermic adsorption process has occurred and that the adsorption mechanism is dominated by physical adsorption. The reverse trend indicates the occurrence of an endothermic adsorption process with chemical adsorption dominating. In physical sorption, the bonding between the adsorbate and the active sites on the adsorbent weakens at higher temperature; in contrast, in chemical sorption processes the bonding becomes stronger with increasing temperature (Febrianto et al. 2009).
The temperature dependence of the Langmuir isotherm parameters, qmax and KL, may be expressed by the following equations:
(2)
and
(3)
where q0
max (mmol/g) is the maximum adsorption capacity, δ is a constant representing the temperature coefficient of expansion of the adsorbate, K0is the Langmuir affinity constant at the reference temperature, E is the heat of adsorption and T0is the reference temperature (Ismadji and Bhatia 2001; Do 1998).
The Freundlich isotherm
The Freundlich equation is the earliest known adsorption equation and is amongst one of the most widely used isotherms for describing adsorption equilibrium. The isotherm assumes that the adsorbent surface sites exhibit a spectrum of different binding energies (Almeida et al. 2009). Although the Freundlich isotherm is basically an empirical equation, it is often useful as a means of data description. The Freundlich isotherm can also be employed to predict adsorption
K K E
RT
L =
−
0exp
qmax = qmax0 exp
(
T − T)
0
δ
q q K C
K C
e
L e
L e
=
+
max
equilibrium data and also to describe heterogeneous systems and reversible adsorption processes, since it is not restricted to the formation of an adsorbate monolayer (Özcan et al.2005). It is capable of describing the adsorption of organic and inorganic compounds onto a wide variety of adsorbents (Febrianto et al.2009). The Freundlich isotherm is generally found to be better suited for characterizing multi-layer adsorption processes. It may be expressed by the relationship:
(4)
where KF (mmol/g)(ᐉ/mmol)–nand n are the Freundlich constants, K
F indicates the Freundlich adsorption capacity, while n indicates the adsorption intensity and can also characterize the heterogeneity of the system.
The quantities KFand n in equation (4) are temperature-dependent. On the basis of the assumption that a solid surface is composed of sites having a distribution of surface adsorption potential, the temperature-dependent forms of the Freundlich isotherm (Do 1998) may be written as:
(5)
and
(6)
where KF
0 is the adsorption capacity at the reference temperature T0 and α/A0 is a constant.
Equations (5) and (6) suggest that KFand n are not independent. For most practical systems, the parameter n is usually greater than unity; hence, equation (6) indicates that the characteristic surface adsorption energy is greater than the molar thermal energy, RT (Do 1998).
The Sips equation
The Sips isotherm is a combination of the Langmuir and Freundlich expressions. It was developed for predicting adsorption in heterogeneous systems by circumventing the limitation of increasing adsorbate concentration associated with the Freundlich isotherm model (Do 1998; Abramian and El-Rassy 2009; Sips 1948). This equation has a finite limit. Thus, when the concentration is sufficiently high, the equation may be written as:
(7)
where KSis the Sips constant which is related to the affinity (mmol/ᐉ)1/nand n characterizes the heterogeneity of the system. If n is unity, equation (7) becomes the Langmuir equation applicable for ideal surfaces (Do 1998).
In the Sips equation, the temperature dependency is represented via qmax, KS and n. The temperature-dependent form of qmaxmay be expressed by equation (2), while KSand n have the following forms:
and
(9)
The magnitude of KS0in equation (8) is a measure of the affinity between the adsorbate and the adsorbent at the reference temperature T0, while n0and ηrepresent the magnitude of n at the same reference temperature and a constant, respectively (Do 1998).
The Toth equation
The Toth equation follows Henry’s law at very low concentrations and possesses a finite saturation limit at high concentrations. This model was developed on the basis of potential theory and provides a good description of many systems with sub-monolayer coverage (Do 1998):
(10)
where KTh [(mmol/ᐉ)t] is the Toth isotherm constant representing the affinity coefficient, while t
characterizes the heterogeneity of the system and is a dimensionless constant which is usually less than unity. The parameters KThand t are specific to particular adsorbate/adsorbent systems. The greater the deviation of t from unity, the more heterogeneous is the system (Do 1998).
The parameters KThand t are also temperature-dependent. The temperature-dependent forms of the Toth parameters are:
(11)
and
(12)
where KTh
0is the affinity coefficient at the reference temperature T0, t0is the parameter t at the
same reference temperature and ηis a constant parameter.
MATERIALS AND METHODS
Materials
The bentonite used in this study was obtained from a bentonite mine located in Ponorogo, East Java, Indonesia. Elemental analysis of the bentonite via an atomic absorption flame emission spectrophotometer (AA-6200, Shimadzu) gave the following results: Al2O3, 30.71%; SiO2, 48.22%; FeO, 3.14%; CaO, 3.76%; MgO, 0.56%; K2O, 0.17%; Na2O, 1.42%; MnO, 0.4%. In order to remove its organic impurities, the raw bentonite was treated by immersing it in a 30%
solution of hydrogen peroxide for 24 h. The excess hydrogen peroxide was removed by heating the mixture at ca. 100 ºC. The resulting purified raw bentonite was separated from the mixture and dried at 110 ºC for 24 h. The dried raw bentonite was then crushed using a Janke & Kunkel micro-hammer mill to obtain powdered raw bentonite with particle sizes in the range 100–120 mesh. The cation-exchange capacity (CEC) of the raw bentonite was determined via the ASTM C837-99 procedure when a value of 57 mequiv/100 g was obtained.
A.R. grade cationic surfactant (CTAB) and hydrogen peroxide were purchased from Merck while Acid Blue 129 dye (C23H19N2NaO5S) was obtained as the commercial grade. These chemicals were used without any further treatment.
Characterization of the samples
Characterization of the Ponorogo raw bentonite and its modified form (organobentonite) was conducted via Fourier-transform infrared spectroscopy (FT-IR), X-ray diffraction (XRD) and nitrogen sorption methods. FT-IR analyses were carried using the KBr technique on a FTS-3500 GX (Bio-Rad) instrument. The XRD patterns of raw bentonite and its modified form were recorded on a Bruker DS Advance diffractometer at 40 kV and 40 mA using Cu Kα radiation, with measurements being conducted over the range 5º to 40º (2θ) at a step size of 0.01º. Nitrogen sorption measurements were carried out at –196 ºC using a Quadrasorb SI instrument (Quantachrome Instruments, Boyton Beach, FL, U.S.A). Before nitrogen sorption measurements, the samples were degassed in vacuum for 24 h at 120 ºC. The BET surface areas of the samples were determined by applying the standard BET equation over the relative pressure range 0.1–0.3.
Preparation of the organobentonite
The organobentonite was prepared by adding 25 g of Ponorogo bentonite to 100 mᐉof a CTAB
solution where the amount of CTAB in the solution was 7.8 g or equivalent to 150% of the cation-exchange capacity (CEC). The CTAB/bentonite mixture was then stirred for 5 min using a mechanical stirrer. Subsequently, the mixture was placed in a microwave oven and irradiated for 5 min at 700 W. The resulting organobentonite was repeatedly washed with distilled water until it was free from bromide ions, as indicated by a negative bromide test using 0.1 M AgNO3. The organobentonite was dried in an oven at 110 ºC for 2 h and ground to 120 mesh size.
Adsorption studies
Such studies were carried out in batch mode on both the raw bentonite and the organobentonite. Adsorption experiments were conducted by adding known amounts of the organobentonite to a series of Erlenmeyer flasks, each containing 50 mᐉof dye solution at an initial concentration of
250 mg/ᐉ. The flasks were then placed in a temperature-controlled shaker bath and shaken at
150 rpm until equilibrium had been attained. The adsorption experiments were carried out at 25, 30, 40 and 50 ºC, respectively.
(13)
where C0and Ceare the initial and equilibrium concentrations (mg/ᐉ) of dye, respectively, m is
the mass of adsorbent employed (g) and V is the volume of the solution (ᐉ).
RESULTS AND DISCUSSION
Characterization of raw bentonite and its modified form
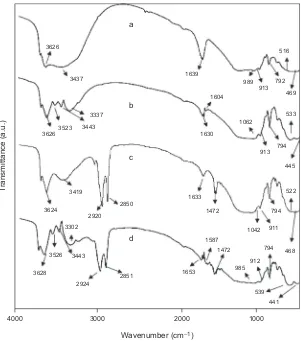
Analysis of the surface groups of raw bentonite and the organobentonite was carried out using a Bio-Rad FTS 3500 GX instrument over the wavenumber range 400–4000 cm–1. The FT-IR results are summarized in Table 1. It can be seen from the data listed that the pair of strong bands at 2850 cm–1and 2920 cm–1was only observed for the surfactant-modified bentonite. These bands may be assigned to the C–H stretching vibrations of the alkyl groups. A specific peak at 1472 cm–1 corresponding to the C–H in-plane binding condition for the methyl groups of the CTAB group was also observed in the spectrum of the organobentonite.
After the adsorption process had occurred (for an initial dye concentration of 250 mg/ᐉat 30 ºC
and neutral pH), the dye-loaded raw bentonite and organobentonite were also characterized by FT-IR spectroscopy, with the recorded spectra again being summarized in Table 1. The FT-IR spectra reveal that vibrations corresponding to the amine groups were observed at 3523 and 3337 cm–1 for the dye-loaded raw bentonite and at 3526 and 3301 cm–1 for the dye-loaded CTAB–bentonite, respectively. Peaks at 1604 cm–1 and 1587 cm–1 corresponding to C=C stretching for the aromatic ring were also observed for both the dye-loaded raw bentonite and organobentonite after the adsorption process. Figure 1 below depicts the corresponding FT-IR spectra for the samples concerned.
The X-ray diffraction patterns of the raw bentonite and organobentonite are given in Figure 2 below. The basal spacings (d001) of the raw bentonite and organobentonite were 1.72 nm and 2.37 nm, respectively. The increase in the basal spacing of the organobentonite indicates that the CTAB molecules were partially intercalated into the interlayer spaces in the bentonite structure, leading to an expansion in the interlamellar spacing.
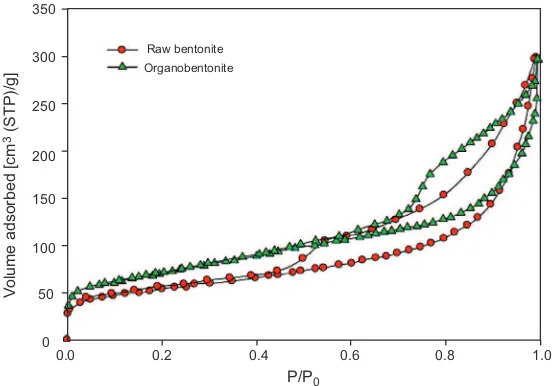
The surface areas of the raw bentonite and organobentonite were determined from nitrogen adsorption studies at –196 ºC. The corresponding nitrogen sorption isotherms for both samples are depicted in Figure 3 below. It is obvious that both samples exhibited mesoporous structures, as indicated by the hysteresis between adsorption and desorption curves at relative pressures of ca. 0.45–0.99. The BET surface areas of raw bentonite and organobentonite were 118 m2/g and 132 m2/g, respectively. The pore volume of the organobentonite was slightly larger than that of the raw material (0.53 cm3/g versus 0.48 cm3/g). This increase in pore volume of the organobentonite may be attributed to the insertion of CTAB into the interlayer structure of raw bentonite.
Isotherm studies
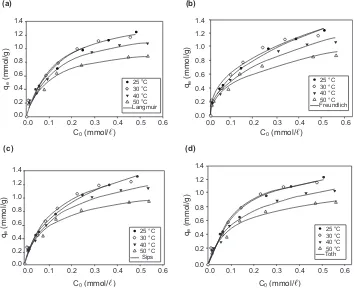
The experimental data for the adsorption of Acid Blue 129 dye from aqueous solution onto bentonite and its modified form were correlated using the Langmuir, Freundlich, Sips and Toth equations. The applicability of the temperature-dependent forms of these equations towards the experimental data was also tested. Figures 4 and 5 below show the adsorption equilibrium
q C C V
m
e
e
854
Y
es
i e
t al
./
A
ds
or
pt
ion Sc
ie
nc
e &
T
ec
hnol
ogy
V
ol
. 28 No. 10 2010
TABLE 1.FT-IR Spectral Assignments for Raw Bentonite and Organobentonite
Assignment Raw bentonite CTAB–bentonite Dye-adsorbed raw bentonite Dye-adsorbed CTAB–bentonite
(cm–1) (cm–1) (cm–1) (cm–1)
Al(Mg)–OH stretching 3626 3624 3626 3628
N–H stretching (for amine groups) – – 3523 3526
– – 3337 3302
H–O–H stretching (for H2O) 3437 3419 3443 3443
C–H stretching (for alkyl groups) – 2920 – 2924
– 2850 – 2851
H–O–H bending 1639 1633 1630 1653
C=C stretching (for ring) – – 1604 1587
C–H in-plane bending (for alkyl groups) – 1472 – 1472
Si–O–Si stretching 989 1042 1062 985
O–H bending of bounded 2Al3+ 913 911 913 912
Si–O stretching of silica and quartz 792 794 794 794
Al–S–O bending 516 522 533 539
Figure 1.FT-IR spectra for bentonite samples: (a) raw bentonite; (b) dye-loaded raw bentonite; (c) organobentonite; and
Wavenumber (cm−1)
T
Figure 2.XRD patterns for (a) raw bentonite and (b) organobentonite.
0
Intensity (a.u.) Intensity (a.u.)
856 Yesi et al./Adsorption Science & Technology Vol. 28 No. 10 2010
Figure 3.Nitrogen sorption isotherms for raw bentonite and organobentonite.
0
Figure 4.Experimental adsorption data for Acid Blue 129 dye onto raw bentonite and the fits of the (a) Langmuir, (b) Freundlich, (c) Sips and (d) Toth model equations.
isotherms of Acid Blue 129 onto raw bentonite and organobentonite, respectively. The parameters for the calculated isotherms were estimated by the non-linear least-squares fit of the isotherm model to the experimental adsorption data. The calculations were conducted simultaneously for all the temperatures at which the Acid Blue isotherms had been measured using T0= 25 ºC. For this purpose, the sum of the squared errors, SSE, viz.:
(14)
was employed as the objective function to be minimized. In this case, qe(exp.)is the actual amount of dye adsorbed, qe(calc.) is the calculated amount of dye adsorbed and N is the number of experimental data.
From Figures 4 and 5, it can be seen that all the isotherm equations used in this study described the experimental data fairly well. The optimal parameters from the fitting of the Langmuir, Freundlich, Sips and Toth equations together with the experimental adsorption data are listed in Tables 2–5. In order to decide which isotherms are suitable for representing the adsorption experimental data, it is necessary to examine the physical meaning of each parameter tabulated in
SSE q q
Figure 5.Experimental adsorption data for Acid Blue 129 dye onto organobentonite and the fits of the (a) Langmuir, (b) Freundlich, (c) Sips and (d) Toth model equations.
858 Yesi et al./Adsorption Science & Technology Vol. 28 No. 10 2010
TABLE 2.Fitting Parameters of the Temperature-dependent Langmuir Equation
Parameters Raw bentonite CTAB–bentonite q0
max(mmol/g) 1.05 1.59
δ(1/K) 0.016 0.0152
E (kJ/mol) 3.85 11.55
K0(ᐉ/mmol) 4.17 768.09
r2 0.97 0.95
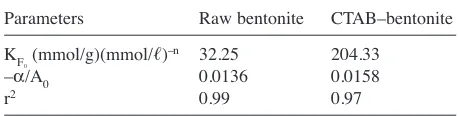
TABLE 3.Fitting Parameters of the Temperature-dependent Freundlich Equation
Parameters Raw bentonite CTAB–bentonite KF
0(mmol/g)(mmol/
ᐉ)–n 32.25 204.33
–α/A0 0.0136 0.0158
r2 0.99 0.97
TABLE 4.Fitting Parameters of the Temperature-dependent Sips Equation
Parameters Raw bentonite CTAB–bentonite q0
max(mmol/g) 0.76 2.76
δ(1/K) 0.0293 0.0305
Ks
0(
ᐉ/mmol) 1.53 1.79
E (kJ/mol) 10.88 38.59
n0 0.8833 1.5423
η 1.6841 1.2755
r2 0.91 0.95
TABLE 5.Fitting Parameters of the Temperature-dependent Toth Equation
Parameters Raw bentonite CTAB–bentonite q0
max(mmol/g) 1.05 1.54
δ(1/K) 0.0160 0.0140
KTh
0(
ᐉ/mmol) 1.1358 0.1442
E (kJ/mol) 2.8140 12.1752
t0 1 0.9620
η 3.140 ×10⁻¹² 0.4637
Tables 2–5. The parameter q0
maxin the Langmuir, Sips and Toth equations, and the parameter KFin the Freundlich equation, represent the adsorption capacity of the adsorbent. The values of the parameter q0
maxin the Langmuir, Sips and Toth equations were reasonable and comparable to values reported elsewhere for the adsorption capacity of bentonite-based adsorbents (Almeida et al. 2009; Koswojo et al. 2010; Al-Asheh et al. 2003). However, since the Freundlich equation failed to give a reasonable value for the adsorption capacity parameter, it has not been included in the discussion below. As mentioned previously, δis a constant related to the temperature coefficient of expansion of the adsorbate. The value of δis specific to a given component and independent of the type of adsorbent employed (Ismadji and Bhatia 2001). The values of the fitting parameter δfor the Langmuir, Sips and Toth equations is consistent and essentially independent of the type of bentonite, as shown by the data recorded in Tables 2, 4 and 5. Based on their verification employing δ, the Langmuir, Sips and Toth equations are still considered adequate for correlating the experimental data.
In order to further verify the adequacy of the above isotherms, it was decided to compare the corresponding values of the heat of adsorption, E, obtained. Physical adsorption processes usually have adsorption energies less than 40 kJ/mol, while higher energies (40–800 kJ/mol) suggest the involvement of chemisorption. Temperature generally has a negative effect on the uptake of adsorbate for physical adsorption (Ismadji and Bhatia 2000). As indicated by the parameter E derived from the Langmuir, Sips and Toth equations, the adsorption of Acid Blue 129 onto raw bentonite and organobentonite was an exothermic process, with the bonding between the adsorbate and the adsorbent being physical in nature. For physical bonding, increasing the temperature leads to a weakening of the interaction between the adsorbent and adsorbate, and hence the amount of Acid Blue 129 adsorbed onto raw bentonite or organobentonite would be expected to decrease with increasing temperature. The magnitudes of the parameter E obtained from fitting the Langmuir, Sips and Toth equations were consistent with our experimental data as depicted by the data recorded in Figures 4 and 5. The higher value observed for the heat of adsorption onto organobentonite is an indication that another bonding mechanism also occurred during the adsorption process. This mechanism will be discussed further below.
The value of the affinity parameter at the reference temperature (K0for the Langmuir equation, KS
0for the Sips equation and KTh0for the Toth equation) is a measure of how strong the adsorbate
molecule is attracted to the surface. When the affinity parameter is high, the surface is covered by a greater number of adsorbate molecules as a result of the stronger affinity towards the surface (Do 1998). The experimental data show that organobentonite exhibited a higher adsorption capacity than the raw bentonite, indicating that Acid Blue 129 had a stronger affinity towards the surface of organobentonite. Inconsistencies in this fitting parameter were observed for the Langmuir and Toth equations. The affinity parameter of the Langmuir equation for the Acid Blue 129/organobentonite system was significantly higher, while this fitting parameter in the Toth equation was lower for the Acid Blue 129/organobentonite system than for the Acid Blue 129/bentonite system.
The parameter η0in the Sips equation characterizes the heterogeneity of a given system, with the magnitude of η0increases as the heterogeneity of the system increases. Such heterogeneity could stem from the solid or the adsorbate or from a combination of both (Almeida et al.2009). The insertion of the cetyltrimethylammonium cation into the bentonite interlayer makes the adsorbent more heterogeneous and improves its adsorption capacity. Based on the evaluation of the physical meaning of the fitting parameters for each equation, it is clear that the Sips equation was capable of representing the adsorption data to a better extent than the other equations examined.
Table 6 overleaf lists the adsorption capacity of several adsorbents towards the removal of dyes from synthetic effluents. On the basis of the fitting parameter q0
860
Y
es
i e
t al
./
A
ds
or
pt
ion Sc
ie
nc
e &
T
ec
hnol
ogy
V
ol
. 28 No. 10 2010
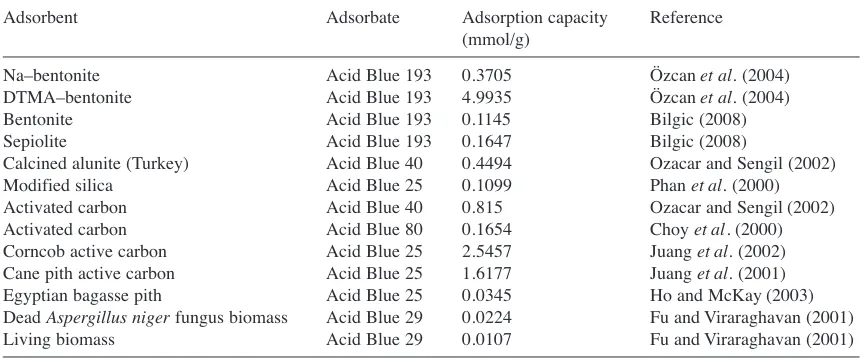
TABLE 6.Adsorption Capacities of Various Adsorbents Employed for the Removal of Dyes from Synthetic Effluents
Adsorbent Adsorbate Adsorption capacity Reference
(mmol/g)
Na–bentonite Acid Blue 193 0.3705 Özcan et al.(2004)
DTMA–bentonite Acid Blue 193 4.9935 Özcan et al.(2004)
Bentonite Acid Blue 193 0.1145 Bilgic (2008)
Sepiolite Acid Blue 193 0.1647 Bilgic (2008)
Calcined alunite (Turkey) Acid Blue 40 0.4494 Ozacar and Sengil (2002)
Modified silica Acid Blue 25 0.1099 Phan et al.(2000)
Activated carbon Acid Blue 40 0.815 Ozacar and Sengil (2002)
Activated carbon Acid Blue 80 0.1654 Choy et al.(2000)
Corncob active carbon Acid Blue 25 2.5457 Juang et al.(2002)
Cane pith active carbon Acid Blue 25 1.6177 Juang et al.(2001)
Egyptian bagasse pith Acid Blue 25 0.0345 Ho and McKay (2003)
Dead Aspergillus nigerfungus biomass Acid Blue 29 0.0224 Fu and Viraraghavan (2001)
of the data in Table 6 shows that organobentonite (CTAB–bentonite) had a higher adsorption capacity than most of low-cost adsorbents used in other studies (Özcan et al.2004; Bilgic 2008; Ozacar and Sengil 2002; Phan et al.2000; Choy et al.2000; Juang et al.2002; Juang et al.2001; Ho and McKay 2003; Fu and Viraraghavan 2001). Thus, the organobentonite synthesized in this study has potential applications as an adsorbent for the removal of Acid Blue 129 dye from aqueous solution.
Effect of initial pH
In general, liquid-phase adsorption is more complex than gas-phase adsorption. Adsorption in the liquid phase is influenced by factors such as the pH, the temperature, the solubility of the adsorbate in the solvent, the polarity of the solvent and the adsorbate, etc. In liquid-phase adsorption, especially when clay materials are employed as the adsorbent, various adsorption mechanisms control the adsorption process simultaneously. In the previous section, based on the fitting procedure of experimental data with several well-known isotherms, it was shown that one of the controlling mechanisms in the adsorption of Acid Blue 129 onto raw bentonite and organobentonite was physical adsorption. Based on the FT-IR spectra listed in Table 1 and depicted in Figure 1, it is obvious that new surface functional groups were present after the adsorption process. This is a strong indication that physical adsorption was not the sole controlling mechanism. However, even if another mechanism exists, this does not mean it will be the controlling or dominating mechanism.
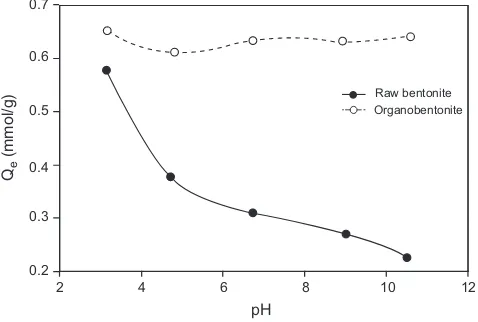
One of the most important factors affecting an adsorption process is the pH of the aqueous medium containing the adsorbate. To study the influence of pH on the adsorption capacity of raw bentonite and CTAB–bentonite, adsorption experiments were carried out at an initial concentration of 300 mg/ᐉand a temperature of 30 ºC using various solutions whose initial pH
values varied from 3 to 11. The effect of pH on the adsorption capacity of raw bentonite and its modified form is depicted in Figure 6. From this figure, it can be seen that the adsorption performance of raw bentonite decreased with increasing pH, while the adsorption performance of the organobentonite was only slightly affected by the pH value of raw the system.
In aqueous clay-containing systems, the reactivity of the clay mineral depends on its surface potential which, in turn, is determined by the presence of ions (H+and OH–) in solution. At low
Figure 6.Effect of the solution pH on the adsorption performance of raw bentonite and organobentonite.
2 0.2 0.3 0.4 0.5 0.6 0.7
4
pH Qe
(mmol/g)
6 8 10
Raw bentonite Organobentonite
pH values, H+ ions are abundant, and the reaction between the silanol group (Si–OH) in the tetrahedral bentonite sheets and H+ions occurs according to:
(15)
Under basic conditions, the dominant ion available in solution is OH–, and interaction between the silanol group and OH–ions in the solution occurs as:
(16)
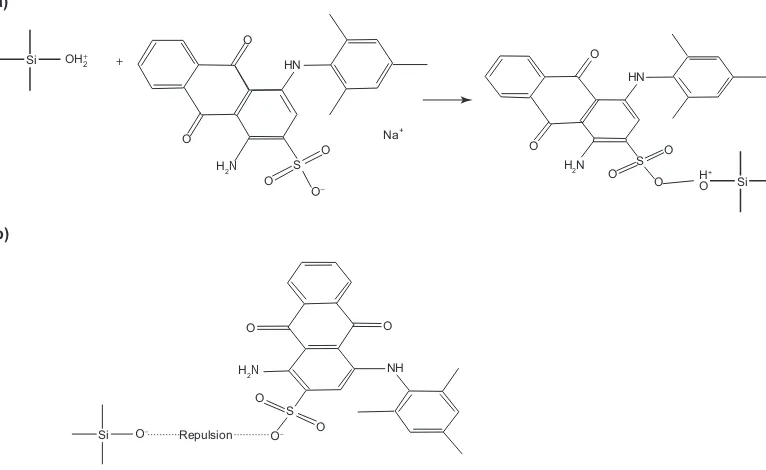
In an aqueous environment, the sulphonate group of Acid Blue 129 is readily dissociated to form the corresponding anion. When the solution is acidic, positively charged protonated silanol groups on the bentonite are believed to be the binding sites for the Acid Blue 129 anions. Such interactions occur via electrostatic attraction as shown in Figure 7(a). On the other hand, at higher pH (under basic conditions), repulsion between the negatively charged surface and the anionic dye molecules occurs, as depicted in Figure 7(b).
Since the exchangeable cations of CTAB were hydrated during the modification of raw bentonite this led to only weak intercalation, with the CTAB cations being attached to the periphery of the siloxane cavities in the bentonite structure. The siloxane cavities themselves are formed by an arrangement of six oxygen ions bonded to Si in the tetrahedral layer (Sposito et al.1999; Naim 2004). Thus, the presence of excess isomorphous cations as electron donors in solution would lead to an increase in the activity of the siloxane cavities, allowing the head of the CTAB cation to
Si OH− + OH− → SiO− + H O2
Si OH− + H+ → Si OH− 2+
862 Yesi et al./Adsorption Science & Technology Vol. 28 No. 10 2010
Figure 7.(a) Interaction between the protonated silanol groups in bentonite and the negatively charged Acid Blue 129 ions. (b) Ionic repulsion between the negatively charged adsorbent surface and the anionic dye molecules.
HN
Na+
O
H2N
H2N NH
Si
O
O
S S
O
H+
O O
O O
O
O
HN
H2N
O
S O
O Repulsion
O
Si OH+
Si
2 +
(a)
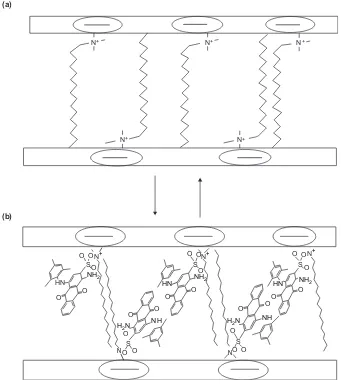
freely enter a siloxane cavity. This would lead to the formation of an inner-sphere complex causing the entrapment of the ion within the cavity as shown in Figure 8(a). The presence of the cetyltrimethylammonium ion (CTA–) in the bentonite interlayer would result in a positive charge on the surface of the organobentonite. Electrostatic interaction could then occur between the sulphonate group of the Acid Blue 129 in solution and the positively charged adsorbent as depicted in Figure 8(b). The extent of Acid Blue 129 adsorption decreased slightly with increasing solution pH due to competition between OH–ions in the aqueous phase and the negatively charged sulphonate group of Acid Blue 129. However, since the sulphonate groups of Acid Blue 129 exhibit a higher affinity for the adsorbent than OH– ions, the extent of interference by the latter ions was minimal.
Figure 8.(a) The formation of organobentonite and (b) the interaction between the negatively charged adsorbent surface and the positively charged adsorbate.
N+
N+
N+
N+
N+ (a)
(b)
O
O O
O
O O O
O O
O
S
O O S O
O S
N
HN
O
O
O
O O
NH2 NH2 NH2
NH NH
HN HN
+ O O
S
N O O
S N
+ +
N N
H2N
H2N
Adsorption kinetics
The kinetics of an adsorption process are largely dependent on the physical and/or chemical characteristics of the adsorbent material and adsorbate species; these also affect the adsorption mechanism (Bektas et al. 2004). A number of kinetic models are available for describing adsorption kinetics and the rate-limiting step, with the most widely used being the models proposed by Lagergren (1898) and Blanchard et al. (1984). Lagergren (1898) was the first to develop a model, known as Lagergren’s first-order rate equation, to describe the rate of sorption in liquid-phase systems. An expression of this model in terms of pseudo-first-order kinetics was employed by Sharma et al. (1990) to correlate the sorption kinetics of Ni(II) ions onto wollastonite. The model proposed by Blanchard et al., known as the pseudo-second-order kinetic model (Blanchard et al. 1984; Plazinski et al. 2009), is commonly associated with the situation when the adsorption/desorption rates control the overall sorption kinetics.
The Lagergren first-order rate expression based on the adsorbent capacity is generally expressed as:
(17)
Integration of this equation with the boundary conditions t = 0, q = 0 and t = t, q = q gives:
(18)
where q (mmol/g) is the amount of adsorbate adsorbed at time t (min), qe (mmol/g) is the adsorption capacity at equilibrium and k1 (min–1) is the rate constant of the pseudo-first-order model.
The most commonly used form of the pseudo-second-order kinetic model is that presented by
Ho et al. (1996) which may be expressed as:
(19)
Integration of this equation with the boundary conditions t = 0, q = 0 and t = t, q = q gives:
(20)
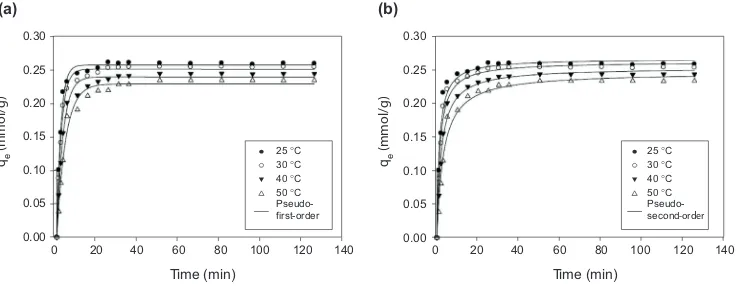
where k2[g/(mmol min)] is the rate constant of the pseudo-second-order adsorption process. Figures 9(a,b) and 10(a,b) below present the adsorption kinetic experimental data for Acid Blue 129 onto raw bentonite and organobentonite, respectively, together with the calculated plots obtained by applying the pseudo-first-order and pseudo-second-order models, respectively, to the experimental data. The values of the parameters obtained by fitting the experimental data with equations (18), (20) and (14) as the objective functions are summarized in Tables 7 and 8. From Figures 9 and 10, it can be seen that both kinetic models represented the data fairly well. However, the pseudo-first-order model gave a smaller SSE and a slightly better correlation coefficient (r2). The value of qeobtained from the fitting of both models also agrees with the experimental data.
q q q k t
q k t
e e
e
=
+
1 2 2d d q
t = k q2
(
e − q)
2
q = qe1 − exp
(
−k t1)
dd q
t = k q1( e − q)
The deviation of qeobtained from fitting the experimental data by the pseudo-first-order model was smaller than that obtained by fitting the pseudo-second-order model. This result confirms that physical adsorption was more dominant than chemical adsorption in the systems studied and is the controlling mechanism for the adsorption of Acid Blue 129 onto both raw bentonite and organobentonite.
CONCLUSIONS
Ponorogo bentonite has potential applications as an adsorbent for the removal of Acid Blue 129 dye from aqueous solution. Modification of this bentonite with a cationic surfactant enhanced its adsorption performance. Several well-known adsorption isotherms together with their temperature-dependent forms were employed to correlate the adsorption data. The Sips equation gave a better fitting and more reasonable parameters than the other equations examined. Kinetic Figure 9.Adsorption kinetics of Acid Blue 129 dye onto raw bentonite and the application of (a) the pseudo-first-order model and (b) the pseudo-second-order model to the experimental data.
0 500
2000 2500 3000 0 500 1000 1500 2000 2500 3000
25 °C
Figure 10.Adsorption kinetics of Acid Blue dye 129 onto organobentonite and the application of (a) the pseudo-first-order model and (b) the pseudo-second-order model to the experimental data.
60 80 100 120 140
Time (min) Time (min)
866
Y
es
i e
t al
./
A
ds
or
pt
ion Sc
ie
nc
e &
T
ec
hnol
ogy
V
ol
. 28 No. 10 2010
TABLE 8.Parameters from the Application of the Pseudo-first-order and Pseudo-second-order Kinetic Models to the Adsorption of Acid Blue 129 Dye onto Organobentonite
Temp. (ºC) qexp. Pseudo-first-order model Pseudo-second-order model
(mmol/g) k
1(min–1) qe(mmol/g) r2 SSE (%) k2[g/(mmol) min] qe(mmol/g) r2 SSE (%)
25 0.2591 0.5096 0.2570 0.9924 5.09 ×10⁻⁴ 3.1266 0.2677 0.9797 2.08 ×10⁻³
30 0.2541 0.4428 0.2509 0.9927 7.72 ×10⁻⁴ 2.6427 0.2628 0.9840 2.11 ×10⁻³
40 0.2441 0.3266 0.2393 0.9907 1.16 ×10⁻³ 1.8584 0.2541 0.9864 2.43 ×10⁻³
50 0.2341 0.2328 0.2288 0.9857 1.29 ×10⁻³ 1.2817 0.2471 0.9808 3.15
2×10⁻³
TABLE 7.Parameters from the Application of the Pseudo-first-order and Pseudo-second-order Kinetic Models to the Adsorption of Acid Blue 129 Dye onto Raw Bentonite
Temp. (ºC) qexp. Pseudo-first-order model Pseudo-second-order model
(mmol/g) k
1 (min–1) qe(mmol/g) r2 SSE (%) k2[g/(mmol min)] qe(mmol/g) r2 SSE (%)
25 0.1780 0.0102 0.1753 0.9988 7.48 ×10⁻⁴ 0.0685 0.1923 0.9874 3.97 ×10⁻³
30 0.1718 0.0101 0.1659 0.9957 1.64 ×10⁻³ 0.0688 0.1827 0.9902 3.02 ×10⁻³
40 0.1611 0.0100 0.1554 0.9952 1.55 ×10⁻³ 0.0735 0.1713 0.9931 2.83 ×10⁻³
50 0.1524 0.0099 0.1456 0.9954 1.88 ×10⁻³ 0.0790 0.1605 0.9924 2.24
studies showed that the data were better fitted by the pseudo-first-order kinetic model than the pseudo-second order model. Furthermore, although both physical and chemical adsorption occurred during the adsorption process, physical adsorption provided the main controlling mechanism.
ACKNOWLEDGEMENTS
The first and second authors would like to express their sincere gratitude to the Department of Chemical Engineering, National Taiwan University of Science and Technology, Taiwan, for an undergraduate exchange student grant and providing all the necessary facilities for conducting the studies presented.
REFERENCES
Abramian, L. and El-Rassy, H. (2009) Chem. Eng. J.150,403. Aksu, Z., Tatli, A.I. and Tunc, O. (2008) Chem. Eng. J.142,23.
Al-Asheh, S., Banat, F. and Abu-Aitah, L. (2003) Adsorpt. Sci. Technol.21,451.
Almeida, C.A.P., Debacher, N.A., Downs, A.J., Cottet, L. and Mello, C.A.D. (2009) J. Colloid Interface Sci.
332,46.
Bektas, N., Agim, B.A. and Kara, S. (2004) J. Hazard. Mater.112,115. Bilgiç, C. (2008) Adsorpt. Sci. Technol.26,363.
Blanchard, G., Maunaye, M. and Martin, G. (1984) Water Res.18,1501. Choy, K.K.H., Porter, J.F. and McKay, G. (2000) J. Chem. Eng. Data45,575.
Do, D.D. (1998) Adsorption Analysis: Equilbria and Kinetics, Imperial College Press, London, U.K. Eren, E. and Afsin, B. (2008) Dyes Pigm.76,220.
Febrianto, J., Kosasih, A.N., Sunarso, J., Ju, Y.H., Indraswati, N. and Ismadji, S. (2009) J. Hazard. Mater.
162,616.
Fu, Y. and Viraraghavan, T. (2001) Am. Assoc. Text. Chem. Color. Rev.1,36.
Guiza, S., Bagane, M., Al-Soudani, A.H. and Amore, B.H. (2004) Adsorpt. Sci. Technol.22,245. Ho, Y.S. and McKay, G. (2003) Process Biochem.38,1047.
Ho, Y.S., Wase, D.A.J. and Forster, C.F. (1996) Environ. Technol.17,71. Ismadji, S. and Bhatia, S.K. (2000) Can. J. Chem. Eng.78,892. Ismadji, S. and Bhatia, S.K. (2001) Langmuir17,1488. Juang, R.S., Tseng, R.L. and Wu, F.C. (2001) Adsorption7,65. Juang, R.S., Wu, F.C. and Tseng, R.L. (2002) Colloid Surf. A201, 191.
Koswojo, R., Utomo, R.P., Ju, Y.H., Ayucitra, A., Soetaredjo, F.E., Sunarso, J. and Ismadji, S. (2010) Appl. Clay Sci.48,81.
Lagergren, S. (1898) K. Sven. Vetenskapsakad. Handl. 24,1.
Naim, M. (2004) Ph.D. Thesis, University of South Florida, Tampa, FL, U.S.A. Ozacar, M. and Sengil, A.I. (2002) Adsorption8,301.
Özcan, A.S., Erdem, B. and Özcan, A. (2004) J. Colloid Interface Sci.280,44. Özcan, A.S., Erdem, B. and Özcan, A. (2005) Colloids Surf. A266,73.
Paula, A., Immich, S., Augusto, A., de Souza, U., de Arruda, S.M. and de Souza, G.U. (2009) Adsorpt. Sci. Technol.27,461.
Phan, T.N.T., Bacquet, M. and Morcellet, M. (2000) J. Inclusion Phenom. Macrocyclic Chem.38,245. Plazinski, W., Rudzinski, W. and Plazinska, A. (2009) Adv. Colloid Interface Sci.152,2.
Sips, R. (1948) J. Chem. Phys.16,490.
Sposito, G., Skipper, N.T., Sutton, R., Park, S., Soper, A.K. and Greathouse, J.A. (1999) Proc. Natl. Acad. Sci. USA96,3358.
Zhou, C.H. (2010) Appl. Clay Sci.48,1.