A STUDY ON STUDENTS’ PERCEPTION TOWARDS THE
QUALITY OF SERVICES PROVIDED BY THE STUDENTS’
RESIDENTIAL HALL,
UNIVERSITI UTARA MALAYSIA
NURUL HAMIZA BINTI HAMZAH
UNIVERSITI UTARA MALAYSIA
A STUDY ON STUDENTS’ PERCEPTION TOWARDS THE
QUALITY OF SERVICES PROVIDED BY THE STUDENTS’
RESIDENTIAL HALL,
UNIVERSITI UTARA MALAYSIA
A thesis submitted to the College of Business in partial fulfillment of the requirements for the degree Master of Science (Management)
Universiti Utara Malaysia
by
Nurul Hamiza Binti Hamzah
ii
In presenting this thesis in partial fulfillment of requirements for a post graduate degree from Universiti Utara Malaysia, I agree that the University Library may make it freely available for inspection. I further agree that permission for copying of this thesis in any manner, in whole or in part, for scholarly purposes may be granted by my supervisor or, in his absence, by the Assistant Vice Chancellor of College of Business, UUM. It is understand that any copying or publication or use of this thesis or parts thereof for financial gain shall due recognition shall be given to me and to Universiti Utara Malaysia for any scholarly use which maybe of any material from thesis.
Request for permission to copy or to make other use of materials in this thesis, in whole or in part, should be addressed to:
Assistant Vice Chancellor College of Business Universiti Utara Malaysia
iii
iv
Kualiti adalah suatu proses yang berterusan untuk mengekalkan hubungan dengan pelajar serta untuk menjangkakan dan memenuhi kehendak-kehendak mereka yang sentiasa berubah-ubah. Kualiti merupakan salah satu fungsi teras bagi organisasi perkhidmatan. Kepuasan pelanggan bergantung kepada kualiti perkhidmatan yang diterima oleh pelanggan. Kualiti perkhidmatan yang tidak memuaskan akan mengakibatkan tanggapan yang buruk terhadap organisasi itu sendiri. Ia juga akan mengurangkan kepopularan kepada organisasi tersebut. Selain itu, ia akan memberikan gambaran/imej yang buruk dan reputasi yang rendah kepada organisasi untuk jangkamasa yang panjang. Tujuan utama kajian ini adalah untuk menentukan Persepsi Pelajar terhadap Kualiti Perkhidmatan di Dewan Penginapan Pelajar, Kolej Perniagaan, Universiti Utara Malaysia. Seramai 96 responden terlibat di dalam kajian ini. Dapatan kajian menunjukan bahawa dimensi “Tangible” adalah yang terpenting jika dibandingkan dengan lain-lain dimensi iaitu “Kebolehpercayaan” (Reliability) “Kecepatan Bertindak” (Responsiveness),
v
All praise due to Allah SWT, the Lord of the world that makes it possible for me to complete this project paper. Blessing and salutation also be on Prophet of Allah SWT, Muhammad SAW.
I would like to take this opportunity to express my gratitude and appreciation to the following individuals whose guidance and contribution in preparing this paper.
Firstly, I would like to express my gratefulness and appreciation to my supervisor, Assoc. Prof. Dr. Nor Azila binti Mohd Noor for her guidance, encouragement and advices throughout the process of completing this project paper. Word of appreciation also goes to Tuan Haji Mohamad Zainol Abidin bin Adam of UUM COB and Dr. Nor Idayu binti Mehat for their tolerance and concerns. I am truly indebted for their contribution in terms of time, patience, attentions and efforts for the completion of this project paper.
A very special thank to my beloved husband, Kissman bin Rahmat and my daughter, Nurul Aniss binti Kissman whose love, faith, patience and continuous supports have gave me the encouragement to complete this study. I also would like to express my gratefulness to my beloved parents, Assoc. Prof. Hamzah bin Samat and Puan Hamidah binti Hussain and my siblings, Mimie, Farah and Hafiz for their constant demonstrations of love and continuous moral supports throughout my years of study. I would like to thank all respondents of this study without which this study would not have been successful. Last but not least, my thanks to all of my friends especially to Kak Lina and Kak Milia, my colleagues and all individuals who are involved direct and indirectly in the process of completing this study.
vi
CONTENTS PAGE
Certification of Project Paper .. .. .. .. .. .. .. i Permission to Use.. .. .. .. .. .. .. .. .. ii
Abstract.. .. .. .. .. .. .. .. .. .. iii
Abstark.. .. .. .. .. .. .. .. .. .. iv
Acknowledgement.. .. .. .. .. .. .. .. .. v
Table of Contents.. .. .. .. .. .. .. .. .. vi List of Tables.. .. .. .. .. .. .. .. .. ix
List of Figures .. .. .. .. .. .. .. .. .. x
CHAPTER 1: INTRODUCTION
vii CHAPTER 2: LITERATURE REVIEW
2.1 Introduction.. .. .. .. .. .. .. .. .. 11 2.2 The Importance of Service Quality.. .. .. .. .. .. 11 2.3 The Role of Consumers in Service Delivery.. .. .. .. .. 13 2.4 Service Quality.. .. .. .. .. .. .. .. .. 15 2.5 Customer Satisfaction and Service Quality.. .. .. .. .. 18 2.6 Research Framework.. .. .. .. .. .. .. .. 19 2.7 Research Hypothesis.. .. .. .. .. .. .. .. 20
CHAPTER 3: RESEARCH METHODOLOGY
3.1 Introduction.. .. .. .. .. .. .. .. .. 21 3.2 Research Methodology.. .. .. .. .. .. .. .. 21 3.3 Population and Sample.. .. .. .. .. .. .. .. 22 3.4 Questionnaire Design.. .. .. .. .. .. .. .. 23 3.5 Data Collection and Procedures.. .. .. .. .. .. .. 25 3.6 Technique of Data Analysis.. .. .. .. .. .. .. 26
CHAPTER 4: RESULTS AND DATA ANALYSIS
viii
4.5 Regression Analysis between Dimensions of Service Quality and
Total Quality.. .. .. .. .. .. .. .. .. 36
CHAPTER 5: DISCUSSION, RECOMMENDATION AND CONCLUSION
5.1 Introduction.. .. .. .. .. .. .. .. .. 37
5.2 Discussions.. .. .. .. .. .. .. .. .. 37
5.3 Recommendations.. .. .. .. .. .. .. .. 39
5.4 Conclusion.. .. .. .. .. .. .. .. .. 40
REFERENCES.. .. .. .. .. .. .. .. .. 41
ix
Table 1: Number of students according to Residential Hall .. .. .. 3 Table 3: Likert Scale Score for SERVQUAL items.. .. .. .. .. 24 Table 3.1: Likert Scale Score for Question 1 and 2 in Section 3.. .. .. 25 Table 4: Background of Respondents.. .. .. .. .. .. 28 Table 4.1: The Average and Standard Deviation of Dimension of
Service Quality (Tangible).. .. .. .. .. .. 29 Table 4.2: The Average and Standard Deviation of Dimension of
Service Quality (Reliability).. .. .. .. .. .. 30 Table 4.3: The Average and Standard Deviation of Dimension of
Service Quality (Responsiveness).. .. .. .. .. 31 Table 4.4: The Average and Standard Deviation of Dimension of
Service Quality (Assurance).. .. .. .. .. .. 32 Table 4.5: The Average and Standard Deviation of Dimension of
Service Quality (Empathy).. .. .. .. .. .. 33 Table 4.6: The Average and Standard Deviation of Dimension of
Service Quality (Overall Quality).. .. .. .. .. 34 Table 4.7: Correlations between Dimensions of Service Quality and
x
Total Quality.. .. .. .. .. .. .. .. 36
1
__________________________________________________________________
1.1Introduction and Background of Study
Customer satisfaction is a measure of how products and services supplied by a company met or surpassed customers’ expectation. It has been accepted as a key performance indicator for business organization. In a competitive marketplace where businesses compete for customers, customers’ satisfaction is a key differentiator and increasingly has become a key element of business strategy.
Customers’ satisfaction is an ambiguous and abstract concept and the actual manifestation of the state of satisfaction will vary from person to person and product/service to product/service. The state of satisfaction depends on a number of factors, both psychological and physical variables, which correlate with satisfaction behaviors such as return and recommend rate. The level of satisfaction can also vary depending on other options the customer may have and other products against which the customer can compare the organization's products.
2
Universiti Utara Malaysia is situated in Northern of Peninsular Malaysia. It offers many types of services to their “main customers” which are the students.
Universiti Utara Malaysia is concerned about quality and accountability and it aims to achieve their vision which is to be “The World Class University”. The service provided must fulfill customers’ needs and wants in order to help the customers to achieve their satisfaction to the fullest.
After the transition that has been made by top management of the university in the year of 2007, this universiti is divided into three (3) main academic colleges namely, College of Business (COB), College of Arts and Sciences (CAS) and College of Law, Government and International Studies (COLGIS) that have been organized under one university (UUM). It is one of the higher learning institutions in this country that educates the professionals in management. In this relation, UUM should increase its efficiency, effectiveness and productivity in order to serve their customers the best services.
Hence, this study intended to determine the level of satisfaction achieve by its customers through the services that is being provided.
3
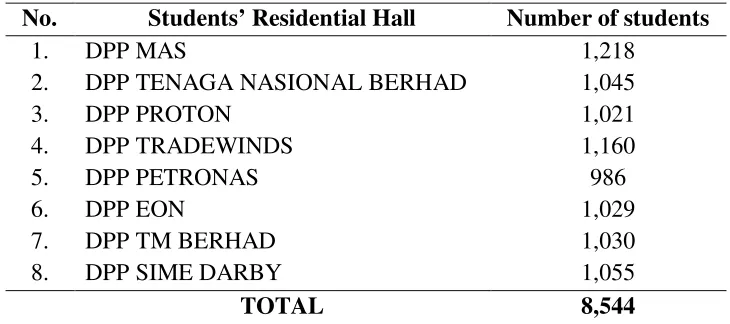
The functions of Students’ Residential Hall College of Business, UUM is to provide the conducive accommodations and best facilities to almost 8,000 students who are staying in these eight (8) of the residential halls that has been organized under College of Business itself.
Besides providing the conducive accommodation to stay, all the students who is staying at Students’ Residential Hall, College of Business provide facilities such as food courts, cafeterias, common rooms, computer labs, shops, laundry facilities, recreation and sports facilities and others to fulfill students’ needs and wants.
Table 1 showed the total number of students registered in Students’ Residential Hall, College of Business as at 1st February 2009. The sample of this study would focus on the students who are registered and stayed in all eight (8) Students’ Residential Hall, College of Business, UUM.
Table 1: Number of students according to Residential Hall
No. Students’ Residential Hall Number of students
1. DPP MAS 1,218
2. DPP TENAGA NASIONAL BERHAD 1,045
3. DPP PROTON 1,021
4
1.2 Problem Statement
Education services are difficult to be standardized due its tangibility (DiDomenico and Bonnici, 1996). Tangible can be described as the appearance of physical facilities, equipment, personnel, printed and visual communication materials. Despite of the services given to the students, the top management of the Higher Education (HE) institution should measure their service quality in order to function efficiently and effectively. Satisfaction of existing students towards the university services would bring the positive impact to the outsiders/public. Beside that, it will encourage the university to acquire a competitive advantage (DiDomenico and Bonnici, 1996).
5
1.3 Research Objective
Firstly, the purpose of this study is to determine the students’ perception towards the quality of services provided at Students’ Residential Hall, College of Business, UUM based on five (5) dimensions of service quality. These dimensions have been introduced by Parasuraman et al. (1985, 1989). Hence, the outcome of this study can be a benchmark for the management to improve the quality of services that is being provided to the students.
6
1.4 Significance of Study
Quality is the customers' perception of the value of the suppliers' work output. We cannot separate the process and the human factor. When Quality has been built into a product, it will generate emotions and feelings within those who have taken part in its creation. When we have made something that we are proud of, or when we have produced a product that brings smiles to our customers, then we have achieved Quality.
This study contributes to both the students and the organization. Academically, it will widen the dimensions of quality service in organization. For the purpose of this study, the primary participants in the service of education are the students. Poor service quality can reduce the popularity of the organization. Besides that, in the long term it will give the bad image and low reputation of the organization itself.
7
1.5 Scope of the Study
The respondents of this study are only UUM students. The sample of this study are students who registered and stayed in all eight (8) Students’ Residential Hall, College of Business, UUM only.
8
1.6 Limitation of the Study
There are some limitations for this study. Firstly, the study is only limited to determine students’ satisfaction towards service quality at Students’ Residential Hall, UUM COB. The sample of this study is only limited to the students who are staying at Students’ Residential Halls, UUM COB.
Perception is the process of attaining awareness or understanding of sensory information. Perception to service quality is subjective, so, it is difficult to measure. The outcomes of this study will help the management of Students’ Residential Halls, UUM COB to improve their quality of services that provided to the students. The other limitations of the study are the constraints of time. This is because the study took only less than five months to be completed.
9
1.7 Definition of Terms
Quality : Quality is the ongoing process of building and sustaining relationships by assessing, anticipating, and fulfilling stated and implied needs.
Service : A service is the diametrically opposed non-material counter piece of a physical good.
Quality of service : Can be defined as level of customer satisfaction towards quality of service provided
Customer : Customer isalso a client, a buyer or a purchaser is the buyer or user of the paid products of an individual or organization, mostly called the supplier or seller.
Satisfaction : Satisfaction refers to the situation where people feel their perception exceeds the expectation.
Perception : Perception is the process by which organisms interpret and organize sensation to produce a meaningful experience of the world.
DPP : DPP also known as “Dewan Penginapan Pelajar” which means
10
Tangible : Appearance of physical facilities, equipments, personnel, printed and visual and communication materials.
Reliability :Ability to perform promised service reliably and accurately.
Assurance : Knowledge and courtesy of employees and their ability to convey trust and confidence.
Responsiveness :Willingness to help customers to provide prompt service.
Empathy :The firm provides care and individualized attention to its customers.
11
__________________________________________________________________
2.1Introduction
This chapter reviews literatures in the context of this study. In this section, discussion
will be based on the importance and the dimensions of service quality, the role of consumer in
service delivery, service quality and customer satisfaction. Research framework and research
hypothesis are also discussed in this chapter.
2.2 The Importance of Service Quality
Service quality often makes the difference between a successful and unsuccessful
business. In fact, service quality has become the great differentiator, the most powerful
competitive weapon and the most service organization possesses.
Quality is defined as “conformance to specifications,” but this phrase can be misleading. Quality
as conformance to customer specification is the customers’ definition of quality which is
12
There are several researchers who studied about customers’ satisfaction and perception.
According to Zeithmal and Bitner, (2000), service quality differs from quality of goods, in that
services are intangible while goods are tangible. This presents a challenge to marketers. Services
cannot be easily communicated to customers, and hence quality may be difficult for customers to
assess. Services are characterized as being tangible, perishable, produced and consumed
simultaneously, and heterogeneous. A major challenge for companies is to deliver service quality
consistently and at all times.
Service and product quality is in the mind of customer. This means that measuring quality
requires talking to customers. Quality reflects the extent to which product or service meets or
exceeds customers’ expectations. Rust and Oliver (1994), found that for companies to understand
how customers perceive their quality, they must measure customers’ satisfaction with their
products and services. Perceived service quality is considered as a component of students’
satisfaction (Zeithaml & Bitner, 1996). Parasuraman et al., (1998) concluded that customers’ satisfaction led to perceived service quality. They also concluded that service quality and
students satisfaction is highly correlated.
Another study conducted by Pariseau and McDaniel (1997) found that the most important
determinants of overall service quality for students are assurance dimensions. This is because
assurance dimensions are important since it concerns with knowledge, courtesy and the ability to
inspire trust.
On the other hand, Frost and Kumar (2000), found that responsiveness influenced service quality
the most. However, Curry and Sinclair (2002) found that reliability is the most important
13
2.3 The Role of Consumers in Service Delivery
One distinctive aspect of services is that consumers are often part of the production and
delivery processes. In many services, the consumer is required to contribute information and/or
effort before the service transaction takes place (Kelly et al., 1990). The consumer’s input constitute the raw material that is transformed by the service organization’s employees into a
service product.
Consequently, the consumer contributes directly to the quality of service delivered, and to his or
her satisfaction/ dissatisfaction (Mills et al., 183, p.302). If the inputs provided by the consumer are inadequate and or inappropriate, this may well lead to service problems and failures.
Zeithmal et al., (1990) also identified some factors which can influence the consumer’s perception of service performance. These include tangibles, such as the food eaten in the
restaurant, the physical surroundings which the service transaction takes place, the equipment
involved, and so on; the perceived competence and credibility of service providers, and their
responsiveness, reliability and courtesy.
The customer is an integral part of the service and uNless he or she performs his or her role
effectively, the desired service outcome is not possible. In addition to contributing to their own
satisfaction by improving the quality of service delivered to them, some customers simply enjoy
participating in service delivery. These customers find the act of participating to be untrinsically
14
Another role that customers can play in service delivery is that they can contribute to their own
satisfaction and the ultimate quality of the services they receive. Customers may not bother
whether they have increased the productivity of the organization through their participation, but
they probably do bother a great deal about whether or not their needs are fulfilled (Kelly et al., 1990).
In addition, many services require close personal interaction between the service provider and
the consumer. Whether or not such interaction is perceived by the consumer to be satisfactory
may depend on a variety of factors, ranging from the appearance of the service provider (by the
top management of the organization and the supporting staffs) and their perceived competence,
to the personality characteristics of, and the interpersonal attraction between, the participants.
Although some of these factors may contribute to service heterogeneity and variability, they are
15
2.4 Service Quality
Perceived service quality is defined as the consumers’ judgment about an entity’s overall
excellent or superiority (Zeithaml, 1987). It differs from the objective quality which is defined by
Garvin 1983 and Hjorth- Anderson (1994) as a form of attitude, related but not equivalent to
satisfaction, and results from a comparison of expectations with perceptions of performance.
Researchers such as Garvin (1983), Dodds and Monroe (1984), Holbrook and Cofman (1985),
Jacoby and Olson (1985) and Zeithaml (1987) have emphasized the difference between the
objective and perceived quality. For example, Holbrook and Cofman (1985), noted that
consumers do not use the term of quality in the same way as researchers and marketers, who
define it conceptually. The conceptual meaning distinguishes between mechanistic and
humanistic quality. “Mechanistic” (quality) involves an objective aspect or feature of thing or
event while “humanistic” (quality) involves the subjective response of people to object and is
therefore a highly relativistic phenomenon that differs between judges” (Holbrook and Cofman,
1985, p.33).
Another key in defining the service role is to use every opportunity to communicate and
reinforce services standards such as in meetings and training sessions; in internal media such as
wallet cards, desk signs and wall posters; and in performance measurement, appraisal and reward
system.
Defining employees’ service role clearly, consistently and credibly is important to any
16
service standards are well worth the investment necessary to develop and reinforce them. Service
employees need to know what excellent service means and why they should care about
delivering it. The delivery of quality in goods and services has become a marketing priority of
the 1980s (Leonard and Sasser, 1982; Rabin, 1983).
Marketers of tangible goods defined and measured quality with increasing level of precision. On
the other hand, marketers of services experience difficulty in understanding and controlling
quality. This is because services are performances rather than objects, precise manufacturing
specifications for uniform quality rarely can be established and enforced by the firm. Quality in
services is not engineered at the manufacturing plant, then, delivered intact to the customer.
Furthermore, the performance of service especially those with a high labor content often differs
among employees, among customers and from day to day. In most services, quality occurs
during service delivery, usually in an interaction between the customer and contact personnel of
the service firm. For this reason, service quality is highly dependent on the performance
employees, an organizational resource that cannot be controlled to the degree that components of
tangible goods can be engineered (Crosby, 1979; Garvin, 1983).
Thompson et. al., (1985) noted that delivering high service quality produces measurable benefits in profit, cost savings and market share. Therefore, an understanding of the nature of service
quality and how it is achieved in organizations has become a priority for research. Joseph &
Joseph (1997) noted that when dealing with physical facilities, students consider quality
universities as being those that have excellent academic, accommodation, as well as excellent
17
Specific variables related to management commitment to service quality include the proportion
of resources committed to service quality (rather than to other goals), the existence to which
managers believe their attempts to improve service quality will be recognized and rewarded in
the organization (Leonard and Sasser , 1982). Though the contact person maybe totally
committed to serving the consumer, he or she cannot perform well because control over the
service has been dispersed among multiple organizational units, which is a major problem in
service businesses (Zeithaml, Parasuaraman and Berry, 1985). Pariseau and McDaniel (1997)
found that the most important determinants of overall quality for students are assurance,
reliability and empathy.
Curry and Sinclair (2002) found that is “reliability” is the most important determinant in service
quality. Assurance dimensions become important as this factor is related to with knowledge,
courtesy and an ability to inspire trust and confidence.
As noted by Oldfield and Baron (2000), any attempt to deliver quality service, those who exert
control or influence upon any of the customer groups needs to be constantly aware that
interaction between students and staff lies at the heart of good service delivery. This is because
students would view the member of staff dealing with them as the sample to generalize their
18
2.5 Customer Satisfaction and Service Quality
Research conducted by Oliver and Swan (1989) to study the level of satisfaction towards
the salesperson found that buyer inclination interact with the salesperson in the future is the only
function of satisfaction. Satisfaction in this case was viewed as a function of fairness where
fairness significantly mediated the role of outcomes and input effect of satisfaction. This
suggested that satisfaction is directly sensitive to equity and indirectly to the component in
equity. A study comparing the utilities of four (4) attributes by Ostrom and Lacoucci (1985)
suggested that the price of fees on the students on the services given by the college and
university were the least attributes compare to the quality and friendliness.
Smith and Ennew (2001) outlined interesting aspect about Gronross Model. They highlighted
that there was a hidden aspect in the choice of satisfaction perception of customer between which
is more the affective indignation and the technical functionality. For example the particular
facility obtained by the students could be judged according to how reliable they are (technical
functionality) or according to their ages, appearance, courtesy and empathy (affective). The
perfect reliability facility which is not up to date, but are capable of carrying out the task, may
19
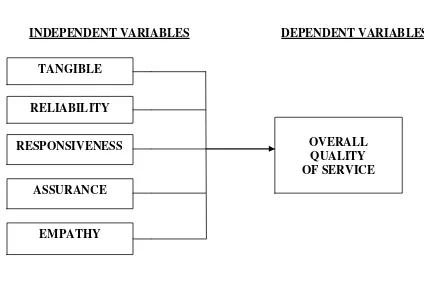
2.6 Research Framework
This study involves five (5) variables. Five (5) variables are the independent variables
and one (1) is dependent variable.
Independent variables consists of five (5) dimensions of service quality namely tangibles,
reliability, responsiveness, assurance, and empathy. On the other hand, the independent variable
is the overall service quality.
Those variables can be shown in Figure 1.
INDEPENDENT VARIABLES DEPENDENT VARIABLES
Figure 1: Schematic Diagram for Theoretical Framework Model TANGIBLE
RESPONSIVENESS RELIABILITY
ASSURANCE
EMPATHY
20
2.7 Research Hypothesis
The hypotheses for this study are:
H1 : The higher the tangibility of the service provided, the higher is the service quality
perceived by the students.
H2 : The higher the reliability of the service provided, the higher is the service quality
perceived by the students.
H3 : The higher the responsiveness of the service provided, the higher is the service quality
perceived by the students.
H4 : The higher the assurance of the service provided, the higher is the service quality
perceived by the students.
H5 : The higher the empathy of the service provided, the higher is the service quality
21
______________________________________________________________________________
3.1Introduction
This chapter explains the method that is being used in this study. It includes the research
design, population and samples, instrumentation, data collection procedures and technique of
data analysis.
3.2Research Methodology
This study is the cross-sectional study whereby data are collected once. In addition, this
study looks at the relationship between all the five (5) dimensions of service quality such as
tangible, reliability, responsiveness, assurance and empathy (independent variables) with the
22 3.3 Population and Sample
The population of this study are all the students at Universiti Utara Malaysia with the
average total of 20,000 students. It includes students from the entire program offered and from
the first until the final year students.
The sample of this study is the undergraduate and postgraduate students of UUM COB.
Respondents are selected based on the convenience sampling due to the time constraints.
Respondents were the students that are dealing with Students’ Residential Hall, College of
Business, UUM.
The respondents are limited to those who are staying only at the Students’ Residential Hall,
UUM COB. Students’ Residential Hall which is consist of eight (8) Students’ Residential Hall
namely DPP MAS, DPP TNB, DPP PROTON, DPP TRADEWINDS, DPP PETRONAS, DPP
EON, DPP TM and DPP SIME DARBY. The total of UUM COB students who are legally
23 3.4 Questionnaire Design
This study adpoted the instruments that have been developed by Parasuraman et. al.,
1985. It is argued that with the minor modification, these instrument can be adapted to any
service organizations (Parasuraman et. al., 1985, 1998; Brown et. al., 1993; Joseph & Joseph,
1997; Pariseau & McDaniel, 1997; Oldfield & Baron, 2000; Wisniewski, 2001).
The survey involved statements relating to students’ perceptions, evaluated on a five (5) point of
Likert Scale ranging from 5-strongly agree and 1-strongly disagree. Questionnaires will be
divided into three (3) sections, where Section A captured demographic information; Section B
captured information about students’ perception towards service provided. On the other hand,
Section C captured information regarding overall and personal perception towards service
provided.
Section 1: Demographic Information
This section consisted of six (6) questions to obtain respondents’ demographic
information. Questions asked are related to age, gender, race, level of study at UUM, current
24 Section 2: Students’ Perception of Service
This section consisted of 25 statements to assess student’s perception towards service
received across five (5) dimensions that are tangibles, reliability, responsiveness, assurance and
empathy.
Section 3: Summary Information
This section consisted of two (2) items of overall evaluation about quality of service and
personal level of satisfaction on quality of services provided by the administrative or
management of College of Business, UUM.
For each statement in Section 2, Likert Scale score is being used ranging from 1 to 5 represented
in Table 3 as stated below:
Table 3: Likert Scale for SERVQUAL items
SCALE SCORE
Strongly Agree 5
Agree 4
Neutral 3
Disagree 2
25
Each statement in Section 3 used Likert Scale score ranging from 1 to 5 represented as
shown in Table 3.1 as stated below:
Table3.1: Likert Scale Score for Question 1 and 2 in Section 3
__________________________________________________________
SCALE SCORE
Excellent 5
Good 4
Neutral 3
Poor 2
Very Poor 1
3.5 Data Collection Procedures
The data collected for this study is based on two (2) types of data namely Primary Data
and Secondary Data. The Primary Data is collected through questionnaires while Secondary Data
is collected through library research from the journals, thesis and books.
Data collections were done within 1-2 weeks. 100 self-administered questionnaires were
distributed at the counter of this Students’ Residential Hall such as DPP MAS, DPP TNB, DPP
PROTON, DPP TRADEWINDS, DPP PETRONAS, DPP EON, DPP TM and DPP SIME
26 3.6 Technique of Data Analysis
Data in this study were analyzed by using descriptive and inferential statistical methods.
Descriptive methods were used to describe behavior of data in general and some inferential
analysis was performed to understand the relationship among variables.
All the premier data in this study were processes by using the Statistical Packages for Social
Science (SPSS) version 12.0 software.
Descriptive statistics were used to describe or understand about demographics profile of
respondent. Besides that, the same method was used to study about dimensions of variables. This
indicates the used of mean and median. Meanwhile correlation and regression analysis were used
27
______________________________________________________________________________ 4.1Introduction
This chapter discussed the results obtained from this study.
4.2Profile of The Respondents
This study has a total number of 96 respondents. The results are shown in Table 4. Table 4 shows that the highest percentage (90.6%) of respondents’ age ranges from 20-25 years old followed by the students’ age in range between 20-30 years old. Only 4.2% respondents’ had the age less than 20 years old.
28
In this study, the number for undergraduate students (92%) is higher than the postgraduate students (7.3%). Majority of the respondents were in semester four (4) (36.5%), followed by the semester two (2) students (27.1%), semester six (6) students (17.7%), semester three (3) students (7.3%), semester five (5) students (5.2%), semester seven (7) and above students (4.2%) and the lowest percentage (2.1%) was in semester one (1).
29
4.3The Average and Standard Deviations of Dimensions of Service Quality
Students’ perception on the quality of service at Students’ Residential Hall, UUM COB are measured on five (5) dimensions:
i. Tangibles iv. Assurance
ii. Reliability v. Empathy
iii. Responsiveness
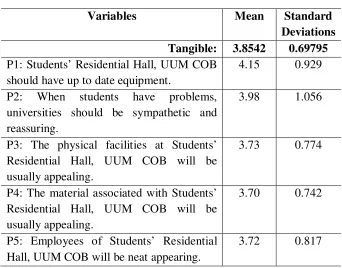
These perceptions are tabulated in Table 4.1 until Table 4.6. The first dimension (tangible) is rated as satisfied by the students. The average score for this dimension is 3.8542 where students tend to feel that the equipment at the halls were up to date. This is show as in Table 4.1:
Table 4.1: The Average and Standard Deviations of Dimensions of Service Quality
Variables Mean Standard
Deviations Tangible: 3.8542 0.69795 P1: Students’ Residential Hall, UUM COB
should have up to date equipment.
4.15 0.929
P2: When students have problems, universities should be sympathetic and reassuring.
P4: The material associated with Students’ Residential Hall, UUM COB will be usually appealing.
3.70 0.742
P5: Employees of Students’ Residential Hall, UUM COB will be neat appearing.
30
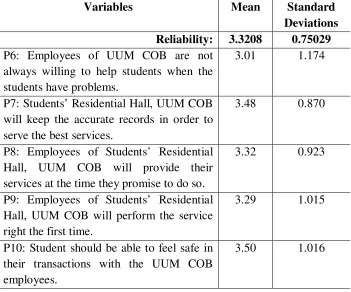
The second dimension (reliability) has the mean of 3.3208. This means that the student moderately feels that there is no courtesy’s attitude among the UUM COBs’ employees. It implies the employees are not always willing to help students when they have problems. This is show as in Table 4.2:
Table 4.2: The Average and Standard Deviations of Dimensions of Service Quality
Variables Mean Standard
P7: Students’ Residential Hall, UUM COB will keep the accurate records in order to serve the best services.
3.48 0.870
P8: Employees of Students’ Residential Hall, UUM COB will provide their services at the time they promise to do so.
3.32 0.923
P9: Employees of Students’ Residential Hall, UUM COB will perform the service right the first time.
3.29 1.015
P10: Student should be able to feel safe in their transactions with the UUM COB employees.
31
“Responsiveness” is the third dimension for the research framework. From the mean score of 3.4542, it means that the students are satisfied with the quality of services that provided by the UUM COBs’ employees This is show as in Table 4.3:
Table 4.3: The Average and Standard Deviations of Dimensions of Service Quality
Variables Mean Standard
Deviations Responsiveness: 3.4542 0.4855 P11: Employees of Students’ Residential
Hall, UUM COB will never be too busy respond to the student request.
3.45 0.869
P12: Employees of Students’ Residential Hall, UUM COB will always willing to help students.
3.42 0.925
P13: Employees of Students’ Residential Hall, UUM COB will give prompt to student.
3.36 0.860
P14: The employees should not be expected to have operating hours convenient to all their students.
3.56 0.892
P15: Employees of Students’ Residential Hall, UUM COB do not give you individual attention.
32
The average score of the fourth dimension (Assurance) is rated 3.5125. It means that in average the students also satisfied with the UUM COBs’ employees that provided the good quality of services to the students itself. For example, most of the employees can be trusted and they are knowledgeable. This is show as in Table 4.4:
Table 4.4: The Average and Standard Deviations of Dimensions of Service Quality
Variables Mean Standard
Deviations Assurance: 3.5125 0.60441 P16: Employees of Students’ Residential
Hall, UUM COB will have knowledge to answer the students’ questions.
3.63 0.771
33
The last dimension in this study is empathy with mean = 3.5354. It is also rated as satisfied by the UUM COBs’ students. It shows that students are willing to place their excellent Students’ Residential Hall at their heart. This is show as in Table 4.5:
Table 4.5: The Average and Standard Deviations of Dimensions of Service Quality
Variables Mean Standard
Deviations Empathy: 3.5354 0.64596 P21: It is unrealistic to expect employees to
know what the needs of their students are.
3.20 0.947
P22: Students’ Residential Hall, UUM COB does not have operating hours convenient to all its students.
3.41 0.936
P23: An excellent Students’ Residential Hall, UUM COB will have employees who give students personal attention.
3.55 0.950
P24: Excellent Students’ Residential Hall of UUM COB will always understand the specific needs of students.
3.74 0.885
P25: Excellent Students’ Residential Hal of UUM COB willingness to place the interest of the student at heart.
34
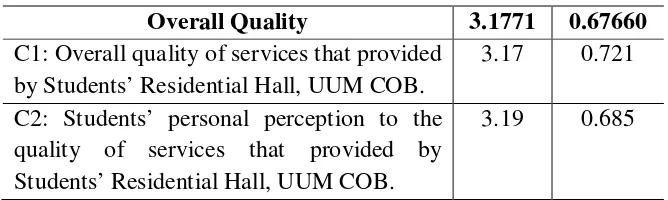
Finally, the overall quality was measured in order to identify whether UUM COBs’ Residential Halls are in good performance. The obtained results in Table 4.6 showed that the overall quality is good with the average score 3.1771. This value represents that the UUM COBs’ students are satisfied with quality of service provided by the UUM COBs’ and their respective residential hall.
Table 4.6: The Average and Standard Deviations of Dimensions of Service Quality
Overall Quality 3.1771 0.67660 C1: Overall quality of services that provided
by Students’ Residential Hall, UUM COB.
3.17 0.721
C2: Students’ personal perception to the quality of services that provided by Students’ Residential Hall, UUM COB.
3.19 0.685
4.4The Average and Standard Deviations of Dimensions of Service Quality
35
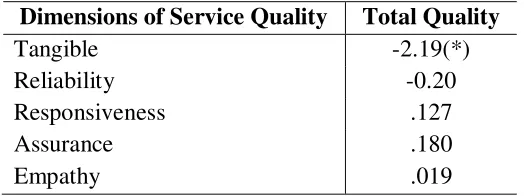
The correlation table measured the linear relationship between each dimension and the total quality. However, it is best to measure the total quality based on a single regression model with all dimensions occur simultaneously. Result from regression analysis shows that the best fit model is:
Total Quality = 0.884 Assurance.
This model has R2 = 0.942 and F-value= 1542.124**. This shows that the independent variables contribute 94% to the dependent variable. In other words, it means that 94% of the perception on service quality is contributed by the independent variable.
Table 4.7: Correlations between Dimensions of Service Quality and Total Quality
Dimensions of Service Quality Total Quality
Tangible -2.19(*)
Reliability -0.20
Responsiveness .127
Assurance .180
Empathy .019
36
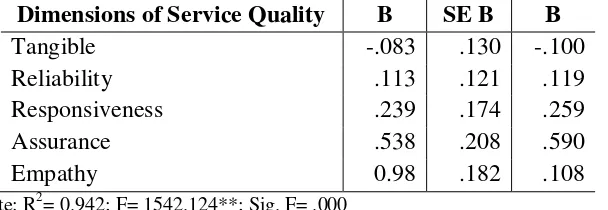
4.5Regression Analysis between Dimensions of Service Quality and Total Quality
From the five (5) dimensions of the independent variables, it shows that only assurance is significantly related to service quality (β= 0.59). The other four (4) dimensions show non-significant result.
Table 4.8: Summary of Multiple Regression Analysis between Dimensions of Service Quality and Total Quality (N= 96)
Dimensions of Service Quality B SE B Β
Tangible -.083 .130 -.100
Reliability .113 .121 .119
Responsiveness .239 .174 .259
Assurance .538 .208 .590
Empathy 0.98 .182 .108
Note: R2= 0.942; F= 1542.124**; Sig. F= .000
37 5.1Introduction
This chapter discusses the findings of this study. It also underlined some recommendations and lastly an overall conclusion is being made.
5.2Discussions
As stated earlier, the main purpose of his study is to determine the Students’ Perception Towards the Quality of Services Provided by Students’ Residential Hall, College of Business, UUM based on five (5) dimension of service quality which introduced by Parasuraman et. al (1985. 1989). Hence, the outcome of this study can be benchmark for the management to improve their quality of services that provided to the students of UUM COB.
38
perceived by the students. Results from the correlation analysis showed that only tangibility is significantly correlated to the total quality of services whereas, results from regression analysis showed that assurance as an important indicator to explain the total of services.
Based on the correlation analysis, tangible has been identified as the most important indicator as compared to other four (4) independent variables; reliability, responsiveness, assurance and empathy. It shows that students in this campus especially for those who are staying at Students’ Residential Hall, College of Business, UUM will form their impression about quality of service with the management of UUM COB that they deal through the tangibility aspect of the services offered. Besides that, with all the equipments and facilities are up to date and in a good condition, students will feel more comfortable and tend to satisfied with the services that they perceived.
Based on the regression analysis, it showed that only the “assurance” dimensions showed a significant relationship in explaining the perception on the total of services. This indicates that students need knowledgeable and courtesy staff to deal with them. For students, they perceived the quality of the service given is good based on their judgement on the knowlegability and courtesy of the staff when they interacted with them.
39
the good services to students since students deserve to have it. This is because students are the ‘main customer’ to the university.
5.3Recommendations
There are few recommendations to improve quality of service of Students’ Residential Hall, College of Business, UUM. The recommendations as stated below:
Firstly, excellent service is an integral to an organization’s future. Effective and efficient service provided by any organization will lead to customer satisfaction. Previous research found that there is a significant relationship between service quality and customer satisfaction level. Quality service can be the long term strategy to convince customers about the service offered by an organization.
40
Another way to improve the quality of services that is being provided by the organization, is through creating a “courtesy campaign” such as “customer friendly” program. This will encourage all the staff realize that students are the ‘main priority’ in daily business operation.
The management of UUM COB should take a smart action such as to organize any motivational programs purposely targeted at their administrative staff. These motivational programs can encourage the staff to work smart, built self esteem and increase their level of confidence in order to serve and provide good quality services to the students.
5.4Conclusion
41
Universiti Utara Malaysia is now moving towards “World Class University” and wanted to be known as the best management university among other higher learning institution in this country. In order to achieve these goals, UUM should plan and implement the best strategy towards provided and deserve the high quality of services to their main customers which are the student itself. Knowledge and courteous employees will develop customer trust and confidence. Therefore, the university should train their employees on how to serve good quality services to the students. In this relation, employees should keep their promise because student insists to get service as promised by the staff. This will give good impression from students of the services that is being provided to them.
42
Bateson, (1985). Management Service Marketing: Text and Reading, 3rd ed. Orlando. The Dryen Press.
Berry, L.L, Zeithaml, V.A, and Parasuraman, A. (1990). Five Imperatives for Improving Service
Quality. Sloan Management Review. Vol. 29, 29-38.
Curry and Sinclair, E. (1992). Assessing the Quality of Physiotherapy Services Using
SERVQUAL. International Journal Healthcare Quality Assurance. Vol. 15 No.5, 197-205.
Denton, K. (1989). Quality Service. Gulf Publishing Co. USA.
Didomenico, E. and Bonnici, J. (1996, Spring). Assessing Service Quality within the Educational
43
Frost, F.A. and Kumar, M. (2000). INTERSERVQUAL- An International Adaption of the Gap
Model in A Large Service of Organization. Journal of Services Marketing. Vol. 14 No. 5,
358-377.
Garvin, D.A. (1983). Managing Quality. The Strategic and Competitive Edge. New York: Free
Press.
Hendershott, A., Wright, S., and Henderson, D. (1992). Quality of Life Correlates for University
Student. NASPA Journal, 30 (I): 10-19.
Joseph, M. and Joseph, B (1997). Service Quality in Education: A Student Perspective. Quality
Assurance in Education. Vol. 5, No.1, 15-21.
Leonard L. Berry, A. Parasuraman, and A. Zeithaml (1998). The Service Quality Puzzle.
Business Horizon. 35-43.
Leonard L. Berry, Zeithaml. A, & Berry, L.l (Summer 1990). Five Imperatives for Improving
44
Mary Jo Bitner, Valarie A. Zeithaml. (2000) Customer Contributions Roles in Service Delivery.
International Journal of Service Industry Management. Vol.8, No. 3, 193-205.
Oldfield, B.M and Baron, S. (2000). Student Perception of Service Quality in UK University
Business and Management Faculty. Quality Assurance in Education. Vol. 8, No.2, 41-50.
Oliver, Richard L; Rust, Roland T. Customer Delight: Foundations, Findings, and Managerial
Insight. Journal of Retailing, Vol. 73(3), pg. 311-336.
Parasuraman (1985). Problems and Strategies in Service Marketing. Journal of Marketing. Vol.
49, 33-46.
Parasuraman, A., Zeithaml, A. & Berry, L.l (1985). A Conceptual Model of Service Quality and
It’s Implication for Future Research. Journal of Marketing. Vol. 49, No. 31, 41-50.
Parasuraman, A., Zeithaml, V.A and Berry L.L (1998). SERVQUAL: A Multiple-Item Scale for
45
Pariseau, S.E and McDaniel, J.R (1997). Assessing Service Quality in School of Business.
International Journal of Quality & Reliability Management. 14 (3): 64-218.
Sasser (1982). Management of Service Operations. Text and Cases Boston: Ally and Bacon.
Smith, R. Ennew, C. (2001, January). Service Quality and Its Impact on Word of Mouth
Communication in Higher Learning [online]. Available:
http://www.unim.nothing.ac.uk/dbm/papers/2001-01.pdf (2002, Sept, 15).
Wisniewski, M (2001). Using SERVQUAL to Assess Customer Satisfaction with Public Sector
Services. Managing Service Quality. 11 (6): 380-388.
Zeithaml, V.A., L.L. and Parasuraman, A. (1996, April). The Behavioral Consequences of
Service Quality. Journal of Marketing. Vol. 60, 31-46.
Zeithmal, Parasuraman, Berry (June 1985). Quality Counts in Services, Too. Business Horizons.
COLLEGE OF BUSINESS, UUM ______________________________________________________________________________
JUN 2009
Dear students,
I’m a final semester student of Master of Science (Management), College of Business, Universiti
Utara Malaysia. I would like to invite you to participate in a survey on “A Study on Students’
Perception towards the Quality of Services provided by the Students’ Residential Hall,
Universiti Utara Malaysia.”
The purpose of this study is to determine Students’ Perception towards Service Quality at
Students’ Residential Halls, College of Business, Universiti Utara Malaysia.
This survey is undertaken for academic purpose and part of my graduation. To ensure your
confidentially, you are not required to write your name on the questionnaire. I really hope that
you will spend your time in order to participate in this study by completing all the attached
questionnaires and return it to the representative who gives you this questionnaire.
Thank you very much for your time and your co-operations in participating in this survey.
Yours sincerely,
NURUL HAMIZA BINTI HAMZAH (S88311)
Master of Science (Management)
College of Business
COLLEGE OF BUSINESS, UUM ______________________________________________________________________________
SECTION 1
Please answer the following questions concerning your demographic. Please circle for each question.
5. Semester 6. Highest level of education
COLLEGE OF BUSINESS, UUM ______________________________________________________________________________
SECTION 2: PERCEPTION
The following statements relate your feeling about your Students’ Residential Hall, College of Business, UUM. Please show the extend to which you think that the College of Business, UUM should possess the feature described by each statement below. Each of the statement was accompanied by 5 point of scale, from “Strongly Disagree” (1) and “Strongly Agree” (5). Please circle the appropriate answer.
There are no right or wrong answers.
Strongly Disagree Partly Agree/ Agree Strongly
Disagree Disagree Agree
1 2 3 4 5
Tangibles
P1 Students’ Residential Hall, UUM COB should have up-to-date equipment.
1 2 3 4 5
P2 When students have problems, universities should be sympathetic and reassuring.
1 2 3 4 5
P3 The physical facilities at Students’ Residential Hall, UUM COB will be usually appealing.
1 2 3 4 5
P4 The material associated with Students’ Residential Hall, UUM COB will be visually appealing.
1 2 3 4 5 students when the students have problems
1 2 3 4 5
P7 Students’ Residential Hall, College of Business will keep the accurate record in order to serve the best services.
1 2 3 4 5
P8 Employees of Students’ Residential Hall, UUM COB will provide their services at the time they promise to do so.
1 2 3 4 5
P9 Employees of Students’ Residential Hall, UUM COB will perform the service right the first time.
1 2 3 4 5
P10 Students should be able to feel safe in their transactions with UUM COB’s employees.
COLLEGE OF BUSINESS, UUM ______________________________________________________________________________
Responsiveness
P11 Employees of Students’ Residential Hall, UUM COB will never be too busy respond to student request.
1 2 3 4 5
P12 Employees of Students’ Residential Hall, UUM COB will always be willing to help student.
1 2 3 4 5
P13 Employees of Students’ Residential Hall, UUM COB will give prompt to student.
1 2 3 4 5
P14 The employees should not be expected to have operating hours convenient to all their students.
1 2 3 4 5
P15 Employees of Students’ Residential Hall, UUM COB do not give you individual attention
1 2 3 4 5
Assurance
P16 Employees of Students’ Residential Hall, UUM COB will have knowledge to answer the student questions.
1 2 3 4 5
P17 Employees of Students’ Residential Hall, UUM COB will be courteous with the student.
1 2 3 4 5
P18 The employees of your Students’ Residential Hall, UUM COB can be trusted.
1 2 3 4 5
P19 The employees of your Students’ Residential, UUM COB does not tell students exactly when services will be performed.
1 2 3 4 5
P20 When UUM COB promise to do something by a certain time, they (employees) should do so.
1 2 3 4 5 operating hours convenient to all its students.
1 2 3 4 5
P23 An excellent Students’ Residential Hall of UUM COB will have employees who give students personal attention.
1 2 3 4 5
P24 Excellent Students’ Residential Hall of UUM COB will always understand the specific needs of the students.
1 2 3 4 5
P25 Excellent Students’ Residential Hall of UUM COB willingness to place the interest of the student at heart.
COLLEGE OF BUSINESS, UUM ______________________________________________________________________________
SECTION 3: SUMMARY INFORMATION
1. I found the overall quality of services that provided by College of Business, UUM:
Very Poor Slightly Good Excellent
Poor good
1 2 3 4 5
2. Your personal perception to the quality of services that provided by your Students’ Residential Hall, UUM COB:
Very Poor Slightly Good Excellent
Poor good
1 2 3 4 5
53
BACKGROUND OF RESPONDENTS
Statistics Table of Background of Respondents:Age
Frequency Percent Valid Percent
Cumulative
Frequency Percent Valid Percent
Cumulative
Frequency Percent Valid Percent
54
Specify others
Frequency Percent Valid Percent
Cumulative
Indicate your study level at UUM
Frequency Percent Valid Percent
Cumulative
Frequency Percent Valid Percent
Cumulative
Frequency Percent Valid Percent
55
Frequency Percent Valid Percent
Cumulative
Frequency Percent Valid Percent
56
Tangibles: Employees will be neat appearing
Frequency Percent Valid Percent
Cumulative
Tangibles: Material associated will be visually appealing Frequency Percent Valid Percent
Cumulative
Tangibles: Employees will be neat appearing
Frequency Percent Valid Percent
57
Reliability: Employees are not always willing to help students Frequency Percent Valid Percent
Cumulative
Frequency Percent Valid Percent
58
Reliability: Provide services at the time
Frequency Percent Valid Percent
Cumulative
Reliability: Employees will perform the service right the first time Frequency Percent Valid Percent
Cumulative
Reliability: Students feel safe in their transactions
Frequency Percent Valid Percent
59
Frequency Percent Valid Percent
Cumulative
Frequency Percent Valid Percent
60
Responsiveness: Employees will give prompt to student Frequency Percent Valid Percent
Cumulative
Frequency Percent Valid Percent
Cumulative
Responsiveness: Do not give individual attention
Frequency Percent Valid Percent
61
Assurance: Know how to answer question
Frequency Percent Valid Percent
Cumulative
Frequency Percent Valid Percent
62
Assurance: Can be trusted
Frequency Percent Valid Percent
Cumulative
Assurance: Doesn't tell student when service will be performed Frequency Percent Valid Percent
Cumulative
Frequency Percent Valid Percent
63
Empathy: Unrealistic to expect students' needs
Frequency Percent Valid Percent
Cumulative
Frequency Percent Valid Percent
64
Empathy: Give personal attention
Frequency Percent Valid Percent
Cumulative
Frequency Percent Valid Percent
Cumulative
Empathy: Willingness to place the students' interest
Frequency Percent Valid Percent
65
Frequency Percent Valid Percent
Cumulative
Frequency Percent Valid Percent
67
Descriptive Statistics
N Mean Std. Deviation
Tangible 96 3.8542 .69795
Reliability 96 3.3208 .75029
Responsiveness 96 3.4542 .64855
Assurance 96 3.5125 .60441
69
Empathy, Reliability, Responsiveness, Tangible, Assurance(a) . Enter a All requested variables entered.
b Dependent Variable: Total of Quality c Linear Regression through the Origin Model Summary(c,d)
a For regression through the origin (the no-intercept model), R Square measures the proportion of the variability in the dependent variable about the origin explained by regression. This CANNOT be compared to R Square for models which include an intercept.
b Predictors: Empathy, Reliability, Responsiveness, Tangible, Assurance c Dependent Variable: Total Quality