Proceeding of International Conference On Research, Implementation And Education Of Mathematics And Sciences 2014, Yogyakarta State University, 18-20 May 2014
THE EFFECT OF TELLURIUM ATOMIC FRACTION ON THE CRYSTAL
STRUCTURE AND CHEMICAL COMPOSITION OF Pb (Se1-x, Tex)
SEMICONDUCTOR MATERIALS PREPARED USING BRIDGMAN
TECHNIQUE
Ariswan and Denny Darmawan
Physics Department, Faculty of Matematics and Sciences Yogyakarta State University
Abstrak
This study aimed to determine the effect of atomic fraction x of tellurium (Te) on the lattice parameters and the crystal structure of the Pb (Se, Te) compound prepared using Bridgman technique. Further characterization of the materials used X-Ray Difraction to determine the lattice parameters and the crystal structure. The chemical composition was determined using Energy Dispersive Spectroscopy (EDS), and the surface morfology shown by Scanning Electron Microscope (SEM). The results showed that all compounds crystallized in a cubic crystal structure and the lattice parameters of the crystal were a function of the fraction x of Tellurium atoms. EDS results showed that all samples were non stoichiometric but approached ideal composition. All compounds had identical surface because it had a cubic structure with homogeneous materials.
Keywords : Bridgman technique, lead , selenium and Tellurium
Introduction
Semiconductor materials have electrical conductivity between insulators and conductors. They are widely used in electronic circuits since their electrical properties can be easily changed by adding some impurities. These impurities are called dopant and created by adding different material using several technique like diffusion, ionic implantation, melting, etc. Each semiconductor material has certain physical, optical and magnetic characteristics, so its application should consider these characters. For an example, in ultraviolet sensor application which need high sensitivity, materials with wide energy gap are chosen such as gallium nitride with 3,4 eV energy gap [1].
Research in semiconductors, especially in sillicon (Si) and germanium (Ge) application, has already been well established. Research on other semiconductor materials is also rapidly underway. It is aimed at producing variation in semiconductor materials for various application. One of the research is on the lead chalcogenides group IV-VI compounds such as PbS, PbTe, PbSe, PbSeTe which their material properties and also their application are heavily studied [2, 3].
Research on ZnO, GaN, AlGaN, AlGaSb, PbS, PbTe and PbSe are widely conducted. The last three have similarity, that is n-type semiconductor produced from combining group IV (Pb) with group VI (Se, S, Te). PbS, PbTe, and PbSe each has energy gap of 0.41 eV, 0.32 eV and 0.29 respectively [4, 5] which is well suited to control application: non-contact temperature
measurement, humidity control, spectrophotometry, medical imaging, infrared detector, laser semiconductor and thermoelectric [6].
This research focus on the study of massive Pb(Se, Te) system material prepared using Bridgman technique. The concept of preparation is temperature adjustment by considering the melting point of the basic materials. In this process, several samples with different heating patterns were used. It was aimed to determine the quality and lattice parameter of crystal, and to determine chemical composition and the best surface morphology structure of the samples. The choice of Pb(Se, Te) in this research is meant to be used as the basic materials in building optoelectronic devices for infrared detectors, laser semiconductors and thermoelectric.
Methods
Massive semiconductor preparation process, which was crystal growth process, was supposed to give perfect crystals with high purity which will improve the device quality pepared. In preparing massive alloys, there are two crystal growth methods: Czockalski and Bridgman method. Crystal growth process using Czockalski method is quite complex and need expensive apparatus in university’s laboratory scale. On the other hand, the Bridgman method, first introduced by Lowman using closed quartz capsul, is cheap and the apparatus is easier to be made. The superiority of Bridgman technique to Czockalski technique is that this technique can produce massive semiconductor materials with affordable cost for the laboratory. In addition, its temperature can be controlled easily, the materials freezing rate can be adjusted, the rate of temperature decrease from liquid phase can be accurately controlled, and mechanical stress in the material can be reduced to avoid the crack in the preparation capsul in order to reduce the explosion hazard produced by certain substances at their critical temperature. This method can be conducted in two ways: the horizontal Bridgman method and the vertical Bridgman method. Their difference is in the position of the capsul inside the furnace in heating process.
Variables in this preparation stage were the vacuum pressure (in Torr) and time (in second) as the controlled variables, Pb(Se, Te) materials preparation temperature with maximum value of 500 0C and the heating pattern as the independent variables, and the crystal structure, lattice parameter, chemical composition, and surface morphology of massive Pb(Se, Te) alloy as the dependent variables.
The research consisted of several steps:
Materials Preparation
This process consisted of tube washing and material weighing. Material weighing was done for Pb, Se and Te using molar ratio. It started with Te mass, then for Pb (Se1-x,Tex)
compound the mass for lead (Pb) and selenium (Se) can be calculated using
Proceeding of International Conference On Research, Implementation And Education Of Mathematics And Sciences 2014, Yogyakarta State University, 18-20 May 2014
point of all substance, which is 500 oC with temperature pattern was chosen according to the available time in the laboratory. One of the heating pattern in the material preparation was that the material was heated until it reached 250 oC and kept for 4 (four) hours. Next, it heated until 500 oC and kept for 5 (five) hours and then the furnace was switched off so it would underwent temperature decrease until it reach room temperature in 6 (six) hours.
Materials characterization
To determine the crystal structure of the alloys using X-Ray Diffraction (XRD), Shimadzu XRD-600 was used. The data obtained in the XRD characterization were in the form of difractogram. It showed the intensity as a function of diffraction angles (2θ). How the XRD
works was started by putting the samples on the stationary holder, then X-ray was struck to the samples at certain wavelength so that diffraction waves were produced for certain crystal planes. The diffracted beam resulting in difractogram followed the Bragg’s diffraction law 2d
sin q = n l, with n is integers (1, 2, 3, ...), d is the distance between crystal planes, q is the diffraction angle and l is the x-ray wavelength. In this research, the source of the XRD was Cu with wavelength of 154060 Ǻ. Parameters used in the XRD were operational voltage of 40 kV, current of 30 mA, and angles 2θbetween 0º to 90º.
The diffractogram was then compared to the JCPDS (Join Committee on Powder Diffraction Standard) data, so the hkl planes from the samples were obtained. The value of lattice constants (a, b, c) were determined using analytical method [7] by looking for the same values in the sin2 q value. This can be done since for the cubic system, the distance between two crystal planes (hkl) can be stated by 1/d2 = (h2+k2+l2)/a2. If the Bragg’s law is subtituted into the equation, it produces sin2q = A (h2+k2+l2)/a2 with A = l2/4a2. So a = l/2√A which is the same value in sin2q for various diffraction angles q [7]. Next, the molar ratio, which is the real chemical composition, was determined directly from the analysis of the Energy Dispersive Analysis of X-ray (EDAX) results, and the surface morphology of the sample was determined from the Scanning Electron Microscope (SEM) test. Both analysis were done using integrated device the Jeol JSM-636 OLA.
Results and Discussion
XRD characterization was used to determine the characteristic of the crystal, that is, the structure and the lattice constant a, b, c of the massive or ingot produced in the Pb(Se,Te)
heating using Bridgman technique. Data obtained from it were in the form of diffractogram, graphs describing the relation between intensity (I) of the spectrum peak of the crystal and the diffraction angles (2θ). The distance between planes (dhkl) determined from the diffraction peaks
is listed in Table 1.
Diffraction intensity from Bragg’s law requires that the path difference from the diffracted rays must be in the integer of the X-ray wavelength, but also depends on atomic and crystalline structure. From this condition, the type of Bravais lattice can be determined. It will be in the simple cubic Bravais lattice if the diffraction peaks gives all the available (hkl) planes. It will be in the body-centered cubic (bcc) Bravais lattice if the diffraction intensities show the summation of integers h+k+l, and if h, k, l are totally odd or totally even then the crystal has a face-centered cubic (fcc) Bravais lattice.
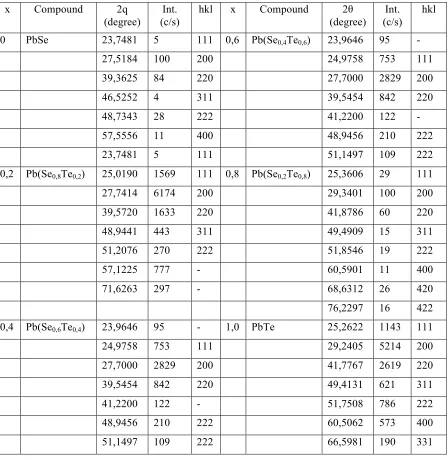
This peak relates to 2q angle around 29,24o and this value decreases to the domination of Se atom, which is in the PbSe the value become 27,51o. The same thing happens to the other diffraction peaks. For example, the second dominant peak at the 2q angle of 41,77o relates to plane (220) in PbTe and decreases to 39,36o in PbSe and relates to the same plane, which is (220).
Table 1. Diffraction angles and (hkl) plane related to Pb(Se1-xTex)
x Compound 2q
(degree)
Int. (c/s)
hkl x Compound 2θ
(degree)
Int. (c/s)
hkl
0 PbSe 23,7481 5 111 0,6 Pb(Se0,4Te0,6) 23,9646 95 -
27,5184 100 200 24,9758 753 111
39,3625 84 220 27,7000 2829 200
46,5252 4 311 39,5454 842 220
48,7343 28 222 41,2200 122 -
57,5556 11 400 48,9456 210 222
23,7481 5 111 51,1497 109 222
0,2 Pb(Se0,8Te0,2) 25,0190 1569 111 0,8 Pb(Se0,2Te0,8) 25,3606 29 111
27,7414 6174 200 29,3401 100 200
39,5720 1633 220 41,8786 60 220
48,9441 443 311 49,4909 15 311
51,2076 270 222 51,8546 19 222
57,1225 777 - 60,5901 11 400
71,6263 297 - 68,6312 26 420
76,2297 16 422
0,4 Pb(Se0,6Te0,4) 23,9646 95 - 1,0 PbTe 25,2622 1143 111
24,9758 753 111 29,2405 5214 200
27,7000 2829 200 41,7767 2619 220
39,5454 842 220 49,4131 621 311
41,2200 122 - 51,7508 786 222
48,9456 210 222 60,5062 573 400
51,1497 109 222 66,5981 190 331
Proceeding of International Conference On Research, Implementation And Education Of Mathematics And Sciences 2014, Yogyakarta State University, 18-20 May 2014
the diffractogram follows all odd or all even, thus the crystal follows the face-centered cubic Bravais lattice. Pb(Se,Te) produced in this research formed the cubic structure polycrystal with lattice constants are shown in Table 2, which is in a good agreement with literatures [8, 9]. The lattice constant is more dominant to Te or Se and obeys the 4th order polynomial as a function of Tellurium atom x:
a (Å ) = 6,1301- 0,183 x+ 0,354 x2+ 1,613 x3- 1,426 x4.
Table 2. Lattice Parameters for massive Pb(Se1-xTex) compound prepared
using Bridgman technique
Figure 1. Lattice constants relation to Te atomic fraction x in Pb(Se1-xTex) compound
The chemical composition of the materials is shown in Table 3, and the SEM results are shown in Figure 2.
Tabel 3. Chemical composition for Pb(Se1-xTex) compound
Figure 2. SEM results in surface morphology (a). PbSe, (b). Pb(Se0.8Te0,2),
(c ). Pb(Se0.6Te0,4), (d). Pb(Se0.5Te0,5), (e) Pb(Se0.4Te0,6) and (f) PbTe
(a). PbSe (b) Pb(Se0.8Te0,2)
(d) Pb(Se0.5Te0,5)
(f) PbTe (c). Pb(Se0.6Te0,4)
Proceeding of International Conference On Research, Implementation And Education Of Mathematics And Sciences 2014, Yogyakarta State University, 18-20 May 2014
EDS results shows that all samples are non stoichiometric and rich in tellurium or lack in Pb. From EDS results, the produced crystal grains size is unclear because of the technical problem so it cannot be zoomed in to 40,000 times. But the surface condition showed the homogeneity of the sample since all surface have the same colors.
Conclusion
From this research on Pb(Se1-xTex) semiconductor material preparation and characterization, we
can conclude that:
1. Pb(Se,Te) semiconductor has cubic structure, following face-centered cubic Bravais lattice with lattice constant a as a function of Te atomic fraction x given by
a (Å) = 6,1301- 0,183 x+ 0,354 x2+ 1,613 x3- 1,426 x4.
2. Results from EDAX showed that all samples had non-stoichiometric composition which was rich in Te with on some samples lack of Pb. Results from SEM showed homogeneity in composition and crystal patterns were emerged but no grains were visible on all sample since the zoom out until 40000 times was not done yet.
Reference
[1]. S.A. Kukushkin, A.V. Osipov, V.N. Bessolov, B.K. Medvedev, V.K. Nevolin, and K.A. Tcarik, Rev.Adv.Mater.Sci, 17(2008) p. 1-32
[2]. Kalika P.K, Research Journal of Materials Sciences, Vol. 1(1), Februari 2013, p.26-30
[3]. V. Arivazhagen, S. Rajesh, Chalcogenida Letters, Vol.7 No.7 Juli 2010, p.465-470
[4]. Isi P.O, Ekwo P.I, Reasearch Journal of Engineering Sciences, Vol 2(7), Juli 2013, 15-19
[5]. A.Saschchink, L. langof, R.Chaim, E.Lifshitz, Journal of Crystal Growth, 240 (2002), p. 431-438
[6].S.S Patil, P.H Pawar, Chalgogenide Letters, Vol.9,No.4, April 2012, p. 133-143
[7]. Suryanarayana and M. Grant Norton, X- Ray Diffraction A Practical Approach, (1998), Plenum Press New York and London, p.125-153.