www.elsevier.nl / locate / econbase
Fiscal effects of foreign aid in a federal system of
governance
The case of India
a ,* b a
Vinaya Swaroop , Shikha Jha , Andrew Sunil Rajkumar
a
Development Research Group, World Bank, Washington, DC 20433, USA
b
Indira Gandhi Institute of Development Research, Mumbai 400 065, India
Received 1 February 1998; received in revised form 1 December 1999; accepted 1 December 1999
Abstract
This paper models fiscal effects of foreign aid in a federal system of governance. Our main innovation is to incorporate the inter-governmental fiscal link in examining economic fungibility of foreign aid. The model is applied to the expenditure decisions of the central government of India. The two main findings are: (i) Foreign aid merely substitutes for spending that the government would have undertaken anyway; funds freed by aid are spent on non-development activities, and (ii) In passing earmarked external assistance to states, the central government makes a reduction in its transfers to states. These findings indicate that the central government’s expenditure choices are unaffected by external assistance. The implication for donors is that even though their development projects may be associated with very high rates of economic return, they could be assisting the central government in financing something very different at the margin. For the state governments, the finding indicates that they may not be reaping the full benefits of externally procured assistance.
2000 Elsevier Science S.A. All rights reserved.
Keywords: Foreign aid; Federal system; Fungibility; Development and non-development government expenditures; India
JEL classification: E62; O23
*Corresponding author.
E-mail address: [email protected] (V. Swaroop)
1. Introduction
An important objective of foreign aid earmarked for development purposes is to improve development outcomes in the targeted area in the recipient country. If, however, the preferences of the recipient government are different from those of the donor agency, the former can make aid ‘‘fungible’’ by reducing its own resources going to the activity which receives aid and using it for other purposes. If the structure of government is federal in the recipient country, this fungibility may also take the shape of changes in inter-governmental fiscal transfers. For example, knowing that a subsidiary government is receiving external assistance, the federal government could reduce its fiscal transfers to that lower level of government. There are a number of studies that have looked at the issue of foreign
1
aid fungibility. On the inter-governmental front an extensive literature has studied the fiscal effects of inter-governmental grant subsidy programs (see Gramlich (1977), McGuire (1978), Mieszkowski and Oakland (1979), Rosen (1988), Zou (1996) and others). However, no study has looked at the inter-governmental fiscal link in examining foreign aid fungibility. Our main innovation in this paper is to study the fungibility of foreign aid created through this link.
We model fiscal effects of foreign aid in a federal structure of government. The model is then applied to the expenditure decisions of India’s central government. In the past, several country studies have carried out econometric analyses of effects of aid on public expenditure, but in most cases the explanatory variables used are based on casual empiricism. Some researchers (e.g., Pack and Pack, 1996) have acknowledged that there is an economic behavior underlying their estima-tions, but they do not explicitly incorporate it in their analysis. In this paper, we develop a model of government behavior which yields estimable equations that can be compared with those in the literature. Using time-series data, we first estimate the influence of foreign aid on the level and composition of central government’s spending in India. Our main inquiry is: Assuming that aid is given
2
for development purposes, has it been spent as intended? In India, almost all external assistance (including funds earmarked for state governments) accrues to
1
In a mix of cross country and individual country experiences, Heller (1975), Cashel-Cordo and Craig (1990), Pack and Pack (1990, 1993, 1996), Gang and Khan (1991), Gupta (1993), Khilji and Zampelli (1994), and Feyzioglu et al. (1998), among others, have analyzed whether foreign assistance provided for specific purposes is shifted (contrary to the wishes of donors) by the recipient government. World Bank (1998) provides a good summary of the existing empirical studies on this topic.
2
3
the central government, which is also liable for any repayments. Concerns have been raised that states that procure externally aided projects are not able to reap the full benefits; central-government transfers to states are reduced when foreign aid is secured for states. In tracing the fiscal effects of foreign aid in India, it is therefore important to analyze the fiscal link between the central and state governments. Using a panel of time-series data across different states, we next examine the impact of aid resources acquired for state governments, on fiscal transfers from the central to the state governments.
In Section 2 of the paper we first define aid fungibility. We then develop an analytical framework in a federal system of governance that links foreign aid with various components of public expenditure and with inter-governmental transfers. In Section 3 we empirically examine the fiscal effects of foreign aid. Section 4 presents our concluding remarks.
2. A model of aid fungibility
To study the fiscal effects of foreign aid it is important to understand the concept of aid fungibility. Before formally developing the model, therefore, we
4
briefly discuss what it means for aid to be fungible.
2.1. Foreign aid fungibility: A definition
Suppose a developing country spends its total resources on a single private good, C , and two public goods, G and G . All three goods are assumed to bep 1 2
normal (non-inferior). Spending on G and G are characterized as non-develop-1 2
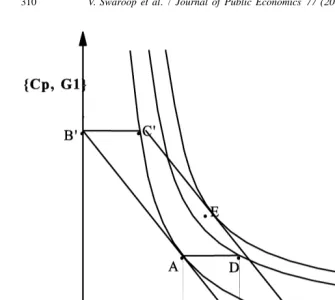
ment (consumption type) and development (investment type). In addition to its own resources, the country receives earmarked assistance towards the purchase of good G2 from a donor agency. This delineation of public spending reflects a functional distinction found in the budgets of most developing countries. More-over, aid to developing countries is mostly earmarked for capital related invest-ment type expenditure. Fig. 1 captures this scenario. BB9 represents allocation choices that can be financed from domestic resources, and given the preferences of the recipient country, point A represents the preferred resource allocation. Now
3
The average annual disbursement of aid – defined as grants and concessionary loans from all official bilateral and multilateral sources – to India in the 1990s has been close to 3 billion U.S. dollars, which is equivalent to roughly 4% of the combined spending of the central & state governments and public sector enterprises.
4
Fig. 1. A model of aid fungibility.
suppose a foreign agency gives aid for the exclusive purchase of the development good, G , which at the given price would purchase an amount F. While the donor2
agency would like the aid funds to be spent on G at the margin, for a variety of2
reasons, it is unable to determine the amount of good G that the recipient would2
have purchased in the absence of aid (i.e., the donor agency does know the allocation represented by the point A). Upon receiving aid, therefore, the recipient country could make it fungible by changing the level and composition of its public expenditure program.
If the recipient country can treat the entire aid amount as a pure supplement to its domestic resources, then aid is fully-fungible. As illustrated in Fig. 1, the post-aid resource constraint is B9C9C; the horizontal segment, B9C9, indicates that at least the aid amount has to be spent on G . The new optimal resource allocation2
is given by the point E. The latter indicates that in spending the acquired aid resources on good G , the country diverts some of its own resources from G to C2 2 p
while an increase in C implies that aid has a level effect on the budget, i.e., itp
leads to a reduction in taxes and a commensurate increase in private sector consumption. Suppose, on the other hand, the recipient country does not divert any of its resources away from the aided good while spending the earmarked aid on it. This could be due to the donor agency’s effective public expenditure monitoring process particularly if the size of aid in relation to the country’s total domestic resources is large. In such a case, aid is fully non-fungible. The optimal allocation mix of the country’s own resources is not influenced by the aid amount and point
A (in Fig. 1) continues to be the country’s preferred mix. More of G purchased2
from aid, however, increases the overall utility. The post-aid consumption point,
D, is on a higher indifference curve U . Finally, if the country can treat a portion,2
f(0,f ,1), of the aid as a resource supplement, then aid is said to be partially fungible and the fungible portion of the aid is given by f. In such a case, the post-aid resource line (not drawn in Fig. 1) moves out by the fungible amount. In choosing the optimal resource mix, the country includes the fungible amount as an additional resource supplement to be spent but disregards the non-fungible portion, 12f. Depending on the value of f, the final consumption point lies between points E(f 51) and D(f 50) in Fig. 1. Thus, economic fungibility of aid is defined as the recipient’s ability to treat earmarked aid as if it was a pure supplement to its domestic resources.
2.2. Foreign aid in a federal framework
Consider an economy which has a federal system of governance: a central government and a number, S, of state governments. At both levels, central and state, governments spend on each of the two categories of public good. As discussed above, spending on these goods can be characterized as non-develop-ment (consumption type) and developnon-develop-ment (investnon-develop-ment type) spending at the national and state levels. Foreign aid enters the model in the form of earmarked donor funds given to the central as well as the state governments for development programs. All assistance including funds earmarked for state programs, however, goes through the central government. Funds received for state projects by the central government are expected to be passed-on to the respective state govern-ments.
2.2.1. Resource allocation choice of the central government
The central government buys the two public goods – non-development (G ) and1
development (G ) – at prices p and p , respectively, and provides them to all of2 1 2
s
its citizens. In addition, it transfers to state s hs51,2, . . . ,Sj an amount p G2 2
earmarked for the purchase of G . This constitutes the total spending of the central2
government. In making these resource allocation decisions, it takes the prices, p1
and p , as given.2
c s
aid given to the central government and the s-th state government, respectively. Using our definition of fungibility, the central government can make foreign aid
c c c
fungible by treating a portionf (0#f #1) of a as its own revenue supplement and spending the proportion accordingly. Similarly, the central government can
s s s
treat a portion f (0#f #1) of a as fungible by making adjustments in the amount of earmarked transfer it gives to state s for the development good. The
c s
choices of f and f are determined by some strategic behavior of the central government which takes into account the penalty of being ‘‘caught’’ redirecting funds. We, however, do not model this strategic behavior in this paper and take the
f’s as given. Thus, the central government finances its total purchases by the fungible portion of foreign aid as well as its own domestically generated revenue,
R. The budget constraint faced by the central government can be written as
S S
s c c s s
p G1 11p G2 21
O
p G2 25R1f a 1O
f a (1)s51 s51
The left-hand side of Eq. (1) is total spending of the central government. The right-hand side is its total fungible funds. As explained above in Section 2.1, the
c c s s
non-fungible portions of aid, (12f )a and o(12f )a , do not augment government’s discretionary resources, but are used to purchase G . Also, while G2 2
– purchased from the non-fungible part of aid – increases overall utility, it does not affect the marginal choices of the central government. Subject to its budget
s
constraint, the central government chooses G , G and G to maximize the social1 2 2
welfare given by
1 2 S
W5W(U ,U , . . . ,U ), (2)
s
where U is the utility of the representative agent living in state s. In considering the resource allocation choice, we assume that the fiscal effects of foreign aid, if any, are restricted to changes in the composition of the government’s expenditure program but there are no level effects, i.e., aid has no impact on R. We later relax this assumption and model the level effects of aid through changes in R.
s s
The utility, U , is defined on the single private good, C , two categories ofp
s s
central (national) public goods and the two public goods ( g and g ) provided by1 2
state s.
s s s s s s
U 5U (C ,G ,G , g , g ,G )p 1 2 1 2 2 (3)
s s s
In choosing G , G and G , the central government takes as given R, g and g .1 2 2 1 2
Maximization of the social welfare function, W(.) subject to the budget constraint yields the first-order conditions, which with simple manipulation can be written as:
p1
s s
]
UG15
S D
p UG2 (4)n
a is the weight of state s’s utility in the social welfare function. Condition (4) implies that in determining the choice of G1 and G , the marginal rate of2
substitution between the two public goods must be the same as the economic rate of substitution (given by the price ratios). On the other hand, condition (5) equates at the margin, across states, the change in social welfare due to the change in the utility of the representative agent that results from a unit increase in centrally provided assistance towards the purchase of G .2
By specifying the functional form of the utility, Eqs. (1), (4) and (5) can be
s
solved to obtain demand equations for G , G and G . Given data, the parameters1 2 2
of the demand function and fungibility (included in the budgetary constraint relationship) can then be estimated to assess the impact of foreign aid on the budget composition. Moreover, we can estimate the impact of foreign aid on the level of the central government’s budget by letting R to be a function of aid (see below).
In the next sub-section, we discuss an econometric application of this model.
2.3. Econometric application of the model
We shall now use the fungibility model outlined above to derive equations to estimate the fiscal impact of foreign aid in a federal framework. The degree of difficulty in estimation depends mainly on two things: (a) the availability of data; and (b) the specific form of the utility function.
Budgetary data in most developing countries are available on non-development and development spending (i.e., on p G1 1 and p G2 2 in our model), but not separately on prices and quantities. Similarly, information is available on central
s
transfers (development grants) to states, i.e., data on p G . Thus, data constraints2 2
require that the demand equations for the development and non-development goods derived from the fungibility model be transformed and estimated as expenditure equations. With most functional forms of utility function (e.g., a constant elasticity of substitution form), the associated demand equations are non-linear in both parameters and variables, and / or the key parameters of interest,
c s
demand functions. Appendix A provides the linear expenditure functions derived from maximizing the Stone–Geary specification of the utility function given in Eq. (3), subject to the budget constraint in Eq. (1).
In modeling the effect of aid on the central government’s optimal mix of spending we have taken R, the domestically generated revenue, as fixed. We now allow the possibility that foreign aid could have revenue effects too. Let R be a linear function of the country’s gross domestic product (GDP) and foreign aid. It then can be written as
S
c s
R5m 1 m0 1GDP1m2a where a5a 1
O
a (6)s51
Using data, the linear expenditure functions (derived in Appendix A) can be estimated along with Eq. (6) to examine the fiscal effects of foreign aid in a federal system.
3. An empirical analysis of fungibility of foreign aid to India
In an empirical application of the model developed in Section 2, we first estimate the impact of foreign assistance given to India on its central government’s development and non-development spending. As stated in one of the official documents (External Assistance, Ministry of Finance, Government of India), the external assistance made available by the donor countries / institutions is mainly used for financing development projects which involve capital investment of a high magnitude. To inquire whether such assistance has funded specific non-development spending categories (e.g., defense, interest, general administrative services), we examine the link between foreign aid and the various non-develop-ment spending activities of the central governnon-develop-ment. The impact of earmarked sector-specific aid on sectoral components of development spending is estimated next. Finally, we examine whether central assistance to states on account of foreign aid crowds out other types of central assistance, i.e., do states have any real incentives to seek external funding?
3.1. Data and analysis
The method of ordinary least squares is used to estimate the following two regression models:
Gc,t5pc,01pc,1GDPt1pc,2Aidt1nc,t (7)
S S
d d d d
Ft,s5v 1 v0 1gt21,s1v2Aidt,s1v3
S
O
[ gt21, j1Ft, j]D
1v4O
Aidt, j1ht,sj±s j±s
(8)
Eq. (7), in a simplified and estimable form, is derived from Eqs. (A.3), (A.4) and (A.6) described in Appendix A. It estimates the impact of foreign aid on the budget composition, taking into account that aid could also affect domestic revenue, R. The latter effect has been incorporated through Eq. (A.6). Eq. (8) is a variant of Eq. (A.5) described in Appendix A. It looks at how the fiscal transfers from the central government to the states, another component of the central budget, are affected by earmarked foreign aid given to states.
Measured in per capita 1995 rupees, the variables in the above two equations are:
Gc,t5Categories of central government’s expenditure at time t;
GDPt5Gross domestic product;
Aidt5Total foreign aid;
Aidt,s5Central assistance passed on to state s on account of foreign aid;
d
Ft,s5Central government transfers (net of assistance on account of foreign aid) to state s for development purposes;
d
gt,s5Development spending of state s financed from its own sources;
n andh5White noise error terms for the two sets of equations.
At both levels of government (federal and state), total expenditure is divided into two broad groups: development and non-development expenditures, with each having components of capital and revenue (recurrent) categories. Within the development expenditure category, classification is done on account of economic and social services. The non-development expenditure includes general services, defense expenditure (for central government only), interest payments and transfers to subsidiary governments. Our main aid variable, Aid , is the total disbursementt
of grants and concessionary loans by all bilateral and multilateral sources, reported in the Government of India’s publication Economic Survey. To analyze fungibility at the inter-governmental level, we use the data on transfers from the central to state governments on account of external assistance. In Indian public finance statistics this is labeled as ‘Additional Central Assistance (ACA).’
3.2. How does foreign aid affect the level and composition of central
government’s budget?
During the period 1970 through 1995, the central government spent, on an average annual basis, roughly 18% of the country’s resources (GDP). The total
5
was equally divided between the non-development and development categories. Moreover, the country, on average, received aid from all foreign sources amounting to a little over 1.5% of its GDP with a range from a little over one to 2.7%. All in all, during this period, foreign aid financed roughly 8.3% of the central government’s budget.
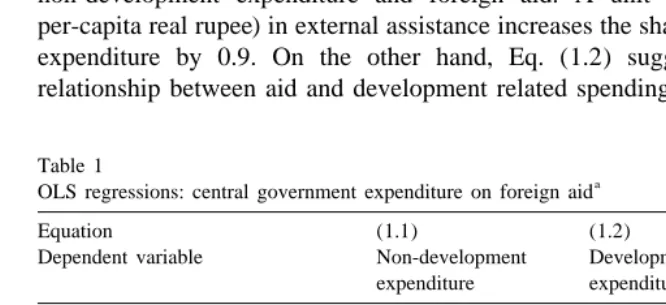
Table 1 has the estimates of Eq. (7). Estimated in first differences, the first two regressions reported in this Table examine the link between total foreign aid and the central government’s spending on non-development and development categories, respectively.
Eq. (1.1) shows a positive and statistically significant relationship between non-development expenditure and foreign aid. A unit increase (measured in per-capita real rupee) in external assistance increases the share of non-development expenditure by 0.9. On the other hand, Eq. (1.2) suggests that there is no relationship between aid and development related spending of the central
govern-Table 1
a
OLS regressions: central government expenditure on foreign aid
Equation (1.1) (1.2) (1.3)
Fiscal crisis (1991) 2993.5 21733.8 518.95
dummy
(21.93) (22.23) (0.76)
R-square 0.35 0.37 0.15
D –W statistic 1.77 1.88 1.96
a
Notes: (a) To correct for autocorrelation the regressions are done in first differences, and are based on 25 annual observations from 1970 to 1995. Applying the AR (1) correction (in levels) also gives similar estimates. Given the small size of the sample, however, the estimate ofris subject to sampling errors. In such cases, a recommended alternative (see Maddala, 1992) is to run the regressions in first differences. (b) The foreign aid variable is total disbursement of external assistance, concessionary loans and grants from all sources, bilateral and multilateral. All variables are in per-capita 1995 rupees. (c) t-statistics in parentheses; * significant at 10%.
5
ment; the coefficient is negative but insignificantly different from zero. In both equations, the coefficient on the variable GDP indicates how much of an additional resource unit to the country is spent on goods and services provided by the central government. In Eq. (1.1), the coefficient on this variable is positive and statistically significant. It shows that at the margin, 8% of an extra unit of country’s GDP is spent on non-development related activities of the central government. However, the relationship between GDP and the central government’s development spending is unclear; the estimate is positive but statistically in-significant. One reason for the statistical insignificance could be that a number of structural shifts took place in this spending category during the sample period. Also included in the two regressions is a dummy variable for the 1991 fiscal crisis in the country when government spending was cut across the board. The coefficient on the fiscal crisis dummy is negative and statistically significant in both the equations though reduction in development spending was much more than in non-development spending. Separately, in Eq. (1.3) we report whether foreign aid is associated with any tax relief effect. The results indicate that the data for the sample period do not support any link between aid and the country’s revenue receipts.
What do these results indicate? The documents of the Indian Ministry of Finance assert that external assistance is used for financing development related projects. This may certainly be the case. But what we see is not always what happens. The true effect of external aid depends on whether the recipient country is able to reallocate its other expenditure. Our findings suggest that external assistance to India, at the margin, is not being spent on purposes intended by the donors; instead, the money is being used to finance non-development related activities of the country.
of such divergent behavior is that the size of foreign aid (in relation to the budget) matters. As the share of aid in budgetary finance increases, it becomes difficult for the country to make aid resources fungible. In the fully-fungible case of the Dominican Republic, foreign aid was roughly 8% of the budget. In Indonesia, where the evidence suggests that aid stimulates development expenditures, it was nearly 20% of the budget. If one believes that the size of aid matters for fungibility, then our result in the Indian context has a perfect explanation. Foreign aid to India during the sample period was quite small; it financed roughly 8% of the central government’s budget!
What specific activities in the non-development budget are being financed from foreign aid? Fig. 2 shows the composition, the main sub-categories, of non-development expenditure over the sample period.
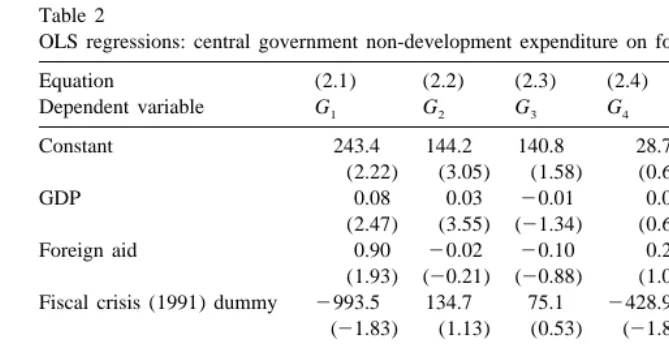
To inquire which activities among the non-development category could be benefiting from foreign aid, we regress these sub-categories – interest and principal payments, defense spending and other general services – on the aid variable. The results are reported in Table 2.
Upon receiving foreign aid, if the Indian government was diverting its own resources from development related activities – for which most of the assistance is earmarked – to fund its debt related spending, one could argue that this may not be a totally undesirable outcome. The average annual interest spending and principal repayment on all domestic and foreign debt over the sample period was 3.4 and 0.84% of GDP, respectively. Eq. (2.2) reported in Table 2, however, indicates no discernible relationship between foreign aid and interest spending. Similarly, no such link seems to exist with the principal payments on loans (Eq. (2.3)).
The other major item in the central government’s non-development spending is
Table 2
a
OLS regressions: central government non-development expenditure on foreign aid
Equation (2.1) (2.2) (2.3) (2.4) (2.5) (2.6)
Dependent variable G1 G2 G3 G4 G4 G5
Constant 243.4 144.2 140.8 28.7 0.02 6.25
(2.22) (3.05) (1.58) (0.60) (3.48) (0.12)
GDP 0.08 0.03 20.01 0.01 20.006 0.03
(2.47) (3.55) (21.34) (0.63) (20.05) (1.66)
Foreign aid 0.90 20.02 20.10 0.22 0.22 0.74
(1.93) (20.21) (20.88) (1.09) (1.23) (2.59) Fiscal crisis (1991) dummy 2993.5 134.7 75.1 2428.9 2448.5 2742.0
(21.83) (1.13) (0.53) (21.83) (2.21) (22.48)
War dummy (1971) 141.0
(1.15)
Pakistan’s defense expenditure 1.13
(3.25)
R-square 0.37 0.40 0.14 0.17 0.48 0.34 D –W Statistic 1.77 2.23 2.16 1.99 1.94 1.81
a
Notes: (a), (b) See Table 1. & (c) (d) G , Non-development expenditure; G , Interest expenditure t;1 2
G , Principal payments on all debt; G , Defense expenditure and G , Non-development expenditure23 4 5
interest expenditure2principal payments on all debt-defense expenditure. Data on Pakistan’s defense expenditure are from US Arms Control and Disarmament Agency (various issues).
defense. The donor community is increasingly concerned that assistance to developing countries is directly or indirectly financing military expenditures. Could India have maintained the level of its defense spending in the absence of development assistance? Over the sample period, 1970 through 1995, of our analysis, the share of India’s defense expenditure in GDP averaged 3.3%. The statistical analysis reported in Eq. (2.4) shows a positive but statistically insignificant relationship between defense spending and foreign aid. Landau (1994) has argued that an important determinant of a country’s defense spending is the defense spending of its neighboring countries. Since 1947, India and its neighbor, Pakistan, have fought three major wars and the last one in 1971 led to the creation of Bangladesh. Lately, there has been an arms race between the two countries. To control for any such effects, we include in our regression model a dummy variable for India’s 1971 war with Pakistan. Moreover, we add Pakistan’s defense expenditure as an explanatory variable. Even with this new specification (see Eq. (2.5)), we do not find any (statistically significant) association between India’s defense spending and foreign aid. Finally, in Eq. (2.6) we report the link between foreign aid and the remainder of non-development related spending which is mostly general service and administration. This equation indicates that at the margin, almost three-quarters of the foreign aid given to India finances its administrative and general service expenditures.
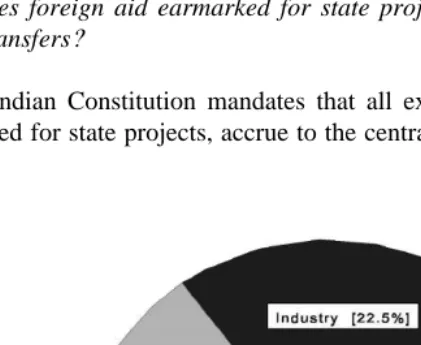
available on sector specific concessionary loans but not on grants. Moreover, while grants were roughly 15% of the total aid on an aggregate basis during the sample period, no systematic information is available on the mix of loans and grants by sectors. Yet another limiting factor in this analysis is that data on sector specific central transfers (on account of foreign aid) to the states are only available for the period 1970 through 1988. Finally, consistent time-series data on sectoral spending are only available from 1974 onwards. Fig. 3 shows the major components of development spending of the central government. Fig. 4 shows the composition of earmarked concessionary loans given to support these activities.
Table 3 reports the regressions of these sub-categories of the development expenditure on sector specific earmarked concessionary loans. Among the seven sub-categories of development expenditure – agriculture, irrigation, energy, industry, transport and communication, social sectors, and others – that we examine, we find that in all of the sectors we can reject the null hypothesis that the coefficient on the aid variable is different from zero. Notwithstanding the data limitations, these results are not altogether surprising for we also do not find any statistically significant relationship between the overall development expenditure and total foreign aid.
3.3. Does foreign aid earmarked for state projects affect inter-governmental
fiscal transfers?
The Indian Constitution mandates that all external assistance, including funds earmarked for state projects, accrue to the central government. In turn, these funds
Fig. 4. Composition of concessionary loans.
are pooled with a portion of domestic resources to finance ‘Plan Outlays,’ which are various developmental projects, programs and schemes included in the country’s annual plan. Part of this pool of resources is retained by the central government for its own plan expenditure and the remaining is allocated to the states in a mix of grants and loans to finance their plan outlays. Transfers through this channel are mediated by the country’s Planning Commission on the basis of the ‘Gadgil formula,’ which is a weighted average of population, per capita
Table 3
a
OLS regressions: central government development expenditure (sub-categories) on sectoral foreign aid Equation (3.1) (3.2) (3.3) (3.4) (3.5) (3.6) (3.7) Dependent variable Agriculture Irrigation Energy Industry T&C SS Others Constant 15.80 13.41 11.50 40.93 14.59 44.42 136.81
(1.53) (1.39) (0.70) (0.34) (0.47) (1.92) (2.48) GDP 20.001 20.003 0.01 20.04 .002 0.01 0.02
(20.33) (21.23) (2.51) (21.18) (0.19) (1.18) (0.87) Sectoral aid 20.37 0.01 0.11 1.95 20.79 1.52 20.01
(20.82) (0.03) (0.78) (0.27) (20.51) (1.31) (20.02)
Other aid 0.02 0.01 0.04 20.30 20.13 0.21 20.40
(0.24) (0.14) (0.67) (20.67) (20.83) (1.99) (20.95) R-square 0.08 0.16 0.50 0.23 0.17 0.54 0.17 Observations 15 15 15 15 15 15 15
a
6
income, fiscal performance and special problems of the states. The other important source of transfers from the center to states consists of tax shares and statutory grants recommended every five years by the Finance Commission, which is a constitutionally mandated body.
As mentioned by Bajaj (1992), a notable feature of this disbursement mecha-nism is that not all earmarked external assistance to the states is transferred to
7
them in full. Moreover, the assistance on account of externally aided projects is given (excepting to the special category poor states) on the same terms as normal central assistance, i.e., 70% in the form of loans and 30% as grants. At the outset, this system of foreign aid management at the central level appears to be designed to make foreign resources fungible. In Bajaj’s words ‘‘ . . . this arrangement (of allocating foreign aid) preserved an internally determined pattern of inter-sectoral and inter-regional distribution of plan resources. The additional resources gener-ated by external flows were therefore shared among all states, not only those that undertook and implemented externally aided projects’’ (p. 194).
The increase in recent years in the proportion of earmarked external assistance transferred to the states does not necessarily imply that the funds are truly additional. To examine whether central transfers on account of foreign aid are additional, we estimate the regression model outlined in Eq. (8).
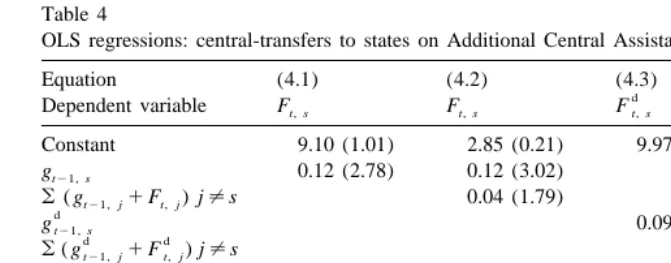
The regressions presented in Table 4 are based on our sample panel data from fourteen general category states. Together, these states account for nearly 98% of the assistance given to all states on account of foreign aid over the sample period (1980 through 1992). As a share of total, central transfers to states on account of foreign aid have been small; the average share of ACA in total transfers over the sample period was 6%. Results presented in Table 4 show that at the margin, states do not benefit on account of externally aided projects. For example, Eq. (4.1) indicates that a rupee increase in central transfers on account of foreign aid to a state is associated with a reduction of Rs. 1.62 in other transfers to that state. (The reduction is Rs. 1.41 if other transfers for development purposes are considered. See Eq. (4.3)). The more than a rupee reduction in other transfers suggests that not only the state is losing out for acquiring external resources but is also being penalized for it. Though we do not have enough data to test the hypothesis, it is
6
Prior to any disbursement, however, 30% of the total allocable amount through this channel is earmarked for the generally poor and resource constrained states which are Arunachal Pradesh, Assam, Himachal Pradesh, Jammu & Kashmir, Manipur, Meghalaya, Mizoram, Nagaland, Sikkim and Tripura. The formula is then applied to the fifteen ‘‘General Category’’ states – Andhra Pradesh, Bihar, Goa, Gujrat, Haryana, Karnataka, Kerala, Maharashtra, Madhya Pradesh, Orissa, Punjab, Rajasthan, Tamil Nadu, Uttar Pradesh and West Bengal – which receive the remaining 70%.
7
Table 4
a
OLS regressions: central-transfers to states on Additional Central Assistance (ACA)
Equation (4.1) (4.2) (4.3) (4.4)
d d
Dependent variable Ft, s Ft, s Ft, s Ft, s
Constant 9.10 (1.01) 2.85 (0.21) 9.97 (1.24) 19.09 (1.68) gt21, s 0.12 (2.78) 0.12 (3.02)
aidt, s 21.62 (22.41) 20.92(21.39) 21.41 (22.36) 20.77 (21.13)
oaidt, j j±s 20.39 (23.44) 20.39 (23.42)
R-square 0.08 0.20 0.05 0.14
Observations 168 168 168 168 Model Random Fixed Random Fixed
a
Notes: (a) The regressions are based on annual data from 1980 to 1992 on 14 states and are in first differences (for time-series data); ACA is transfers on account of foreign aid that are passed-on by the central government to state governments. (b) The number in parenthesis is t-statistics for fixed-effects models and z-values for random-effects models. R-square is ‘within’ for fixed-effects model and ‘overall’ for random-effects model. ‘Model’ indicates whether the state dummies in the regression represent a Fixed effects or a Random effects model. The test is based on Hausman (1978).
likely that at the margin some of these resources are being transferred to the special category poor states, which do not get any significant external assistance. Eq. (4.1) also indicates that a rupee increase in state government’s spending financed by its own resources in the previous year leads to a 12 paise increase in central transfers in the following year. The latter link suggests some evidence of rewarding past revenue efforts of states. The regression reported in Eq. (4.3), development transfers on ACA, has similar results. In Eqs. (4.2) and (4.4) we control for two additional factors: foreign aid to other states and spending by other states. In both cases, the coefficient on ‘aid to other states’ is negative and statistically significant. It shows that a rupee increase in external aid for all other states is associated with a 39 paise reduction in central transfers. Moreover, the own foreign aid variable in the specification, which was previously significant, now becomes insignificant. Evidently, central transfers to the general category states are reduced with an overall increase in foreign assistance to states.
3.4. Linking foreign aid, the central government’s development budget and
inter-governmental fiscal transfers: A simultaneity issue
It is possible that Eqs. (7) and (8), which are based on the theoretical model of Section 2, are subject to some degree of simultaneity. For example, the size of the
d
central government’s own development spending (G ), – an endogenous variablet
d 8
development purposes (Ft, s) – the endogenous variable in Eq. (8). Suppose the central government builds a university in a state. Clearly the state residents will benefit from the increased opportunity for higher education. However, with the new university in the state, the central government may decide to lower its transfers to that state for higher education. Conversely, if the new university is partially funded by the central government and requires state funds also, the central government may increase its assistance to that state. Thus, an increase in central government spending in a state may crowd-in or crowd-out central transfers to that state. In this sub-section we model such effects, which were not allowed for in our previous empirical analysis.
d
Let G , central government development expenditure, be an additional right-t
hand-side variable in Eq. (8). We could think of this variable as part of the error term in our previous estimation process described in Section 3.3. With this formulation, we can write the two-equation system as:
d
While Gt is the endogenous variable in Eq. (9), it appears as a right-hand-side variable in Eq. (10). This set of simultaneous equations can be estimated by the
9
two-stage least squares (2SLS) method. In applying the 2SLS method, we first
d
estimate Eq. (9) by ordinary least squares and obtain the predicted value of G . Int
d
stage 2, we replace Gt on the right-hand-side of Eq. (10) by its predicted value obtained from the first regression, and then estimate the equation by ordinary least squares (OLS).
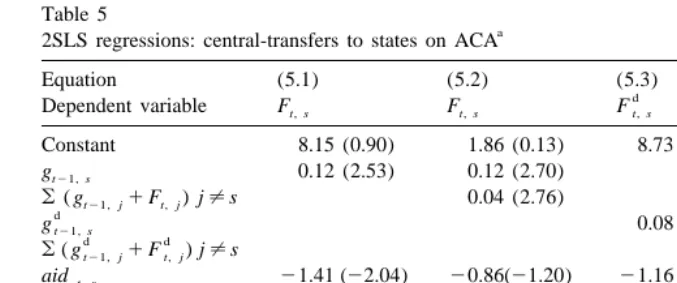
In Table 5 we report the second-stage regression (for space consideration, we report the first-stage OLS regression in a footnote of the table). The upshot of this table is that our findings based on the results of Table 4 continue to hold. The 2SLS estimates also show that at the margin, states do not benefit on account of externally aided projects. The size of the coefficient on the variable ‘‘central transfers on account of foreign aid to a state’’ increases marginally from 21.62 (Eq. (4.1) in Table 4) to 21.41 (Eq. (5.1) in Table 5). The coefficient on the
d
‘‘predicted value of Gt ’’ is positive but insignificant. The coefficient of state
8 d d
In general, it is possible that the reverse causality would also apply, i.e., Ft, sinfluencing G . In thet
Indian budgetary system, however, this is unlikely. Discretionary transfers to states, that are not based on predetermined revenue-sharing formulae, belong to the ‘‘residual’’ part of the budget. This is the portion that remains after the central government determines its own development and non-develop-ment spending.
9
Table 5
a
2SLS regressions: central-transfers to states on ACA
Equation (5.1) (5.2) (5.3) (5.4)
d d
Dependent variable Ft, s Ft, s Ft, s Ft, s
Constant 8.15 (0.90) 1.86 (0.13) 8.73 (1.08) 18.35 (1.58) gt21, s 0.12 (2.53) 0.12 (2.70)
aidt, s 21.41 (22.04) 20.86(21.20) 21.16 (21.90) 20.74 (21.08)
oaidt, j j±s 20.37 (22.79) 20.36 (22.84)
Notes: (a), (b) See Table 4. (c) The first-stage regression in first differences (over the period
d
1980–1992) is: Gt519.510.05 GDPt21.25 Aidt2
2
1167.8* Fiscal crisis (1991) dummy R 50.56; * indicates significance at 10%.Predicted values
d
of G are then used in the second-stage regression, as reported above.t
government’s spending financed by its own resources in unchanged from Table 4.
d
In Eq. (5.3) the coefficient of the predicted value of G is positive and significantt
(at 10% level) and indicates that on average a rupee increase in the central government’s aggregate development spending leads to a 2 paise increase in its development-related transfers to states.
4. Conclusion
In this paper we model two dimensions of foreign aid fungibility, one at the federal level and the other at the inter-governmental level. We use the model to test whether foreign aid to India, a federal country, is being spent for purposes intended by the donor agencies. This involves asking the question: what would have happened to the government budget in the absence of donor financing? Our empirical results suggest that the central government converts most foreign funds, including those earmarked for state governments, into fungible monies; and spends on activities that would have been undertaken anyway. Foreign aid merely softens its budget constraint.
planning clinics – and how well their projects perform. A better approach to make aid effective in terms of the overall development impact is to link aid with an overall public expenditure program that provides adequate resources to crucial sectors. Indeed, this is the main message of the paper.
Acknowledgements
The views expressed in this paper are entirely those of the authors and do not necessarily represent the views and policies of the World Bank. We received helpful comments from Shanta Devarajan, David Dollar, Tarhan Feyzioglu, Howard Pack, Martin Ravallion, Lant Pritchett, Tapas Sen, P. V. Srinivasan, D.K. Srivastava and seminar participants at the Indira Gandhi Institute of Development Research (Mumbai, India), the National Institute of Public Finance and Policy (New Delhi, India), and the World Bank. The comments from an anonymous referee and the editor were extremely useful in revising the paper. We are grateful to Mohey Ragab for providing us the data on concessionary assistance to India. Rajeev Ahuja helped with data collection and compilation. We acknowledge financial assistance from the World Bank (research grant rpo 681-41).
Appendix A
With the Stone–Geary specification, Eq. (3) of the fungibility model of Section 2 can be written as
s s s bCs bG bG s bgs
p 1 2 1
U 5(Cp 2gCp) ?(G12gG1) ?(G22gG2) ?( g12gg s1 )
s bgs
2
?( g21G22gg s2 ) ) (A.1)
g’s are the subsistence quantities and are positive. A restriction imposed by this functional form is that all choice variables of the central government, G , G and1 2
s
G , are independent of each other at the margin and the only link they have is2
through the budget constraint. Thus, while our Stone–Geary functional form gives us an estimable linear expenditure system (see below), it comes at a cost.
s
Maximization of U subject to the budget constraint
S S
s c c s s
p G1 11p G2 21
O
p G2 25R1f a 1O
f a (A.2)yields the following linear expenditure equations:
(iii) Expenditure on G :2
s s s s
Using data, these linear expenditure functions can be estimated along with the following equation, which models endogeneity of domestic revenue with respect to foreign aid:
As part of this research, we put together a data set on the major fiscal variables of the central and state governments as well as on external assistance to India.
B.1. Data on foreign aid
loans from all bilateral and multilateral sources, were obtained for the period 1970–1995 from the Government of India’s publication, Economic Survey (various issues). These data are not available by sectors.
To do the sector-specific analysis for the central government, we use conce-ssionary loans as the aid variable. The latter information, previously unavailable, was collected from World Bank sources.
On average, concessionary loans account for nearly 85% of all external assistance for the sample period. Data on external resource transfer from the central government to states over the period 1980 through 1988 were taken from Bajaj (1992). Information on later years was taken from
‘‘External Assistance,’’ an annual publication of the Aid Accounts & Audits Division, Department of Economic Affairs in the Ministry of Finance, Government of India.
B.2. Budgetary data at different levels of government
Two different sources were used to compile the data on the central govern-ment’s fiscal variables: Chandhok and the Policy Group (1990) and Indian Public
Finance Statistics (various issues), Government of India. Data were collected on
public spending (aggregate as well as by sectors, purposes etc.), revenue receipts and fiscal deficits for the period 1970–1995. Full sample (26 annual observations) was used for all the central government analysis excepting the sectoral analysis for which data for 1974–1995 were used. This was done due to a change in sectoral classification systems between 1973 and 1974, making comparisons of pre-1973 and post-1973 data (on individual sectors) almost impossible. Moreover, the following modifications were made in the original expenditure data to conform to our research needs:
First, loans and grants (from the center to states) were re-classified to put them in the development or non-development categories. In the original data, loans and grants are included as transfer payments and are listed under two categories: ‘‘plan’’ and ‘‘non-plan.’’ We put loans of both types and ‘‘plan’’ grants in the development category; ‘‘non-plan’’ grants were included in the non-development category. Second, we included principal payments on all foreign debt in the non-development category. In the Indian accounting system, principal payments are netted out from loans received, the latter being an entry in the Capital Receipts Accounts. Finally, we included the external assistance given by the center to the states, in the development category.
Kerala, Maharashtra, Madhya Pradesh, Orissa, Punjab, Rajasthan, Tamil Nadu, Uttar Pradesh and West Bengal.
B.3. Other data
Information on Gross Domestic Product, Exchange Rates (Official) and Consumer Price Index were obtained from Economic Survey (various issues). Population figures for the country and for individual states are from the Census of
India (various issues).
References
Bajaj, J.L., 1992. Externally aided projects and state finances. In: Bagchi, A., Bajaj, J.L., Byrd, W.A. (Eds.), State Finances in India. Vikas Publishing House, New Delhi.
Cashel-Cordo, P., Craig, S.G., 1990. The public sector impact of international resource transfers. Journal of Development Economics 32, 17–42.
the Policy Group, Chandhok, H.L., 1990. The Economy: Annual Time Series Data. Arun Purie for Living Media India Ltd, New Delhi, India.
Feyzioglu, T., Swaroop, V., Zhu, M., 1998. Foreign aid fungibility: A panel data analysis. The World Bank Economic Review 12 (1), 29–58.
Gang, I.N., Khan, H.A., 1991. Foreign aid, taxes and public investment. Journal of Development Economics 34, 355–369.
Government of India. Economic Survey, various issues. Economics Division. Ministry of Finance, New Delhi.
Government of India. Indian Public Finance Statistics, various issues. Ministry of Finance, New Delhi. Gramlich, E., 1977. The effects of federal grants on state–local expenditures: A review of the empirical evidence. In: Oates, W. (Ed.), The Political Economy of Fiscal Federalism. Lexington, Mass.: Health.
Gupta, K.L., 1993. Sectoral fungibility of foreign aid: Evidence from India. Mimeograph. University of Alberta, Alberta.
Hausman, J.A., 1978. Specification tests in econometrics. Econometrica 46, 1251–1272.
Heller, P.S., 1975. A model of public fiscal behavior in developing countries: Aid, investment, and taxation. American Economic Review 65 (3), 429–445.
Khilji, N.M., Zampelli, E.M., 1994. The fungibility of U.S. military and non-military assistance and the impacts on expenditures of major aid recipients. Journal of Development Economics 43, 345–362. Landau, D., 1994. The impact of military expenditures on economic growth in less developed countries.
Defense and Peace Economics 5, 205–220.
Maddala, G.S., 1992. Introduction to Econometrics. Macmillan, New York.
McGuire, M.C., 1978. A method for estimating the effect of a subsidy on the receiver’s resource constraint: With an application to the U.S. Local governments 1964–1971. Journal of Public Economics 10, 355–369.
Mieszkowski, P.M., Oakland, W.H., 1979. Fiscal Federalism and Grants-in-aid. Urban Institiute, Washington.
Pack, H., Pack, J.R., 1996. Foreign aid and fiscal stress. Mimeograph, The University of Pennsylvania, Philadelphia, PA.
Pack, H., Pack, J.R., 1990. Is foreign aid fungible? The case of Indonesia. Economic Journal 100, 188–194.
Rosen, H., 1988. Fiscal Federalism: Quantitative Studies. University of Chicago Press, Chicago. Reserve Bank of India. Bulletin on State Finances, various issues. Mumbai.
US Arms Control and Disarmament Agency. World Military Expenditures and Arms Transfers, various issues. US Government Printing Office, Washington, DC.
World Bank, 1998. Assessing Aid: What Works, What Doesn’t and Why. Oxford University Press, New York.