Capacity allocation and outsourcing in a process industry
Ton G. de Kok
School of Technology Management, Eindhoven University of Technology, Room F4, P.O. Box 513, 5600 MB Eindhoven, The Netherlands
Received 1 April 1998; accepted 1 November 1999
Abstract
In this paper we consider a production facility producing a uniform product that ships a number of di!erent package sizes to a (number of) stockpoint(s). The packaging capacity owned by the facility is"nite and the actually used capacity must be reserved sometime before actual use. Furthermore, the packaging capacity must be allocated among the di!erent package sizes, such that a target"ll rate for each package size is achieved. We propose two di!erent capacity reservation strategies, both derived from a periodic review order-up-to-policy. One strategy assumes that excess capacity needs compared with the owned capacity cannot be"lled and are postponed to the future. The other strategy assumes that excess capacity needs are outsourced. The objective of the paper is to"nd cost-optimal policies within each of the two classes of policies and then select the best capacity reservation policy. We present some managerial insights into the impact of various process and cost parameters and the choice of the capacity reservation strategy. ( 2000 Elsevier Science B.V. All rights reserved.
Keywords: Capacity allocation; Inventory management; Outsourcing
1. Introduction
In this paper we consider a continuous process-ing plant, the output of which consists of a uniform product, which is packaged in barrels of di!erent sizes before shipment to company-owned geo-graphically dispersed stockpoints. Demand for packaged products is only occurring at these stock-points. It is assumed that the uniform product can be stored in su$cient amounts before packaging so as to guarantee supply of product to be packaged. Thus the main problem remaining is the planning of the packaging department. The planning of the packaging department can be seen as a hierarchical planning problem consisting of two phases. In phase 1 the total packaging capacity in working hours is determined. This decision is taken a"xed lead time before actual packaging. This lead time is
required to ensure that the planned capacity, i.e. number of people, is available in the production period planned for. This phase is called thecapacity reservation phase. In the second phase the available capacity is allocated to speci"c barrel sizes in order to satisfy customer demand. This phase is called the capacity allocationphase.
In this paper we propose a simple hierarchical planning framework that ensures that prede"ned customer service levels are met against minimal cost. In fact we discuss two di!erent strategies with respect to the capacity reservation in phase 1 com-bined with a single capacity allocation strategy in phase 2. The"rst capacity reservation strategy is to install a"xed capacityC. If the capacity demand exceeds C then this capacity demand cannot be "lled and is postponed to future periods. The sec-ond capacity reservation strategy also assumes that
a "xed capacity C is available, but in this case additional capacity can be obtained by hiring addi-tional personnel at some labour agency. The "rst capacity reservation strategy bu!ers against future uncertainty through inventory bu!ers and "xed excess capacity. The second capacity reservation strategy in addition exploits short-term availability of external capacity.
Clearly a trade-o! must be made in order to decide which strategy to employ. For a proper trade-o!between the two strategies we must com-pare cost-optimal strategies within each class sat-isfying the service level constraints. So within each class we have to consider all costs involved and then determine the optimal capacity reservation policy parameters. In both cases the policy para-meter to be determined is the "xed capacity C. However, the cost functions to be minimized under the two strategies di!er, since only the second strat-egy implies costs for outsourcing. We show that, if we employ the outsourcing strategy, then the optimalCsatis"es a Newsboy equation. Through numerical experimentation we provide managerial insights as to when to employ which strategy.
The literature on stochastic multi-item "nite capacity planning problems is rather limited. Glasserman [1] considers systems consisting of stockpoints in series, where shipments from a stockpoint to its successor are constrained by some upper bound. Such serial systems relate to the production of a single product consisting of a single subassembly, which in turn consists of another single subassembly, etc. Such capacitated systems do not occur in practice. Glasserman [2] studies a similar problem to ours. The main di!erence lies in the fact that a "xed amount of capacity is allo-cated to each package size. In our model capacity is allocated based on current capacity requirements, thereby providing more #exibility. Fransoo et al. [3] present a single machine multi-product system with set-up times. The focus of the paper is on the decision hierarchy leading to an aggregate stochas-tic planning model to determine optimal cycle times for each product and a run-out time based operational planning model to schedule the sub-sequent production runs. Fransoo's paper di!ers from ours in that he considers a continuous review system with lost-sales, whereas we consider a
peri-odic review system with backlogging. The literature on deterministic"nite capacity problems is huge. For an introduction to this subject we refer to Graves et al. [4].
The paper is organized as follows. In Section 2 we describe the model under consideration in detail and we de"ne the capacity reservation strategies. In Section 3 we discuss the relation of this model with multi-echelon models. From this discussion we de-rive a near-optimal allocation policy. In Section 4 we combine the results of Sections 2 and 3 to derive expressions for the operating characteristics, i.e. service levels and costs. Procedures for deriving cost-optimal strategies are given in Section 5. Using these procedures we are able to provide in Section 6 managerial insights into the question when to use which policy and how much"xed access capacity must be installed. Finally Section 7 discusses further research opportunities.
2. The model
The production facility under consideration satis"es the demand for N di!erent package sizes from stockpoints. In turn these stockpoints satisfy external customer demand for these package sizes. Without loss of generality we assume that each stockpoint stores only one package size. The lead time from the production facility to stockpoint
iequals¸
i,i"1, 2,2,N. The lead time equals the
order ful"lment lead time consisting of order pro-cessing, production planning, production and dis-tribution. LetD
idenote the generic random variable for the demand for package size i in an arbitrary time unit. We assume that the demand for package sizeiin subsequent time periods is i.i.d. Demands for package size i and j in the same period may be correlated. Stockpointihas to achieve a"ll ratebi, i.e.
b
i:" fraction of demand satis"ed directly fromstock on hand at stockpoint i, i"1, 2,2,N.
The stockpoints control their stocks according to periodic review order-up-to-policies.
De"ne
S
R:" review period in time units,
D
i(s,t] :"demand for package sizeval (s,t],s)t. iin time
inter-At each review moment the orders from the stock-points are processed as follows. The aggregate ca-pacity requirements are computed and compared with the reserved capacity. If the aggregate capacity requirements are less than the capacity reserved, then all requirements are satis"ed. Otherwise, the reserved capacity is rationed among the stockpoints. Let us de"ne the following generic random variables:
Dci": capacity demand from stockpoints i in
an arbitrary time unit,i"1, 2,2,N.
Dc
0:" aggregate capacity demand in an
arbit-rary time unit, Then we have the following relations:
Dci"c
Capacity is reserved according to periodic review echelon order-up-to-policy. The echelon capacity is de"ned as the sum of all capacity reserved plus all capacity associated with the inventory positions of the stockpoints. De"ne
Sc
0": capacity order-up-to-level.
The capacity reservation lead time equals¸
0. This
lead time is necessary to schedule the workforce and plan the production to enquire su$cient uni-form product to be packaged. We assume that the production facility owns a"xed packaging capacity
C. Suppose that the order-up-to-policy prescribes to reserve a capacityQ
c.
Now we distinguish between two capacity reser-vation strategies:
(i) Fixed capacity reservation strategy: ifQ
c)C, then reserveQ
c, otherwise reserveC.
(ii) Capacity reservation strategy with outsourc-ing: If Q
c)C, then reserve Qc, otherwise re-serveCand outsourceQ
c!C.
It is our objective to select the cost-optimal capa-city reservation policy within these two classes. To formulate an expression for the expected total rel-evant costs per time unit we introduce the following parameters:
cF": cost of owned capacity per time unit,
cO:"cost of outsourced capacity per time unit,
v
i:"value of package sizei,i"1, 2,2,N,
r": interest rate per time unit.
Note that the interest rate may not only include cost of capital, but may also account for, e.g., obsol-esence risks, storage costs. Hence rv
i equals the holding cost of package sizei per time unit. Fur-thermore, we assume that the value of the package size is based on the market price, so that we do not distinguish between the value of products made by owned and outsourced capacity. We exclude"xed costs for outsourcing, although it is quite straight-forward to include it into the analysis.
The expression for the expected total relevant cost per time unit TRC (C,Sc
1 if excess capacity requirements are outsourced,
0 otherwise,
X`
j (C,Sc0,MSiNNi/1) :"net stock at stockpoint j at
the end of an arbitrary re-view period.
In the sequel we will drop the dependence of
X`
j and TRC onC,Sc0,MSiNNi/1. Our objective is to
minimize TRC subject to "ll rate constraints. Hence, we want to solve the following problem:
min TRC
C,Sc0,MS iNNi/1
s.t. b
Here bH
i denotes the target "ll rate. Note that
b
i also depends on the choice of the capacity reser-vation policy, Sc
0 and MSiNNi/1. In the next section
we derive expressions for TRC and b
i for the two capacity reservation policies under the assumption of the so-called Balanced Stock rationing policy introduced by Van der Heijden [5] for the alloca-tion of reserved capacity among the stockpoints. Based on these expressions we propose procedures for determination of the cost-optimal policies.
3. Analysis of the model
In this section we derive expressions for long-term average costs and customer service levels for each of the two strategies proposed. First, we ana-lyse the capacity reservation strategies and there-after we analyse the common capacity allocation strategy.
3.1. Capacity reservation strategy withxxed capacity
Under the capacity reservation strategy with
"xed capacityCwe have to modify the
order-up-to-strategy with order-up-to-levelSc
0. Let us de"ne
I~0,n:"echelon capacity of overall system
immedi-ately before review momentn,
I`
0,n:"echelon capacity of overall system immedi-ately after review momentn.
Taking into account the"nite capacityCwe obtain the following relation betweenI~0,n andI`
0,n:
I`
0,n"min(I~0,n#C,Sc0).
Since I~0,n equals I`
0,n~1 minus the total capacity
demand during ((n!1)R,nR], we obtain
I`
0,n"min(I`0,n~1!Dc0((n!1)R,nR]#C,Sc0).
Now let us introduce the random variable>
n de-"ned by
>
n"Sc0!I`0,n, n*0.
Then it is easy to see that
>
nn"*max(0,>n~1#Dc0[(n!1)R,nR]!C),
0.
Following De Kok [6] we observe that the above equation is identical to Lindley's integral equation
for the waiting times in a D/G/1-queue. In [6] a simple and e$cient moment-iteration algorithm is given that computes excellent approximations for
the "rst two moments of the waiting time of an
arbitrary customer. Hence, we can use this algo-rithm to computer E[>] and E[>2] where
>"lim
n?=>n. Hence, we "nd that under the assumption that the system is in its steady state at time 0,I`
0,0"Sc0!>. This result will be employed
when we analyse the capacity allocation strategy. Let us de"ne CRC(C) as
CRC(C) :"expected capacity reservation costs per
time unit.
Then it readily follows that
CRC(C)"c
FC.
3.2. Capacity reservation strategy with outsourcing
Under the capacity reservation strategy with
"xed capacity Cand in"nite outsourcing capacity
we are always able to raise the echelon capacity to its order-up-to-levelSc
0at review moments. Hence
I`
0,0"Sc0.
Yet the choice of C has immediate cost implica-tions. If C increases then the "xed capacity cost increases, but the outsourcing cost decreases. It is easy to see that under an order-up-to-policy the capacity reserved at review moment n equals the capacity demand during time interval ((n!1)R,nR]. If this capacity demand exceeds
Cwe outsource the excess demand, otherwise we need not outsource. Thus we "nd the following expression for the capacity reservation costs CRC(C):
CRC(C)"cFC#cOE[(Dc
0((n!1)R,nR]!C)`].
Note that this expression does not depend on n. Hence, we"nd under the assumption that the sys-tem is stationary at time 0,
CRC(C)"c
FC#cOE[(Dc0,R!C)`]. (3.1) HereDc
above equation as follows:
The cost-optimal C follows by setting the "rst derivative of CRC(C) equal to 0 and veri"cation of a positive second derivative in the optimum found. It easily follows that
CRC(C)
Dc0,R is a monotone increasing function, the
second derivative is positive for allCand the opti-mumCHis found by solving for
F
Dc0,R(CH)"cO
!cF
cO (3.2)
which is a Newsboy equation. Note that we impli-citly used the fact that the choice of C does not in#uence the holding costs incurred at the stock-points, nor the customer service levels. This con-cludes our analyses of the capacity reservation strategies.
3.3. Capacity allocation strategy
The capacity allocation strategy is based on Van der Heijden [5], who proposes a so-called Balanced Stock (BS) rationing rule for the situation where a stockpoint has to ration available inventory among its succeeding stockpoints. Here we are con-fronted with a similar situation. After reserving capacity at time 0 we must ration available capacity among di!erent package sizes at time¸
0. To ration
the available capacity we aim at achieving the order-up-to-levelS
then we can be sure that all available capacity is rationed among the package sizes. This follows from the fact that at time¸
0the sum of the reserved
capacity at time and all echelon capacities of the individual package sizes equalsI
0!Dc(0,¸0]. The
target sum of all echelon capacities equals
+Nj/1c
jSj. Eq. (3.3) together with I0)S0 implies
that the total available echelon capacity is less than or equal to the target echelon capacity. Hence, no reserved capacity remains unused. The BS rationing rule is as follows. LetI
i be de"ned as
I
i:"inventory position of stockpointrationing at time¸ i after
0,i"1, 2,2,N.
The random variable Dc
i,R denotes the capacity demand for package size i during an arbitrary review period. Furthermore, we assume that> is
identically equal to 0 for the capacity reservation strategy with outsourcing. This BS rationing rule aims at minimizing the probability of imbalance. Imbalance occurs when the above allocation rule leads to negative capacity allocated to one or more package sizes. Van der Heijden et al. [8] show the robustness of BS rationing for a wide range of multi-echelon inventory systems under periodic re-view order-up-to-polices.
From this expression forI
iwe can derive expres-sions for both costs and service levels for the di!er-ent package sizes. It is easy to see that the net stock
X
i at the end of period¸0#¸i#Requals
X
i"Ii!Di(¸0,¸0#¸i#R], i"1, 2,2,N,
and thus we"nd for the average on-hand stock
E[X`
i ]"E[(Ii!Di(¸0,¸0#¸i#R])`]. (3.5)
Analogously, we"nd for the"ll rate of package size
i,
b
i"1![E[(Di(¸0,¸0#¸i#R]!Ii)`]
!E[(D
Now note that Thus, we need to know the probability distribu-tions of D
i(¸0,¸0#¸i]#(pi/ci)(Dc0(0,¸0]#>)
and D
i(¸0,¸0#¸i#R]#(pi/ci)(DcC0,¸]#>).
We can easily compute the "rst two moments of each random variable involved. Furthermore, the random variables added together are independent of each other. Hence, it is easy to compute the"rst two moments of the random variables in (3.5) and (3.6). As in [8] we can"t mixtures of Erlang distri-butions to the above random variables so that these expressions can be easily computed.
3.4. Total relevant costs
From the de"nition of TRC and CRC we"nd
TRC(C)"CRC(C)#+N
j/1
rv
jE[X`j(C)]. (3.7)
Here we emphasized the dependence of TRC and CRC on the owned capacityC. We want to minim-ize TRC subject to the service level constraints
b
j*bHi for all j. It follows from the analysis in Section 3.1 that the optimal capacity reservation policy with outsourcing follows from solving for
CH in the Newsboy equation (3.1) and the asso-ciated costs follow from the expressions for CRC(CH) and E[X`
j(CH)]. Note that in this case
E[X`
j (C)] is independent ofC. However, in the case of the"xed capacity reservation policy E[X`
j (C)] depends onCthrough the random variable>. It is
easy to"nd for eachCthe unique policy satisfying the service level constraints. De"ne
¹RC(C,bH) :"expected total relevant cost
asso-ciated with the unique policy that satis"es the service level constraints with owned capacityC.
From numerical experiments we found that TRC(C,bH) is convex inCunder the"xed reserva-tion policy. Thus we can compute the optimal
CHby a simple bisection procedure.
In the next section we provide managerial in-sights into the problem of choosing the optimal capacity reservation policy. We observe that the optimal policy depends on the pdf. ofD
i, as well as on the parameters v
i,ci,¸i,bi,j*1, 2,2,N and ¸
0We normalize the cost-optimization problem as,cF andcO.
follows. De"ne
c": cost of owned capacity as a fraction of the cost
outsourced capacity,
a": cost of capacity per package sizeias a fraction
of the value of package sizeiin case the opti-mal capacity reservation policy with outsourc-ing is applied,i"1, 2,2,N.
Clearly,
c"cF
cO.
The meaning ofa can be explained as follows. Let us assume that the optimal capacity reservation policy with outsourcing is used. De"ne
vci": cost of capacity per package size,i"1, 2,2,N.
The overall capacity cost per time unit equals CRC,
CRC"c
FCH#cOE[(Dc0,R!CH)`].
SinceE[Dci] equals the capacity requirements per time unit for package sizei, it is good practice to assume that total capacity cost per time unit asso-ciated with package
By dividing this cost by the expected demand for package sizeiper time unit, we "nd
vci" ci
E[Dc
0]
(cFCH
`cOE[(Dc0,R!CH)`]). (3.8)
Now we use the de"nitions ofaandvci to obtain
vc
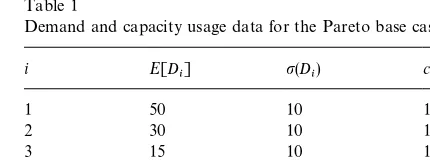
Table 1
Demand and capacity usage data for the Pareto base case
i E[D
i we thus computevi through
v
i"
vci
a, i"1, 2,2,N.
In the numerical experiments presented in Section
4 we"rst determineCHfor the capacity reservation
strategy with outsourcing given the value ofcfrom Eq. (3.1). Next we compute vci from Eq. (3.8) and
v
i from Eq. (3.9). Finally, we compute the total relevant costs from Eq. (2.1) (or equivalently Eq. (3.7)) for both capacity reservation strategies and compute the optimalCHfor both to decide which capacity reservation strategy is optimal.
4. Managerial insights
In this section we obtain managerial insights into the impact of a number of process characteristics on the choice of the capacity reservation policy. Since we deal with a complex problem with a large number of process characteristics interacting in some a priori unknown way, we consider only marginal e!ects of di!erences in one particular pro-cess characteristic. In order to make these marginal e!ects clear we use the following procedure. For each value of the process characteristic under con-sideration we determine all combinations ofaand
cvalues that yield identical total relevant costs for both capacity reservation policies. Knowing this iso-cost curve in the (a,c)-plane it is easy to deter-mine the optimal capacity reservation policy for a given combination of a and c. The impact of changes in the value of the process characteristics is determined by comparing the associated iso-cost curves in the (a,c)-plane.
Note thatadenotes the capacity cost per product as a percentage of the total value of the product and
cdenotes the "xed capacity cost per time unit as a percentage of the outsourced capacity cost per time unit. It is intuitively clear that the question whether to outsource or not highly depends on the values of a and c. If a is extremely small than capacity costs are only a very small portion of the overall relevant costs. In that case one should focus on keeping holding costs as low as possible. This implies that one should choose for outsourcing. If on the contrary capacity costs are a large part of
the total relevant costs, i.e.ais close to 1, then one should choose the"xed capacity reservation policy. Similarly, ifcis close to 1, then the cost of outsourc-ing is only marginally higher than the cost of owned capacity. In that case outsourcing is cost-bene"cial. If c is close to 0 than the cost of out-sourcing is extremely high, so one chooses the"xed capacity reservation policy at the expense of higher holding costs.
Although this reasoning is quite intuitive, it does not help very much for decision-making in practi-cal situations, because typipracti-cally in practice the above extreme (a,c) combinations do not exist. As indicated above the iso-cost curve in the (a,c)-plane provides us a powerful decision tool. Especially it is easy to determine the sensitivity of the decision taken with respect to errors in the estimation of
aandc.
The Pareto base case: In order to determine iso-cost curves for relevant practical cases we constructed a situation that obeys Pareto's law, i.e. a small number of package sizes accounts for the majority of turnover. The Pareto base case is described in Table 1.
For each of the package sizes we assume that the lead time to the local stockpoints equals two time units, i.e.¸
i"2 for alli. Furthermore, we assume
that the required "ll rate b
i"0.90. The capacity
reservation lead time¸
0equals three time units, the
review period is one time unit.
4.1. Impact of interest rates
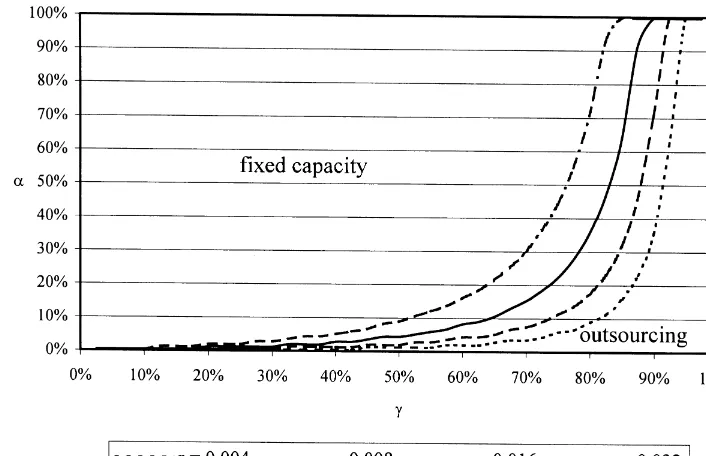
Fig. 1. Iso-cost curves for di!erent values of the interest rater.
expected overall relevant costs within a tolerance of 0.005. We varied the interest rate as 0.004, 0.008, 0.016 and 0.032. The interest rates 0.004 and 0.008 are comparable to a 20% and 40% interest rate on a yearly basis, when the time unit equals one week. The interest rates 0.016 and 0.032 are comparable to an interest rate of 20% and 40% on a yearly basis, when the time unit equals one month. The resulting iso-cost curve is presented in Fig. 1.
As expected we "nd that as the interest rate increases, it becomes more favourable to outsource capacity, since the cost of holding inventory increases. The capacity outsourcing policy always yields minimal holding costs. Another typical phe-nomenon of the iso-cost curves is the steep ascent beyond some critical value ofc. This indicates the dominant e!ect on total relevant costs of the cost of outsourcing capacity as compared with the cost of owned capacity.
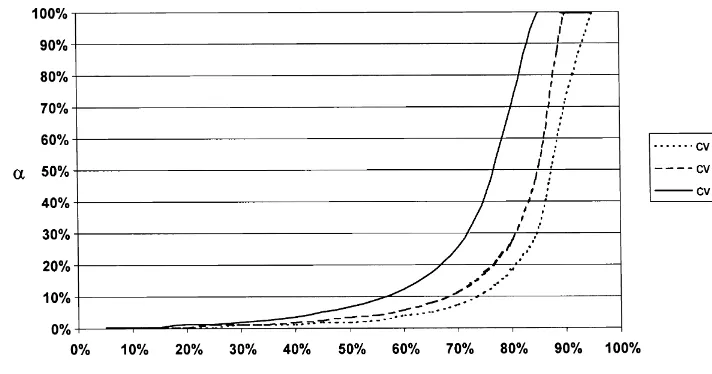
4.2. Impact ofvariability in demand
Another important process characteristic is demand variability. The measure we use for
de-mand variability is the coe$cient of variation. The coe$cient of variation (cv) is de"ned as the quo-tient of the standard deviation and the mean. To measure the impact of cv on the iso-cost curves we simpli"ed the Pareto base case with respect to the demand and capacity usage data. We consider four products with E[D
i]"100, ci"1, i"1, 2, 3, 4.
Lead time and "ll rate parameters remain un-changed. We assumedrequal to 0.004. We varied cv as 0.5, 1 and 2. In Fig. 2 we show the resulting iso-cost curves.
We"nd that the cv has a considerable impact on
Fig. 2. Iso-cost curves for di!erent values of cv.
Fig. 3. Iso-cost curves for di!erent capacity usage pro"les.
of idle capacity or lack of capacity. Thus the"xed capacity reservation strategy becomes more and more inadequate with increasing cv.
4.3. Impact of capacity usage distribution
Another process characteristic is the capacity usage per package size. It is not a priori clear whether di!erences in capacity usage have an impact on the choice of the optimal capacity reser-vation policy. To understand the impact of di!er-ences in capacity usage we consider the situation
described above, i.e. four di!erent package sizes each with E[D
i]"100 and cvi"1. We assume
that the average capacity usage equals 1. We as-sume that c
i"1#d(i!32), i"1, 2, 3, 4. We vary
das 0, 0.25 and 0.5. Increasing the value ofdimplies greater di!erences in capacity usage. With each value ofda di!erent capacity usage pro"le is asso-ciated. Fig. 3 shows the resulting iso-cost curves.
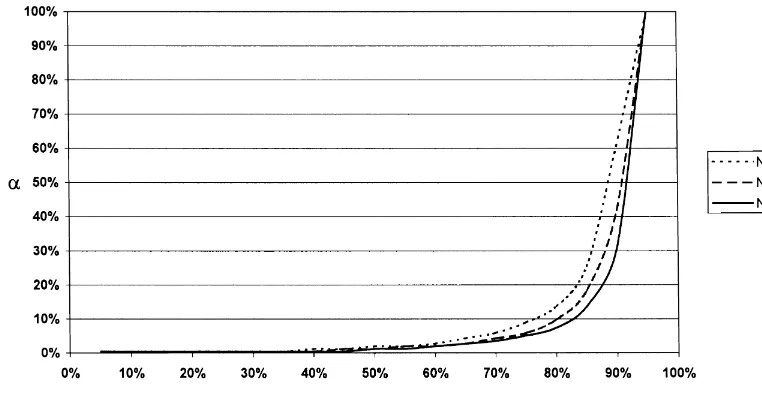
Fig. 4. Iso-cost curves for di!erent numbers of package sizes. phenomenon shows even stronger when comparing
the three cases with four package sizes with the case of one package size having the same aggregate demand and capacity usage characteristics, i.e.
E[D
1]"400 and cv1"12, and c1"1. Again we
"nd more or less the same iso-cost curve. Hence, the selection of the capacity reservation policy de-pends on the capacity usage pro"le only through its aggregate average usage.
4.4. Impact of number of package sizes
Another process characteristic considered here is the number of package sizes N. Again we assume identical demand and lead time characteristics for all N package sizes. Although it is clear that the larger theN, the larger the average capacity usage, the iso-cost curves in the (a,c)-plane are a means of comparing situations with di!erent numbers of package sizes, since the iso-cost curves do not change if all demands are multiplied by a "xed constant. We variedNas 4, 8 and 16. In Fig. 4 we show the iso-cost curves.
As expected we"nd a similar e!ect as observed in Fig. 2, where we have shown the impact of demand variability. Due to the increase in Nthe cv of the aggregate demand and aggregate capacity usage decreases. Due to this decrease in cv the
outsourc-ing option becomes less attractive as N increases. Note again the steep increase in the iso-cost curve beyondcequal to 80}90%.
This concludes our discussion of the impact of di!erent process characteristics on the choice of the capacity reservation policy. Our intention was to present some generic managerial insights. Of course, the"nal choice for one capacity reservation policy or the other depends on the particular process characteristics in the situation under con-sideration.
5. Conclusions and further research
evidence that such linear allocation policies are near-optimal. We used the so-called Balanced Stock rationing rule, because that policy ensures a minimal probability of imbalance.
The focus of this paper was on the choice between two types of capacity reservation policies:
a"xed capacity reservation policy and a policy that
outsources excess capacity demand beyond the available packaging capacity. Through appropriate normalization through the introduction of c, the cost of owned capacity as a percentage of the cost of outsourced capacity, anda, the cost of capacity as a percentage of the value of a product, it was possible to show some generic managerial insights. The most important observation is that there is some criticalcabove which it is bene"cial to out-source capacity and below which it is bene"cial not to outsource capacity. The value of the critical
cdepends on the process characteristics. Qualitat-ive insights are obtained into the impact of various process characteristics on the choice of the capacity reservation policy. One of the observations is that this choice depends mainly on the aggregate capa-city usage characteristics.
The analysis presented in this paper can be easily extended to multi-stage systems, where, after the capacity allocation phase the packaged products are shipped via a number of intermediate stock-points to the stockstock-points that satisfy customer de-mand. This analysis combines the results presented in this paper with the results in [10] for divergent multi-echelon systems. The key assumption made in this paper is the availability of su$cient product to be packaged. Further research is required to"nd
practically useful policies for the situation where this assumption is no longer valid.
References
[1] P. Glasserman, Bounds and asymptotics for planning criti-cal safety stocks, Operations Research 45 (1997) 244}257. [2] P. Glasserman, Allocating production capacity among multiple products, Operations Research 44 (1996) 724}734. [3] J.C. Fransoo, V. Sridharan, J.W.M. Bertrand, A hierarchi-cal approach for capacity coordination in multiple prod-ucts single-machine production systems with stationary stochastic demands, European Journal of Operations Research 86 (1995) 57}72.
[4] S. Graves, A.H.S. Rinnooy Kan, P.H. Zipkin (Eds.), Logis-tics of production and inventory, Handbooks in Opera-tions Research and Management Science, Vol. 4, Elsevier, Amsterdam, 1993.
[5] M.C. van der Heijden, Supply rationing in multi-echelon divergent systems, European Journal of Operational Research 101 (1997) 532}549.
[6] A.G. de Kok, A moment-iteration method for approximat-ing the waitapproximat-ing-time characteristics of the GI/G/1 queue, Probability Engineering and Informational Science 3 (1989) 273}287.
[7] E.A. Silver, D.F. Pyke, R. Peterson, Inventory Manage-ment and Production Planning and Scheduling, Wiley, New York, 1998.
[8] M.C. van der Heijden, E.B. Diks, A.G. de Kok, Stock allocation in general multi-echelon distribution systems with (R.S) order-up-to-policies, International Journal of Production Economics 49 (1997) 157}174.
[9] E.B. Diks, Controlling divergent multi-echelon systems, Ph.D. Thesis, Eindhoven University of Technology, The Netherlands, 1997.