European Journal of Agronomy 12 (2000) 163 – 173
Genetic differences for nitrogen uptake and nitrogen
utilisation efficiencies in winter wheat
Jacques Le Gouis *, Denis Be´ghin, Emmanuel Heumez, Pierre Pluchard
INRA,Laboratoire de Ge´ne´tique et Ame´lioration des Plantes,Domaine de Brunehaut,80200Estre´es-Mons,France
Received 22 June 1999; received in revised form 10 November 1999; accepted 16 November 1999
Abstract
Due to economic and ecological factors, European agricultural practices are likely to go towards extensive systems with lower inputs of nitrogen (N) fertilisers. The objective of this study was to assess varietal differences for N use at two nitrogen levels. A set of 20 winter wheat (Triticum aesti6umL.) genotypes was studied over 2 years in northern
France on a deep loam soil without (N0) and with 170 kg ha−1N fertiliser (N+) as ammonium nitrate. Results were
consistent on both years as the genotype×year or genotype×year×N level interactions were not significant. The genotype×N level interaction was highly significant except for total N utilisation efficiency (total above-ground dry weight/total above-ground N) and grain N concentration. The genotype×N level interaction for grain yield was mainly due to three contrasting genotypes: Cappelle, a cultivar from the 1940s, had the same yield at N0 and N+; Arche had a high yield at both N levels; and Re´cital had a high yield with added N and a very low one without N. The number of kernels/ear explained most of the variations of grain yield at N0 (48%) and N+ (80%), and of the interaction (67%). N uptake efficiency (total above-ground N/soil N supply) accounted for 64% of the variation in N use efficiency (grain yield/soil N supply), while at N0 and at N+ it accounted for only 30%. N utilisation efficiency (grain yield/total above-ground N) was then more important at N+ than at N0. Grain N explained most of total plant N variation at both N levels. The interaction for N use efficiency was best explained by the interaction of N uptake (63%). The applications of these results to a breeding programme to create varieties adapted to low-input management systems are discussed. © 2000 Elsevier Science B.V. All rights reserved.
Keywords:Winter wheat; Nitrogen utilisation efficiency; Nitrogen uptake efficiency
www.elsevier.com/locate/euragr
1. Introduction
Nitrogen (N) is one of the main inputs on winter wheat in high-input agricultural systems.
In a local survey of agricultural practices in north-ern France conducted in 1997, it represented 28% of the cost of inputs (Quie´vreux, 1997). It is also responsible for an important part of agriculture-related pollution through leaching or denitrifica-tion (Mariotti, 1997). During at least the past 30 years, the nitrate content of water has increased in the intensive cropping area of France (Mary et al.,
* Corresponding author. Tel.:+33-3-22857510; Fax:+ 33-3-22856996.
E-mail address:[email protected] (J. Le Gouis)
J.Le Gouis et al./Europ.J.Agronomy12 (2000) 163 – 173 164
1997). To address both economic and ecological issues, plant breeders would have to release culti-vars that minimise pollution risks and maximise farmers’ revenue. Limited pollution risks could be achieved either with low fertiliser rates or cultivars that better absorb N. Concerning N, high revenue should be obtained with a maximum yield and quality per unit of N applied. Plant breeding programmes must produce varieties that absorb N more efficiently and use it more efficiently to produce grain. To obtain a high seed protein content and good quality, most of the absorbed N would have to be translocated to the grain before maturity.
Field experiments have shown that genetic vari-ability for N uptake exists in small grains (Lo¨ffler et al., 1985; Van Sanford and MacKown, 1986; Fossati et al., 1993). Genotypic variation has also been reported for N utilisation efficiency expressed as the ratio of grain yield to total plant N (Cox et al., 1985; Van Sanford and MacKown, 1987; Dhugga and Waines, 1989; May et al., 1991). N uptake explains variation in grain yield more than N utilisation (Van Sanford and MacKown, 1987; Dhugga and Waines, 1989; May et al., 1991).
Moll et al. (1982), on corn (Zea mays L.), and Dhugga and Waines (1989), on hexaploid spring wheat and tetraploid spring wheat (Triticum tur
-gidum L.), have shown that N uptake efficiency
becomes more important than N utilisation effi-ciency in determining N use effieffi-ciency as soil N supply increased. However, Ortiz-Monasterio et al. (1997), for bread wheat, reported an inverse result. These studies were carried out in conditions where grain yields were low compared with northern France. Moreover, they did not address the geno-type×N level interaction, which was generally significant.
The objective of this study was to investigate the variability of N uptake and N utilisation efficiencies among winter wheat cultivars and to assess their relative importance in potentially high-yielding conditions.
2. Materials and methods
The experiment was conducted with 36 winter
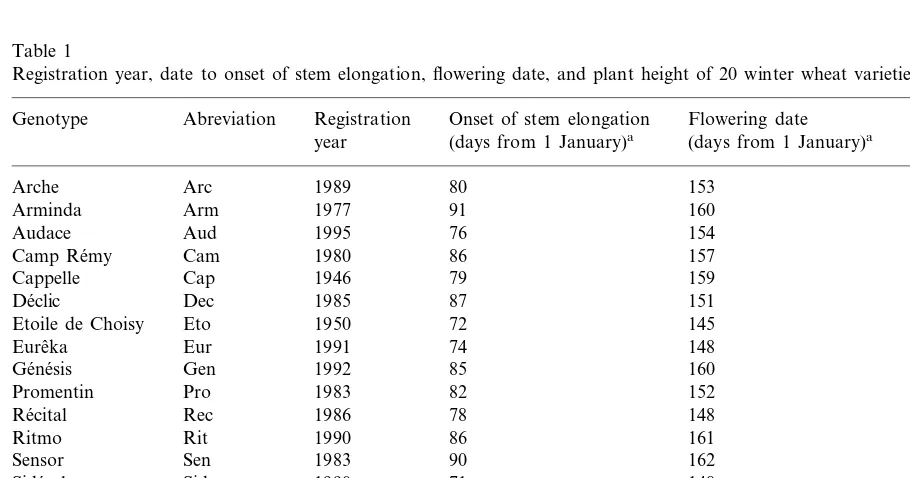
wheat genotypes in 1993 – 1994 and with 30 geno-types in 1994 – 1995. Results presented here are from 20 genotypes common to both years. Except for VM014, a line from our plant-breeding pro-gramme, all the other genotypes are cultivars registered in France between 1946 and 1995 (Table 1). The cultivars were primarily chosen to ensure a wide range of heading dates. Two old cultivars, Cappelle and Etoile de Choisy, were chosen to see how they would perform at low N level compared with modern cultivars. They were registered in France in the late 1940s and Cappelle remained the most cultivated variety until the end of the 1960s. They were bred at a time when pesticides and chemical fertilisers were not commonly used and it could be assumed that they would do well at low N level.
Trials were sown on 8 October 1993 and 6 October 1994 at Estre´es-Mons INRA experimental station (Somme, northern France). The soil, classified as a deep loam soil (Orthic Luvisol, FAO classification), contained an average of 19 g kg−1
organic matter and was of pH 8.1. Soil samples were found to have 64 kg ha−1
(7 February 1994) and 56 kg ha−1(8 February 1995) mineral N in the
upper 120 cm profile. The experimental design was a randomised complete block design with three replications and a factorial combination of two N levels. Control plots received no N (N0), while fertilised plots (N+) were treated with 170 kg ha−1
N as ammonium nitrate, one-half at tillering and one-half at the beginning of stem elongation. Two N levels only were applied as it is difficult to test more N levels within the frame of a plant-breeding programme with many different lines. The first N level (N+) was considered to be representative of current agricultural practices in the region of the present study. The second (N0) was an extreme condition not likely to occur on a farm, but it was chosen in order to maximise the probability to differentiate genotypes.
Each plot, consisting of six 5-m rows, 0.2 m apart, was sown at a density of 300 grains m−2.
Following local agricultural practices, two growth regulators were sprayed to reduce the risk of lodging (762 g ha−1
J.Le Gouis et al./Europ.J.Agronomy12 (2000) 163 – 173 165
chloride+77 g ha−1choline chloride
+22 g ha−1
imazaquine). Pesticide treatments were applied to achieve total control of parasites.
Dates to onset of stem elongation were recorded on one block for N+ as the number of days from planting until 50% of the plants reached 1 cm ear length stage (Kirby and Apple-yard, 1984). Flowering dates were also recorded on one block for N+as the number of days from planting until stamens were visible on 50% of the spikes. Before mechanical harvest with a plot combine, about 150 shoots were randomly cut at ground level on all six rows and then oven-dried at 80°C for 48 h.
These shoots were used to estimate thousand-kernel weight (TKW), number of thousand-kernels per ear, harvest index (HI), grain N concentration and straw+chaff N concentration. N concentrations were measured with a near-infrared reflectance analyser (Technicon InfraAlyzer 400; Technicon Instruments Corporation, Tarrytown, NY, USA)
calibrated against a Dumas procedure (Dumas, 1831). Grain dry weight was estimated as the sum of plot harvest plus grain weight of the shoot samples. Total above-ground dry weight and number of ears per square metre were computed from grain dry weight, HI, TKW and number of kernels per ear. Nitrogen harvest index (NHI) was calculated as grain N/total above-ground N.
N use efficiency for grain yield (NUEgdw) has been defined as grain dry weight/N supply. N supply is considered to be soil mineral N in the upper 120 cm profile measured in early February plus applied N. We did not take into account N that could be available deeper in the soil or that was released by mineralisation of organic matter after soil mineral N was measured. Grain N utili-sation efficiency has been defined as grain dry weight/total above-ground N. In the same man-ner, total N utilisation efficiency, also termed as biological yield production efficiency by May et
Table 1
Registration year, date to onset of stem elongation, flowering date, and plant height of 20 winter wheat varieties Abreviation
Genotype Registration Onset of stem elongation Flowering date Plant height (days from 1 January)a
(days from 1 January)a (cm)b
year
Arc 85
Arche 1989 80 153
Arm 1977
Arminda 91 160 93
1995 76 154 83
Audace Aud
Camp Re´my Cam 1980 86 157 88
Cappelle Cap 1946 79 159 101
81 151
87
De´clic Dec 1985
1950 72 145 99
Etoile de Choisy Eto
Eur 1991
Eureˆka 74 148 86
Ge´ne´sis Gen 1992 85 160 79
152
82 87
1983 Pro
Promentin
Re´cital Rec 1986 78 148 77
1990 86 161 86
Ritmo Rit
Sen 1983
Sensor 90 162 98
Sid 1990
Side´ral 71 148 85
Soi 1987
Soissons 83 150 80
76 1973
Tal
Talent 148 79
The 1983 81 150 79
The´se´e
Tre 1992
Tre´mie 75 149 79
VM014 V14 – 83 159 79
1986
Vik 81
Viking 154 95
J.Le Gouis et al./Europ.J.Agronomy12 (2000) 163 – 173 166
al. (1991) or biomass production efficiency by Ortiz-Monasterio et al. (1997), is defined as total above-ground dry weight/total above-ground N. Total above-ground N/N supply has been termed N uptake efficiency. N use efficiency for grain N yield (NUEgn) was defined as grain N/N supply. Analysis of the contribution of the variation of component traits to the variation of the resultant trait was carried out as presented by Moll et al. (1982), Dhugga and Waines (1989). If Yn is the
log of a resultant trait and X1n, X2n the logs of
two component traits at the nth N level, then
Yn=X1n+X2n. S(X1nYn)/SY
2
n and S(X2nYn)/ SY2
n represent the net contribution of each
com-ponent to the dependent trait both directly and indirectly through the other variables (Dhugga and Waines, 1989). We extended this analysis to the G×N interaction in the same way. It was then possible to assess the contribution of the G×N interaction of each component trait to the interaction of the resultant trait. The following analyses were carried out:
log(grain dry weight)
=log(number of ears per m2)
+log(number of kernels per ear)
+log(TKW)
log(NUEgdw)
=log(N uptake efficiency)
+log(total N utilisation efficiency)+log(HI)
log(grain N)
=log(grain dry weight)
+log(grain N concentration)
log(NUEgn)
=log(N uptake efficiency)+log(HI)
When the genotype×N level (G×N) interac-tion was significant for a character X, we com-puted the Wricke (1962) ecovalence (Wg
2) of the
genotypeg as:
Wg
2
= %
N
n=1
(Xgn.−Xg..−X.n.+X…) 2
where n is the N level, Xg..the mean of genotype
g over all N levels and years,X.n.the mean of N
level n over all genotypes and years and X… the
general mean. The ecovalence (%) represents the part of the sum of squares of the interaction that may be attributed to a genotype.
3. Results
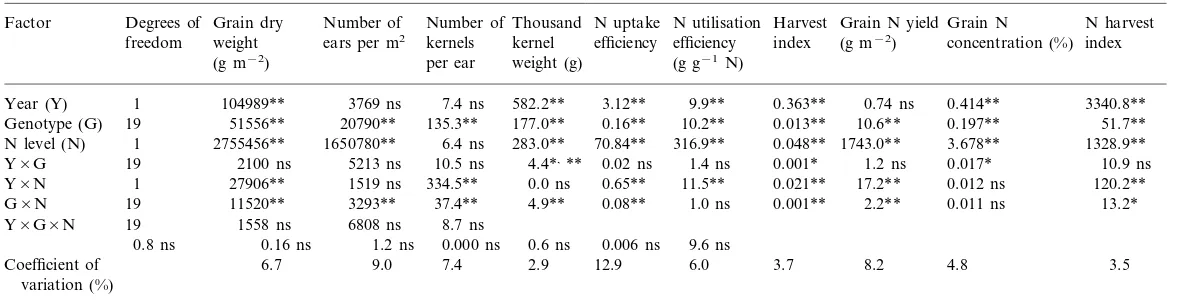
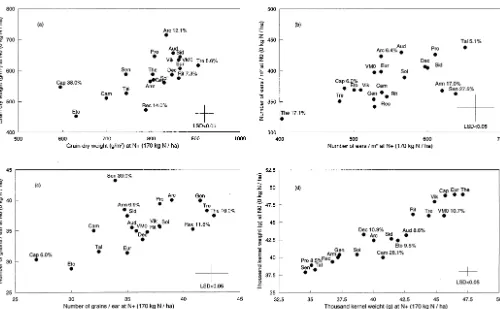
Analysis of variance showed significant differ-ences among genotypes for all traits (Table 2). Although differences between the two different years were generally significant, results were con-sistent, as the year×genotype interaction was significant only for TKW, HI and grain N con-centration, and the year×genotype×N level in-teraction was never significant. Results will then be presented averaged over the 2 years. Differ-ences between the two N levels were always sig-nificant except for number of kernels/ear. The G×N interaction was significant for all traits except for total N utilisation efficiency and grain N concentration. All the traits for which this interaction was significant are represented in Figs. 1 and 2.
3.1. Grain yield and yield components
Grain yield decreased from 799 g m−2 on
average at N+ to 584 g m−2 at N0 (Fig. 1a).
J
.
Le
Gouis
et
al
.
/
Europ
.
J
.
Agronomy
12
(2000)
163
–
173
167
Table 2
Analysis of variance (mean squares) of agronomic characteristics of 20 winter wheat genotypes cultivated for 2 years at two N levelsa
Number of Number of Harvest
Grain dry Degrees of
Factor Thousand N uptake N utilisation Grain N yieldGrain N N harvest
freedom weight ears per m2 kernels kernel efficiency efficiency index (g m−2) concentration (%) index weight (g) (g g−1 N)
(g m−2) per ear
7.4 ns 582.2** 3.12** 9.9** 0.363** 0.74 ns 0.414** 3340.8** 1
Year (Y) 104989** 3769 ns
0.16** 10.2** 0.013** 10.6** 0.197**
177.0** 51.7**
19
Genotype (G) 51556** 20790** 135.3**
283.0**
1 2755456** 1650780** 6.4 ns 70.84** 316.9** 0.048** 1743.0** 3.678** 1328.9** N level (N)
10.5 ns 4.4*,** 0.02 ns 1.4 ns 0.001* 1.2 ns 0.017* 10.9 ns 2100 ns
Y×G 19 5213 ns
0.65** 11.5** 0.021** 17.2** 0.012 ns
0.0 ns 120.2**
Y×N 1 27906** 1519 ns 334.5**
0.08** 1.0 ns 0.001** 2.2** 0.011 ns
G×N 19 11520** 3293** 37.4** 4.9** 13.2*
Y×G×N 19 1558 ns 6808 ns 8.7 ns
0.000 ns 0.6 ns 0.006 ns 9.6 ns 0.8 ns 0.16 ns 1.2 ns
2.9 12.9 6.0 3.7 8.2 4.8 3.5
7.4
Coefficient of 6.7 9.0
variation (%)
J
.
Le
Gouis
et
al
.
/
Europ
.
J
.
Agronomy
12
(2000)
163
–
173
168
J
.
Le
Gouis
et
al
.
/
Europ
.
J
.
Agronomy
12
(2000)
163
–
173
169
J.Le Gouis et al./Europ.J.Agronomy12 (2000) 163 – 173 170
was the only genotype that lodged on both years (data not shown).
The number of ears per m2 (Fig. 1b) was the
yield component that changed the most between N levels, values decreased, on average, from 549 at N+ to 382 ears m−2 at N0. All cultivars had
fewer ears at N0 than at N+. The cultivars with the highest ecovalence were Sensor, The´se´e and Arminda. Sensor and Arminda were most affected by N deficiency, losing, respectively, 43 and 41% of their ears. The´se´e had a very small number of ears m−2
at both N levels.
The average number of kernels per ear (Fig. 1c) was not significantly different between N levels (35.8 kernels per ear at N0 and 36.1 kernels per ear at N+). The G×N interaction was, how-ever, significant and while the grain number in-creased from N0 to N+ for Sensor, Cappelle and Arminda, it decreased for The´se´e, Tre´mie, Re´cital and Eureˆka.
TKW (Fig. 1d) was significantly higher at N0 (43.1 g) than at N+ (40.9 g). However, five genotypes, VM014, Audace, Etoile de Choisy, Side´ral and Camp Re´my, did not have increased TKW from N+to N0. They were responsible for most of the G×N interaction. De´clic showed the highest increase in TKW from N+ to N0.
3.2. N use efficiency for grain yield and its
components
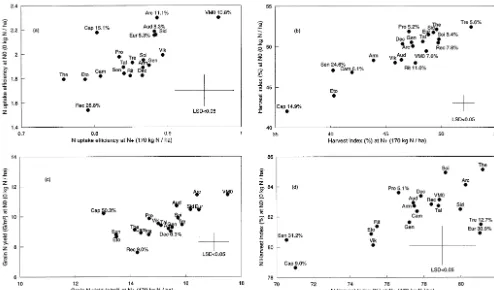
The three components of N use efficiency are N uptake efficiency, total N utilisation efficiency and harvest index. N uptake efficiency (Fig. 2a) was higher at N0 (1.96) than at N+ (0.85). Four genotypes, Re´cital, Cappelle, Arche and VM014, were responsible of about two-thirds of the G×N interaction. Re´cital had a very low N uptake efficiency at both N levels, while Arche and VM014 ranked among the highest ones. Cappelle had a high N uptake efficiency without N and a low one with added N.
Total N utilisation efficiency ranged from 92.2 to 115.0 g g−1 N at N0 and from 80.3 to 97.1 g
g−1 N at N
+. The G×N interaction was not significant. Eureˆka was the only genotype that showed no significant difference between the two N levels. Sensor had a significantly higher mean
than all the other genotypes except Viking and Ritmo. Talent had the significantly lower one except for VM014 and Soissons.
Mean harvest index (Fig. 2b) was significantly lower at N+ (46.3%) than at N0 (49.2%). How-ever, six genotypes showed no significant differ-ences between the two N levels: Tre´mie, Soissons, Re´cital, VM014, Ritmo and Audace. Sensor had the highest ecovalence as it was characterised by the highest increase between N+ and N0 for this component.
3.3. Grain N yield
Grain N yield (Fig. 2c) was higher at N+ (15.1 g m−2) than at N0 (9.6 g m−2) and the difference
was significant for all cultivars. The breeding line VM014 had the highest mean at N+ and, along with Arche and Audace, the highest at N0. Cap-pelle represented one-half of the G×N interac-tion as it had a high grain N yield at N0 compared with N+.
Grain N concentration ranged from 1.50 to 1.92% at N0 and from 1.70 to 2.15% at N+. All the cultivars had a lower value at N0 and the G×N level interaction was not significant. The two old cultivars, Cappelle and Etoile de Choisy, had the highest mean concentrations.
Mean N harvest index (Fig. 2d) was signifi-cantly higher at N0 (82.3%) than at N+ (77.4%). The difference was, however, not significant for Tre´mie, Eureˆka and Side´ral. The cultivar Sensor, which had the highest ecovalence, along with Cappelle, had the lowest NHI at N+.
3.4. Contribution of components to grain yield
and grain N yield
J.Le Gouis et al./Europ.J.Agronomy12 (2000) 163 – 173 171 Table 3
Contribution of the components traits to the sum of squares of the resultant trait in 20 winter wheat genotypes grown over 2 years at each N level and for the genotype×N level interaction
N level
Resultant traita Component traits Genotype×N level
interaction N0 (0 kg N N+(170 kg N
ha−1) ha−1)
0.32 0.10
Log(grain yield) Log(number of ears per m2) 0.32
0.48 0.80
Log(number of kernels per ear) 0.67
0.21 0.10 0.01
Log(thousand-kernel weight)
0.64 0.31
Log(N uptake efficiency) 0.63
Log(NUEgdw)
Log(total N utilisation efficiency) 0.15 −0.03 0.07
0.22 0.71
Log(harvest index) 0.30
Log(grain yield)
Log(grain N yield) 0.85 1.13 1.11
0.15
Log(grain N concentration) −0.14 −0.11
0.98 0.64
Log(N uptake efficiency) 0.84
Log(NUEgn)
0.02 0.34 0.15
Log(N harvest index)
aNUE, N use efficiency; NUEgdw=grain yield/N supply; NUEgn=grain N yield/N supply; N uptake efficiency=total above-ground N/N supply; Total N utilisation efficiency=total above-ground dry weight/total above-ground N.
N uptake efficiency accounted for more of the variation of N use efficiency for grain yield at N0 than at N+. It was the opposite for harvest index, while total N utilisation efficiency ex-plained little of any variation. The G×N interac-tion for N use efficiency was best explained by the interaction of N uptake, and then by the interac-tion of HI.
Grain yield explained most of the variation of grain N yield at N0 and N+ and also most of the G×N interaction. N uptake efficiency explained all the variation of N use efficiency for grain N yield without N and two-thirds of it with added N. Its interaction explained also most of the interaction of this N use efficiency.
4. Discussion
This experiment showed that varietal differ-ences exist for grain yield without added N. With a mean yield of 5.8 t ha−1, however, N0 could be
at least considered as a medium yielding condi-tion. Even if plant breeders produce cultivars adapted to present European high yielding condi-tions, some of the modern varieties tested per-formed well in conditions where N was comparatively low. The old cultivar Cappelle,
bred in the 1940s when chemical fertilisers were not commonly used, showed a relatively high N uptake efficiency at N0 (Fig. 2), but it was possi-ble to find modern cultivars with equivalent or better performances (Arche, VM014, Audace, Side´ral and Eureˆka). Ortiz-Monasterio et al. (1997) estimated the genetic progress at different N levels with ten of CIMMYT’s bread wheat cultivars bred in medium – high conditions (120 – 200 kg N ha−1). Comparing two N levels where
lodging did not occur, they found that the genetic progress has been the same at N0, low N level, and N75, medium N level (they did not asses soil N supply but it was low).
J.Le Gouis et al./Europ.J.Agronomy12 (2000) 163 – 173 172
low-input environments. He showed that lines selected for high yield in favourable environments yield more in medium to high yielding conditions than lines selected in less favourable conditions. They yield less, however, in the less favourable sites.
Grain yield is the final result of different steps that can be studied through the yield components. The stress we applied, an early and severe stress as no fertiliser was applied, had different effects on the three main yield components. While the mean number of ears per m2
decreased from N+ to N0, the mean number of kernels per ear remained the same and the mean TKW increased. All culti-vars had less ears per m2 at N0 compared with
N+. Sensor and Arminda had less ears than the others. They are two very late flowering varieties (Table 1) that were the latest to reach the stage of beginning stem elongation. Cultivar development timing may thus interact with the availability of N in the soil. As we did not monitor tillering, it was not possible to know whether N deficiency af-fected more tiller production or tiller survival. While the mean number of kernels per ear was the same at N0 and N+, it increased for some and decreased for others. This was not directly related to the decrease in the number of ears per m2
even if Sensor and Arminda were among the varieties for which the number of kernels per ear increased from N+ to N0. Re´cital had both lower number of ears per m2 and lower number of kernels per
ear at N0 than at N+. TKW was not higher for some cultivars at N0, although the number of kernels per m2 was always lower at N0 compared
with N+. For these lines, either they had reached their maximum TKW or N deficiency so altered the source, photosynthetic or storage capacity, that grain filling was hindered.
We showed that the G×N interaction for grain yield was best explained by the interaction of the number of kernels per ear (Table 3). The number of kernels per ear is determined during a long period from the double ridge stage to anthesis. This is the result of the differentiation of spikelets and then florets, of which only a part will fully develop to be receptive at flowering. As we did not estimate the different components of the num-ber of kernels per ear, we could not identify which
of these was more important. Competition within and between plants is likely to occur as tillering and stem elongation will also take place during this period.
N uptake efficiency data on Fig. 2a showed that at N0, more N was recovered at maturity than was present when residual soil N was measured (February). This N presumably originated mainly from organic matter N mineralisation. Differences between residual soil N in the upper 120 cm and total above-ground N at maturity were 50 and 63 kg N ha−1
in 1994 and 1995, respectively. Like Moll et al. (1982), Dhugga and Waines (1989), Ortiz-Monasterio et al. (1997), our data showed that the contribution of N uptake efficiency and grain N utilisation efficiency were dependent on N level. In agreement with Ortiz-Monasterio et al. (1997), we found that N uptake efficiency ac-counted more for the variation in N use efficiency at N0 than at N+. When grain N utilisation efficiency was further analysed, it was shown that HI was more important than total N utilisation efficiency in explaining the variation (Table 3), especially at N+. When N is rare, the ability to absorb N is certainly of paramount importance and would then be related to root characteristics. It may be hypothesised that differences for the ability to explore the soil or to absorb N existed in the material we tested. When N is not the limiting factor, N utilisation efficiency or harvest index have to be more determinant as N will be available for each genotype independent of the efficiency of their root system.
J.Le Gouis et al./Europ.J.Agronomy12 (2000) 163 – 173 173
showed that the G×N interaction for N uptake efficiency explained most of the variation of the interaction for grain yield.
As our data have shown that genetic variability exists for grain yield at low N level, a breeding programme is under way using, as parents, some of the cultivars investigated in this study. To take into account the G×N interaction, field experi-ments are carried out at two N levels. The aim of this programme is to breed cultivars performing well under low input management systems. Resis-tance to lodging and common diseases will also be taken into account to limit the use of growth regulators and fungicides.
References
Austin, R.B., Bingham, J., Blackwell, R.D., Evans, L.T., Ford, M.A., Morgan, C.L., Taylor, M., 1980. Genetic improvements in winter wheat yields since 1900 and associ-ated physiological changes. J. Agric. Sci.. Camb. 94, 675 – 689.
Ceccarelli, S., 1996. Adaptation to low/high input cultivation. Euphytica 92, 203 – 214.
Cox, M.C., Qualset, C.O., Rains, D.W., 1985. Genetic varia-tion for nitrogen assimilavaria-tion and translocavaria-tion in wheat. II. Nitrogen assimilation in relation to grain yield and protein. Crop Sci. 25, 435 – 440.
Dhugga, K.S., Waines, J.G., 1989. Analysis of nitrogen accu-mulation and use in bread and durum wheat. Crop Sci. 29, 1232 – 1239.
Dumas, J.B.A., 1831. Proce´de´s de l’analyse organique. Ann. Chim. Phys. 2, 198 – 213.
Fossati, D., Fossati, A., Feil, B., 1993. Relationship between grain yield and grain nitrogen concentration in winter triticale. Euphytica 71, 115 – 123.
Kirby, E.J.M., Appleyard, M., 1984. Cereal Development Guide. Arable Unit, National Agricultural Centre, Stoneleigh, Warwickshire, UK.
Lo¨ffler, C.M., Rauch, T.L., Busch, R.H., 1985. Grain and plant protein relationships in hard red spring wheat. Crop Sci. 25, 521 – 524.
Mariotti, A., 1997. Quelques re´flexions sur le cycle bio-ge´ochimique de l’azote dans les agrosyste`mes. In: Lemaire, G., Nicolardot, B. (Eds.), Maıˆtrise de l’Azote dans les Agrosyste`mes, Reims, 19 – 20 Novembre 1996, Les Collo-ques n°83. INRA Editions, Versailles, France, pp. 9 – 22. Mary, B., Beaudoin, N., Benoit, M., 1997. Pre´vention de la
pollution nitrique a` l’e´chelle du bassin d’alimentation en eau. In: Lemaire, G., Nicolardot, B. (Eds.), Maıˆtrise de l’Azote dans les Agrosyste`mes, Reims, 19 – 20 Novembre 1996, Les Colloques n°83. INRA Editions, Versailles, France, pp. 289 – 312.
May, L., Van Sanford, D.A., MacKown, C.T., Cornelius, P.L., 1991. Genetic variation for nitrogen use in soft red×hard red winter wheat populations. Crop Sci. 31, 626 – 630.
Moll, R.H., Kamprath, E.J., Jackson, W.A., 1982. Analysis and interpretation of factors which contribute to efficiency of nitrogen utilization. Agron. J. 74, 562 – 564.
Ortiz-Monasterio, J.I., Sayre, K.D., Rajaram, S., McMahon, M., 1997. Genetic progress in wheat yield and nitrogen use efficiency under four nitrogen rates. Crop Sci. 37, 898 – 904. Quie´vreux, D., 1997. Re´seau d’observation de parcelles de ce´re´ales. In: Re´sultats de la Re´colte 1997. Chambre d’Agri-culture de la Somme, Amiens, France.
Van Sanford, D.A., MacKown, C.T., 1986. Variation in nitro-gen use efficiency among soft red winter wheat nitro-genotypes. Theor. Appl. Genet. 72, 158 – 163.
Van Sanford, D.A., MacKown, C.T., 1987. Cultivar differ-ences in nitrogen remobilization during grain fill in soft red winter wheat. Crop Sci. 27, 295 – 300.
Wricke, G., 1962. Uber eine methode zur erfassung der o¨kolo-gischen streubreite in feldversuchen. Z. Pflanzenzu¨cht. 47, 92 – 96.
.