IN
2002
MARTINJ. WATTS*
I
n this review, we provide a description of the macroeconomic environment prevailing in 2002, as a backdrop to an analysis of movements in wages, with particular reference to the Safety Net Adjustment in May. We conclude that there is no evidence of an acceleration of wage growth in 2002. A number of rulings and legislative changes that impact on wage setting are assessed.INTRODUCTION
The share of employees on awards only continued to diminish in 2002, with the main increase in coverage being the number of workers on individual registered and unregistered agreements. Aggregate wage growth remained modest and provoked little direct comment from the Reserve Bank of Australia (RBA) in its quarterly statements on monetary policy. The federal government tried to curtail what they perceived to be pattern bargaining by amending the
Workplace Relations Act 1986.
The Industrial Relations Commission awarded a flat $18 increase at the annual Safety Net Case in May. This increase provoked the usual round of criticisms by conservative politicians and industry leaders. Public attention was mainly focused on executive payouts, which had preceded some of the corporate collapses in 2001 and 2002. At the same time, workers were trying to secure their entitle-ments against economic, legal and political obstacles. A decision by the Full Bench of the Federal Court overturned an earlier decision that had outlawed strike action by the Australian Workers Union (AWU) in support of the imposition of bargaining fees. The year ended with recommendations by the Human Rights and Equal Opportunity Commissioner (HREOC) about the provision of federally funded paid maternity leave (Goward 2002b), but the government remained non-committal about whether to support the proposal.
In the following section, I shall examine the macroeconomic environment within which wage setting took place. This will be followed by an examination of wage outcomes in 2002. In the penultimate section, I shall outline key develop-ments in industrial relations and labour market legislation, along with decisions of the AIRC, which have impacted on the wages and conditions of Australian workers. Concluding comments are provided in the final section.
MACROECONOMIC BACKGROUND
Macroeconomic forecasts play a key role in the annual deliberations of the Australian Industrial Relations Commission (AIRC) on the appropriate safety net adjustment for award-reliant workers. In addition, these forecasts influence the level of the cash rate set by the RBA and hence, the structure of interest rates, which impact on households’ living standards.
The RBA (2002b) noted that growth prospects for the world economy exhibited two distinct phases during 2002, with a gradual recovery expected during the first six months, which was followed by slower growth in the second half of the year.
In its assessment released in September, the International Monetary Fund (IMF) forecast of world growth for 2003 was 3.7 per cent, as compared to 2.8 per cent in 2002. The Australian economy proved to be more resilient with the growth rate being 3.7 per cent in the 12 months to September 2002, which was largely driven by the growth of domestic demand via the sustained growth in consumption, a revival in business investment and the boom in the housing sector (ABS 2002a).
Monetary policy
At its May meeting, the RBA Board raised the cash rate by 25 basis points from a low of 4.25 per cent. The Australian economy had been maintaining a reasonable growth rate and prospects for the world economy were continuing to improve. The Board feared that ‘maintaining the cash rate at such a low level risked amplify-ing inflationary risks and fuellamplify-ing other imbalances that could jeopardise a continu-ation of the current economic expansion’. (RBA 2002a).
This increase and the subsequent 25 basis point increase in June 2002 were further examples of the RBA’s pre-emptive approach to monetary policy, despite the absence of any firm evidence about rising inflation. There is a consensus across a broad range of macroeconomic research that a recession has a long-standing deleterious impact on the economy through persistently higher unemployment. Disagreement persists over which rates of economic growth and inflation are sustainable in Australia.
Over the 12 months up to September, the headline rate of inflation of 3.2 per cent remained within the acceptable band defined by the RBA (2002b, p. 50). There was little pressure from rising wage costs. The bank’s assessment was that the underlying inflation rate was about 2.75 per cent,1which would con-tinue in 2003, given the weak, but uncertain, outlook for the global economy. The bank correctly anticipated that the actual rate would be higher in the short term, reflecting the influence of the drought on food prices.
WAGE DETERMINATION IN2002
Coverage and content of agreements
There are three major sources of Australian data on the different types of extant agreement. Preliminary Australian Bureau of Statistics (ABS) data on employee earnings are available for May 2002 (ABS 2002b), but have limited data on differ-ent types of agreemdiffer-ent. The Departmdiffer-ent of Employmdiffer-ent and Workplace Relations (DEWR 2002) collects data on registered federal agreements and the Australian Centre for Industrial Relations Research and Training (ACIRRT) collects data on registered state and federal agreements.
The first comprehensive ABS data set on the distribution of employees across different types of federal and state agreements and the associated rates of pay was released in March 2001 and was based on a survey conducted in May 2000 (ABS 2000). In May 2000, 23.2 per cent of workers were covered by awards only, 36.7 per cent by registered and unregistered collective agreements, and the remainder by registered and unregistered individual agreements. By compari-son, in May 2002, there were 21 per cent of all employees on awards only, representing 25.1 per cent of private sector employees and five per cent of public sector employees, and 37 per cent of all employees were covered by collective agreements (ABS 2002b).2Thus, the coverage of individual agreements, including common law contracts and registered individual agreements such as Australian Workplace Agreements, increased faster than collective agreements. In May 2002, there was a positive relationship between the incidence of collec-tive agreements and the number of employees per enterprise. On the other hand, there was a greater incidence of individual agreements in enterprises with fewer employees.
At the end of September 2002, there were 14 450 federal wage agreements covering an estimated 1 537 700 employees, who represented approximately 16.5 per cent of all employees, whereas there were 11 755 federal wage agree-ments current in September 2001, covering an estimated 1 362 100 employees (DEWR 2002). At the end of 2001, the approved AWAs covered over 215 000 workers across 3 746 separate organisations (DEWR 2002). Since 1998, 88 per cent of AWAs have been lodged by the private sector. At the end of 2001, the retail trade accounted for 17 per cent of AWAs, property and business services (16 per cent), transport and storage (10 per cent) and the government administration and defence (10 per cent).
Money wage growth
However, from the diverse sources of wage data analysed below, there is no compelling evidence of an acceleration of wage growth in 2002.
No meaningful comparisons are possible of wage data across different types of agreement from the ABS publications (2000 2002b). The computed average rates of annualised wage growth across the different types of agreement are implausible, which suggests that the statistical noise from including all workers of all ages, who are working part-time and full-time, is considerable.
Full-time adult Average Weekly Ordinary Time Earnings (AWOTE) rose 4.9 per cent in the 12 months to August 2002, while male and female AWOTE rose by 4.6 per cent and 5.1 per cent respectively (AUSSTATS). The full-time adult AWOTE of $879.4 in August 2002 was more than double the federal minimum wage of $431.40. The annual increases in full-time adult AWOTE ranged from 9.8 per cent for Manufacturing, 7.6 per cent in Property and Business services to -1.62 per cent in Transportation and Storage, with the latter figure suggesting a change in weekly hours worked or compositional change within the industry.
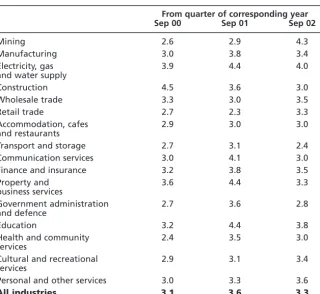
Table 1 Annual percentage increases in ordinary time hourly rates of pay index, exclud-ing bonuses, by industry, September 2000–2002
From quarter of corresponding year
Sep 00 Sep 01 Sep 02
Mining 2.6 2.9 4.3
Manufacturing 3.0 3.8 3.4
Electricity, gas 3.9 4.4 4.0
and water supply
Construction 4.5 3.6 3.0
Wholesale trade 3.3 3.0 3.5
Retail trade 2.7 2.3 3.3
Accommodation, cafes 2.9 3.0 3.0
and restaurants
Transport and storage 2.7 3.1 2.4
Communication services 3.0 4.1 3.0
Finance and insurance 3.2 3.8 3.5
Property and 3.6 4.4 3.3
business services
Government administration 2.7 3.6 2.8
and defence
Education 3.2 4.4 3.8
Health and community 2.4 3.5 3.0
services
Cultural and recreational 2.9 3.1 3.4
services
Personal and other services 3.0 3.3 3.6
All industries 3.1 3.6 3.3
During 2002, wage growth, as measured by the fixed weight Wage Cost Index, was 3.3 per cent in the year to September 2002 (ABS 2002c).3This was beneath the RBA’s target band of 3.5–4.5 per cent and represents a slight moderation of the rate compared to the year to September 2001. There was little difference between the growth rates for the public and private sectors, although simple comparisons must be made with caution because their respective occupational compositions differ markedly. Table 1 shows the annual percentage change in the wage cost indexes by industry. The fixed weights appear to significantly reduce the wage variability.
Data from DEWR show that since September 2000, the average annualised increase for all existing agreements has exhibited a very slow trend increase from 3.6 per cent. DEWR (2002) also reported that there was no evidence of an acceleration of wage growth during 2002, with federal wage agreements formalised in the September quarter paying an average annualised wage increase (AAWI) of 4.1 per cent, up from 3.6 per cent in the June quarter. Utilising the employment weights associated with June 2002, DEWR estimate that 0.3 percentage points of the increase represents compositional change.
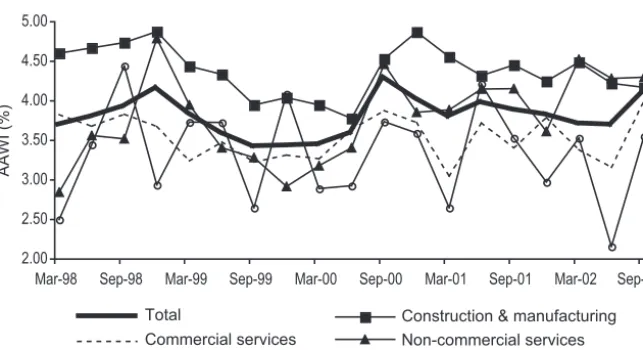
Figure 1 shows quarterly AAWIs per employee across groups of industries for new agreements certified in the corresponding quarter across industry groups from March 1998 to September 2002, based on DEWR data. These new wage agreements, while exhibiting considerable volatility provide some indication of recent developments in the wages system, although in September 2002, for example, they only represented 9.5 per cent of extant agreements.
Construction and manufacturing consistently yield the highest AAWIs. Agriculture and mining exhibit extreme volatility that probably reflects the relatively few agreements finalised in each quarter. Commercial services have generally exhibited the lowest AAWI, but this group comprises somewhat hetero-geneous industries, ranging from Wholesale and Retail Trade to Finance and Insurance.
ACIRRT (2002c, p. 5) reports an average annual percentage wage increase of 4 per cent, based on a sample of state and federal agreements, operating at the end of the September quarter 2002. This rate of increase has remained relatively stable. The construction industry continued to lead the wage outcomes, with an average annual wage increase of 4.5 per cent, as compared to the mining industry with the lowest average annual wage increase of 3.4 per cent. Mining continued to pay the highest weekly wages to full-time employees, except non-managerial juniors.
and SNAs as the main factors, there was a greater reliance on performance linked factors.
Gender wage ratio
There have been fluctuations in the gender AWOTE ratio for full-time adults over the last decade, but it has remained between 83 and 85 per cent, based on a four quarter moving average (Preston 2001). In August 2002 the ratio for the four quarter moving average was 84.7 per cent (AUSSTATS, own calculations). Examination of the gender ratio, since mid-1996 reveals a steadily increase, but the separate computations of gender AWOTE ratios across industries for the period August 1996 (gender ratio 83.01) to August 2002 (84.72) suggests that compositional change has been significant in the overall rise in the gender ratio of 2.06 per cent, since seven of the 16 ANZSIC industries exhibited a decline in their gender ratios. Further analysis of this issue is beyond the scope of this review.
Notes:Manufacturingand constructionare equivalent to the ANZSIC industries. Commercial services: Wholesale; Retail; Accommodation, Cafes and Restaurants; Transport; Communications; Electricity, Gas and Water, Finance and Insurance, Property and Business; Cultural and Recreation; and Personal and Other. Non-commercial services: Education and Health, Government Administration and Defence and Community Services.
The estimates have been rounded since June 1999. Historical estimates have been revised, so the Figure may exhibit slight differences as compared to Figure 1 in Watts (2002).
The AAWIs are calculated as a weighted sum of the AAWIs per employee per ANZSIC industry with the weights given by the corresponding employment shares.
Source: DEWRSB (2002, various issues), author’s calculations.
Living Wage case
In November 2001 the ACTU filed its Living Wage claim under the Workplace Relations Act 1996. The peak body requested a $25 per week increase in all award rates of pay with an equivalent increase in allowances (AIRC 2002, para. 1). The Labor state governments (LSG) supported the ACTU’s claim, but gave the Commission some latitude to reduce the adjustment to awards in the event of a deterioration in the economic outlook (AIRC 2002, para. 14).
The Commonwealth argued that a $10 increase should be available on application to minimum classification rates at or below the C10 classification ($507.2) with the increase to be fully absorbed into over-awards, including those from enterprise agreements and informal over-awards (AIRC 2002, para. 13). The industry groups generally favoured an increase of $10 per week, which was to be confined to lower paid workers (AIRC 2002, paras 3–11).
Under the Workplace Relations Act 1996, s. 88B(2)b), in setting appropriate minimum rates of pay, the AIRC is required to have regard to ‘economic factors, including levels of productivity and inflation, and the desirability of attaining a high level of employment’, but also to take into account the need to provide fair minimum standards for employees in the context of general Australian living standards and the needs of the low paid (para. 119).
An analysis of the arguments presented to the Commission is insightful because it conveys the underlying beliefs of the major players about the functioning of the wage system. However, the participants tend to embellish and repeat their arguments from previous Safety Net Cases.
The major issues addressed in the submissions included:
1. the impact of the ACTU’s demand on the macroeconomy and different sectors;
2. the appropriateness of the wage system, rather than the tax transfer system, in addressing the needs of the low paid; and
3. the coverage of the SNA.
We address each of these issues briefly below.
1. Economic impact
improvements in the safety net of minimum wages without undermining the modest inflation rate (para. 126).
The Commission noted that that the ACTU and Commonwealth estimates of the grossdirect impact of the ACTU claim were similar, being in the range of 0.5–0.59 per cent. In assessing the proposed claim against current economic indicators, they argued that the estimated netimpact on aggregate wage growth was relevant. The Commission was skeptical of the estimates from the federal government and industry groups of the magnitude of the (indirect) flow on to employees covered by agreements under which they were not directly entitled to the safety net increases. The evidence provided to the Commission suggested that this impact would be limited.
The Commission acknowledged the sectoral impacts of minimum wage adjustment but argued that the consideration of national economic factors was of prime importance, rather than the circumstances of particular enterprises. The Economic Incapacity Principle was an appropriate mechanism for the examination of departures from the SNAs (para. 122).
There was no evidence that productivity growth was greater in firms paying bargained increases, which would have justified a degree of caution in the safety net adjustment, due to its potentially adverse impact on some sectors with a high degree of award reliance. Indeed evidence provided by the Australian Industry Group suggested that sectors characterised by high award reliance, such as whole-sale, retail and hospitality, had contributed to the improved productivity growth during the previous decade (AIRC 2002, para. 104). Also employment in the award reliant industries of accommodation, cafes and restaurants and the retail sector had risen faster than average, particularly since late 1996.
2. Wage inequality and the social security system
The Commonwealth (2002, Chapter 6) again ran the argument that the wages system had a limited means of meeting social equity goals and that the tax transfer system provided more targeted assistance. Further, unemployment was a major source of poverty, and any sizeable increase in minimum wages was asserted to undermine employment opportunities for many low skilled employees and new workforce entrants.
The Coalition Government has shown little interest in restructuring the tax transfer system, although the Workplace Relations Minister Abbott in a speech to the Young Liberals Annual Conference in January 2003 addressed at some length the issue of the work disincentives resulting from the interaction of the tax transfer system with the wages system (Abbott 2003).
manipu-lating the tax transfer system. However, these groups fail to recognise the dynamic inefficiency of imposing constant money wages for a period of time on a size-able share of the workforce (Mitchell & Watts 2002, p. 97). Also, in their focus on generating the right structure of incentives for the jobless, they ignore the absence of job opportunities for them.
By arguing that SNAs were a limited means of achieving social equity, the Commonwealth appears to be trying to marginalise the Living Wage case, thereby gaining greater discretion to determine the degree of economic inequality within the Australian economy, through manipulation of the tax transfer system.
The Commonwealth’s statement about the significance of unemployment in determining the extent of poverty was somewhat disingenuous, given that its tight monetary and fiscal policies in the form of high interest rates and budget surpluses have been a major cause of persistent unemployment in Australia (Mitchell 2001). Further, rather than viewing persistent unemployment as a collective problem, the Coalition Government (and the previous Labor Government) has managed to construe unemployment as an individual short-coming thereby justifying the principle of mutual obligation, with its punitive treatment of the unemployed.
3. Coverage of the SNA
The Commonwealth (2002, 7.2) argued that restricting safety net increases to Classification C10 and below, maintained the incentive of workers in higher classifications to engage in workplace bargaining, whereas workers on a classifi-cation below C10 had a limited capacity to bargain. Thus the C10 cap was viewed as critical to the spread of agreement making, which was asserted (without any supporting evidence) to be a major factor underpinning the strong productivity improvements which had contributed to the resilience of the Australian economy in a difficult international economic environment (Commonwealth 2002, 7.14). The evidence from the AiG outlined above, which noted the contribution of the award reliant sectors to economy productivity growth, would appear to challenge this claim.
The Commonwealth (2002, 7.15) noted that the principal object of the
Workplace Relations Act 1996is to provide a framework for cooperative workplace relations. By not imposing the C10 cap, the Commission would be failing to give due weight to the legislative requirement to encourage agreement making and promote enterprise level workplace relations. In its discussion of its decision the AIRC noted that the Commonwealth had provided material indicating that the number of employees covered by agreements had shown steady growth (para. 162), so that it was not evident that the comprehensive coverage of SNAs was inhibiting agreement making.
Also the AIRC referred to the terms of s. 88A(b) of the Act which were also addressed in last year’s decision. This requires that a Safety Net of fair minimum wages be maintained for all award reliant employees, and not just those classified at or below the C10 level (para. 159, see also Watts, 2002, pp. 236–38). The Commission’s failure to adjust all awards would mean that relative awards would no longer reflect the skill, responsibilities and conditions of employment associ-ated with different jobs. Some awards would become increasingly irrelevant to wage determination and no longer a benchmark for the no disadvantage test. If the problems of the low paid were to be resolved via work related benefits indexed to average wage growth to allow for real growth, then employees on higher awards, who were unable to negotiate wage increases, would still be neglected, due to the likelihood of being ineligible for the work related benefits.
In its sixth Safety Net Adjustment since the Workplace Relations Act 1996, the Commission (2002, paras 160–4) awarded an $18.00 per week increase in all award rates. The federal minimum wage was increased to $431.40 per week. The usual conditions applied which including the full absorption of the award in over-awards where possible, and the phasing in of the increase no less than 12 months after the increases provided for in the May 2001 decision. The AIRC concluded (2002, para. 161) that the gross impact on aggregate wages growth would be similar to that arising from the 2001 SNA decision. The flat increase was a smaller percentage of average earnings and a smaller share of employees was award reliant. The effect on inflation would be minimal due to the presence of offsetting productivity improvements.
The Commission noted that no submissions sought either uniform percentage SN increases or more generally increases which were higher at higher levels of awards (para 156). The ACTU had advised the Commission that it should ignore the fact that implementation of its claim would further compress relativities, but that skill-based classification structures should not be allowed to wither on the vine. The Commission reiterated that the compression of relativities via recent SNAs would not be the basis for changes in relativities in future SNAs, when the issue was addressed.
In mid-November 2002, the ACTU foreshadowed an application to the Commission to increase all award workers’ pay by $24.60 per week at the next Safety Net Review which would bring the federal minimum wage up to $456 per week and would benefit 1.7 million workers on federal awards (Ruse 2002a).
Executive salaries
In the year to June 2001, the income of high-ranking executives rose 13.4 per cent, compared with a mere 3.1 per cent rise in the wages for all employees. Top executives now receive about 30 times the average annual wage, compared to a ratio of less than six in the mid-1970s (Denholm 2002).
Consulting firm Stern Stewart developed two measures of real improvements in shareholder value: market value added, (MVA)—the difference between the increase in market capitalisation and shareholders’ funds; and economic value added,
(EVA)—the annual profit minus the cost of all capital, including equity capital, including off-balance sheet items. The average CEO pay rise of these companies was 28 per cent, while, on average, MVA increased by 17 per cent and average EVA fell by 111 per cent. Kohler (2002) claims that this inconsistency arises because performance hurdles for executives are usually linked to reported earnings, in which the cost of debt is included, but there is no deduction for the cost of equity capital.
There is, however, a significant correlation between CEO remuneration and directors’ fees (Cornell 2002). In their US research, Bebchuk et al.(2002), quoted in Cornell (2002), support this argument, by claiming that the classical principal agent mechanism which was aimed at maximising shareholder value was a chimera, with executives having the capacity to influence their own compensation, by extracting rents. Consequently executives are paid more than is optimal for share-holders and, to camouflage the extraction of rents, executive compensation is often structured sub-optimally.
Kohler (2002) questions a remuneration system that is apparently required to motivate executives. He argues that those CEOs in Australia would work for less and would all work just as hard in the absence of the elaborate share and cash bonus schemes, as long as they and members of their Boards were satisfied that no comparable CEO was getting more than them. Thus their rates of remuner-ation have little genuine relremuner-ationship to improvements in shareholder value, and largely reflect boardroom psychology. Cornell (2002) quotes a remuneration specialist who argues that the global pay structure is not the prime determinant of most executive salaries. The regional market is the benchmark for most jobs.
Kohler (2002) notes that the average CEO in the US earns 500 times that of the average employee, but the crucial difference is that in the USA, all the details of senior executive contracts must be revealed, including the nature of any non-cash payments and the details of performance targets and how cash and non-cash bonuses relate to them. In Australia the public is informed about executive remuneration obtained in the previous year, but not its relationship to performance targets. The performance targets which will underpin executive remuneration in the future are also not revealed.
but rather to inflate executive compensation. Shareholders now have little influence over corporate behaviour and are vulnerable to making significant losses. The claim by Bown (2002) that the intense scrutiny of corporate govern-ance practices is promoting self-regulation by Australian companies, through the review of their executive compensation programs, may be somewhat optimistic. The federal government has been reluctant to tighten up corporate governance practices.
INDUSTRIAL RELATIONS AND LABOUR MARKET REFORM
During 2002, a number of legislative reforms were initiated by the federal govern-ment, which impacted on the wages and conditions of workers. The government was keen to reinforce the decentralisation of wage setting, by diluting unions’ power, through outlawing pattern bargaining and union bargaining fees, and applying pressure for the introduction of AWAs. On the other hand, in 2001 support was provided through the general employee entitlements and redundancy scheme (GEERS) to unemployed workers whose entitlements were under threat following corporate collapses. Paid maternity leave, which was proposed by the HREO Commissioner has not been ruled out at the time of writing. The govern-ment remained resolute in attempting to scrap unfair dismissal laws for small business, but was again frustrated in the Senate. This issue is outside the scope of this article. The AIRC addressed the underpayment of Federal awards in Victoria and also ruled on a test case brought by the ACTU on unreasonable work hours.
Pattern bargaining
In June 2002, the Commonwealth Government passed the Workplace Relations Amendment (Genuine Bargaining) Bill 2002 through the House of Representatives. It was designed to outlaw pattern bargaining. This followed an earlier attempt in 2000, which was stymied by the ALP and the Democrats in the Senate. Under this bill, the Commission would be required to terminate a bargaining period and the capacity to take protected industrial action if the parties were aiming to reach common agreements across all or part of an industry (ACIRRT 2002c, p. 7).
ACIRRT (2002c) quotes the DEWR definition of pattern bargaining:
The process of pattern bargaining occurs where a party seeks common outcomes on an all or none basis from agreements across a number of enterprises or work-places, usually within the same industry or for multiple enterprises at a particular project or site.
By outlawing this practice, the Commonwealth was attempting to quarantine individual enterprise wage agreements, thereby minimising the flow on of wage increases through the network of industrial awards by the tribunals which had characterised wage explosions, including the one at the beginning of the 1980s.
bargaining in the construction industry, and also the vehicle industry. ACIRRT (2002c) is critical of the naïve manner by which pattern bargaining is identified in the study, in the form of agreements covering different workplaces which provide for identical outcomes in wages and/or employment conditions and/or common expiry dates.
Following studies of these sectors, ACIRRT argues that the presence of identical outcomes in wages and/or employment conditions and/or common expiry dates in agreements covering different workplaces does not confirm the existence of pattern bargaining. What is critical is not the presence of a common set of demands, but the (in)ability of the parties to modify those demands during enterprise negotiations. ACIRRT notes that the going rate constitutes a benchmark, both with respect to workers’ fairness and firms’ competitiveness. The intent of the legislation ignores employer-induced patterns that can result from supply chains. ACIRRT claims that all bargaining systems contain elements of pattern setting and workplace bargaining and so reject the bipolar perspective of the DEWR, who contrast enterprise bargains and pattern bargains with the latter driven by unions. They point to the European experience of coordinated flexibility, whereby ‘decentralised bargaining is accompanied by various types of ‘social pacts’ (establishing bargaining rules and procedures without constraining most industry, firm’ and workplace outcomes) and informal wage coordination’ (ACIRRT 2002c, p. 10).
Finally, the concept of competitiveness needs elaboration in this context. In an economy dogged by unemployment, the persistence of wage inequality is facili-tated in the absence of employers competing for workers (Watts 2001). Sustained intra-industry wage inequality under a regime of enterprise bargaining implies the presence of implicit wage subsidies to the low paying enterprises, thereby frustrating the efficient allocation of resources. Thus uniform wage changes for relatively homogeneous groups of workers promote fairness, a level playing field and also the efficient allocation of resources. There have been no recent studies of intra-industry wage outcomes to test whether enterprise bargaining, partic-ularly since the Workplace Relations Act has led to more or less disparate wage outcomes.4
Union bargaining fees
In February 2001, the AIRC approved the levying of a $500 service fee to non-union members by the Electrical Trades Union in exchange for negotiating wage increases. Later in 2001, the Federal Court ruled that AWU strike action at Electrolux in Adelaide in support of the claim for a bargaining fee was illegal. In mid-2002, however, the full bench of the Federal Court overturned the earlier decision, ruling that unions and their members could pursue enterprise agreements that included clauses outside the traditional employment relation-ship, such as a bargaining fee. The proposed fee was $500, in comparison to the annual AWU membership fee of $350 (Gough 2002). The government may appeal to the High Court against the decision.
laws. Also unions have a legal obligation to negotiate enterprise agreements on behalf of all employees in the workplace. This prevents discrimination. Corbett (2001) notes that in principle a non-union member could negotiate either an indi-vidual AWA or a common law contract, but the employer may be disinclined to conduct negotiations with members of its workforce under different processes. Union members on average earn $99 a week, or 15 per cent, more than non-members (Combet 2002b). He also points to the broader coverage of entitlements enjoyed by union members with 89 per cent receiving annual leave, versus 72 per cent for non-union members, sick leave (90 per cent versus 72 per cent), and long service leave (85 per cent versus 62 per cent). Union coverage is very uneven across industries and occupations, with their representation being greatest in those industries where these entitlements are customary. Most unions saw the fee as consistent with the user pays principle and a tool to stimulate flagging membership, particularly with the fee often set above annual union dues.
Pressure to introduce AWAs
One of the criteria (1c) for an Australian University to satisfy to secure funding in the second round of the Workplace Reform Programme in 2001 was the demonstration that it has agreements which provide for Australian Workplace Agreements (AWAs) to be made with staff.
In December 2002, public sector unions resolved to resist plans by the federal government which were allegedly designed to force new public servants to sign AWAs. It is claimed that long-term employees could be bypassed for promotion if they refuse to sign them. Only about 7000 public servants in a total workforce of about 123 000 have signed AWAs. The rest are covered by 100 certified agree-ments, mostly negotiated by unions (Phillips 2002).
Workers’ entitlements
Early in 2002, Ansett collapsed for a second time, leading to further job losses and a threat to the entitlements of those who had lost their jobs. This led again to questions of corporate accountability with respect to the obligation to disclose information to employees about the state of the business and the future of their jobs (Long 2002), in addition to the design of mechanisms to guarantee workers’ entitlements, after corporate collapses. One particular issue is whether workers should have priority over other creditors. This would require the Coalition Government to change Corporations law. This was under consider-ation at the end of 2002.
total employment, and about 60 per cent of them (1.2 million) have worked for long periods with the same employer. The ACTU argued that the present eight-week cap on redundancy pay was inadequate given that the average period of unemployment after redundancy was 22 weeks. For over 45-year-olds, the average duration of unemployment was 96 weeks. The ACTU also sought to require employers to consult their staff before redundancies (Owen-Brown 2002). In 1998, the Howard Government had stripped consultation provisions from awards (Combet 2002a).
Long (2002) notes that most European countries require companies over a certain size to establish works councils, comprised of employee representatives, to give employees a voice in decisions about the nature of work and the future of the business. As noted above, the managerial prerogative to act without consultation and in secrecy persists in Australia.
Buchanan and Briggs of Sydney University found that ‘joint consultative committees’ in best practice companies failed to reduce downsizing and work intensification or give employees a voice. Long (2002) concludes that works councils would be effective if strong sanctions underpinned their operation, such as executives being stripped of rights to hold directorships or manage businesses, in the event of failing to consult and inform employees.
The federal government’s current general employee entitlements and redun-dancy scheme (GEERS) for workers is redunredun-dancy payments of up to eight weeks’ pay, plus full payment of unpaid wages, annual leave, long service leave and full payment of unpaid pay in lieu of notice. This scheme is supported by the AiG (Skulley 2002). On the other hand, the ACTU proposed that a nationally legislated entitlement guarantee scheme, funded at low cost through an employer levy, would guarantee the security of entitlements (Combet 2002a). If the test case succeeds in lifting the minimum redundancy rate, the ACTU would request the Commonwealth to raise the cap on payments under GEERS commensurately.
Two corporate collapses in Melbourne before Christmas led the Australian Manufacturing Workers Union to launch a national campaign to start in 2003 to secure workers’ entitlements through an industry trust fund, bank guarantees and a portable long service leave fund (Robinson & Gray 2002).
Maternity leave
The Federal Workplace Relations Act 1996 provides for 52 weeks unpaid maternity leave for all workers. In May 2001, unions secured unpaid maternity and parental rights leave for more than two million casual workers (ACIRRT 2002a, p. 12). Access to unpaid parental leave for an increasing proportion of the workforce has been important in encouraging women’s retention in the workforce after childbirth, but has done little to reduce the financial disadvantage faced by women who take time off work when they have a baby (ACIRRT, 2002a, p. 7).
average around the International Labour Organisation’s convention of 14 weeks (Watts 2002).
In April 2002, the HREO commissioner presented options for extending paid maternity leave in a discussion paper (Goward 2002a). Also the Australian Democrats tabled amendments to the Workplace Relations Actto incorporate paid maternity leave.
In a subsequent submission to HREOC, the Womens Electoral Lobby (WEL) outlined a number of compelling benefits to mothers resulting from the intro-duction of paid maternity leave, including maternal health, economic security, childbirth as a valid leave entitlement, gender equity with respect to conditions of employment, such as leave entitlements, and the long term benefits of employ-ment continuity, via ongoing training and career progression. The WEL also recognised that continuity of employment for women following paid leave would confer major benefits for employers, including reduced recruitment and train-ing costs; improved staff morale and productivity; and improved organisational efficiency through the benefits of long service, for example institutional memory, industry knowledge, networks and contacts. The WEL noted that there is precedence for the federal government to underwrite employee entitlements, including the GEERS scheme described above, as well as some government-funded industry-specific subsidies (WEL 2002).
In December, Goward (2002b) recommended that, to compensate for lost earnings, working women should receive 14 weeks paid maternity leave at the minimum wage of $431 a week, or their average previous weekly earnings from all jobs, whichever is the lesser amount (Goward 2002b). The payment would not be means tested. Goward argued that the federal government should fund the scheme for all women who had been in paid employment for 40 of the 52 weeks before the birth of their child. Employers should be encouraged to continue existing provisions for paid maternity leave and likewise women, including public servants, should not be excluded from any government funded national scheme on the basis of already receiving paid maternity leave in the workplace.
Recipients of paid maternity leave would not be eligible for welfare payments which would continue to provide financial support for those mothers who had not maintained their rate of participation in employment. The offsets associated with the current welfare schemes would reduce the net cost of the scheme to $213 million in 2003 and support 85 000 mothers (Buffini 2002). A review of the operation of the scheme was recommended for three years after its implementation.
It was estimated that the scheme would replace two-thirds of the income lost by 73 per cent of all women in paid work for the first 14 weeks of the baby’s life. On the other hand, women who earned average wages currently received only $78 a week in welfare benefits at the time of birth, and sacrificed their incomes from paid work (Buffini 2002).
funding, after claiming that unions would bring top-up claims unless there were changes to industrial laws. The top up provision through the bargaining process was canvassed in Goward’s report (Recommendation 10). The Coalition Government remained non-committal on whether paid maternity leave would be introduced in 2003.
Federal funding or the imposition of an employer levy would be required to implement any universal scheme of paid maternity leave, otherwise employers would be reluctant to hire women of child bearing age. The argument that maternity leave arrangements should be negotiated at the workplace level ignores the substantial disparity in the incidence of such arrangements. ACIRRT (2002a, p. 12) reports that paid maternity leave provisions are present in only 6.7 per cent of collective agreements and less than 1 per cent (0.7 per cent) of AWAs mainly in the private sector. ABS unpublished data showed that the incidence also varies markedly across industries with Government Administration and Defence (68.1 per cent) and Communication Services (59.1 per cent) having the highest incidence, whereas the lowest coverage of was found in Agriculture (4.5 per cent) and Accommodation, Cafes and Restaurants (13.4 per cent). Access to paid maternity leave was higher the greater an employee’s length of service with an employer. In total, 38 per cent of female employees confirmed that they were entitled to paid maternity leave, 51 per cent of whom were full-time employees and 21 per cent were part-time. Women in casual employment had little access to paid maternity leave (0.4 per cent of self-identified casuals), compared to 53.6 per cent of other female employees.5
Clearly, the proposal would support women who are trying to reconcile family and work responsibilities and encourage them to return to the workforce, given the reduction in their post-tax income 14 weeks after childbirth. In addition, the unequal access to maternity benefits that exists between women in different enterprises and industries would be redressed to some degree. The difficulty of introducing arrangements which are designed to facilitate the potentially conflicting responsibilities of work and family is that they entrench the existing gender division of labour within the household between paid and unpaid work (including caring). In the process, the likely causes of the low incidence and duration of paternity leave are not redressed, namely the loss of income, reflect-ing the prevalence of gender wage inequality, along with the potential damage to career development for men resulting from prolonged absence from the work-place. The latter of course is also an important issue for working mothers. A recent study by Reed found that in a survey of 1000 women, 29 per cent earned more than their partners (Florez 2002), so that the breadwinner stereotype is now diminishing. Reed noted that men who are married or cohabiting tend to receive higher incomes than single men, but noted there is ‘no premium for marriage’ for women
Australia’s below-replacement birth rate is likely to be small, but women may choose to have a first child earlier, increasing the possibility of having a second child.
The union movement has also launched a test case that, if successful, would give women the right to two years’ unpaid maternity leave, with a guaranteed return to their old job after that period (Ruse 2002b). Such a scheme would make staff planning rather difficult for employers in female-dominated industries.
Underpayment of awards
Robinson (2002a) reported that in Victoria, an AIRC ruling about the payment of below award wages in October could lead to a class action by unions against members of the Victorian Chamber of Commerce and Industry (VECCI). The action could involve 5000 companies with 250 000 workers being entitled up to $20 000 due to being paid at lower rates, and not being given public holiday pay, overtime, long service leave, holiday loadings and penalties, as compared to other workers on federal awards.
Employers not bound by a federal award in Victoria can hire their staff under the conditions of schedule 1A of the Workplace Relations Act, which makes no provision for overtime, weekend penalty rates, carers’ leave or redundancy pay. In an unfair dismissal case, a company had claimed unsuccessfully that because it was a VECCI subscriber, and not a member, it was not bound by the terms and conditions of federal awards. Other employer organisations could also be subject to the action.
Earlier in the year, a number of claims for underpayment of awards and entitle-ments had been settled in New South Wales under State legislation (AAP 2002). By late April, $615 000 had been paid to workers. Employers can face penalties of up to $10 000 for underpaying workers.
Hours of work
Ruse and Stevens (2002) quote a survey of 1000 people by national employment network Jobfutures, in which 44 per cent of respondents claimed to undertake unpaid overtime every week. The average unpaid overtime was 8.4 hours which, based on average weekly earnings of $867.60 a week, represents nearly $200 of unpaid labour per week. Only six per cent of workers wanted to work longer. However, one-third of workers surveyed received some non-monetary benefits for working overtime, in particular time off in lieu or more flexible working hours. The main non-material reasons for working extra were ‘personal satisfaction’ and ‘respect or recognition from management’, the survey found. The pressure to work overtime is occurring at a time of increased job insecurity.
CONCLUSION
In my 2001 review, I suggested, in line with Long (2001), that federal govern-ment legislation, including the Workplace Relations Act 1996, along with structural changes in the labour market appeared to have fundamentally shifted the balance of power with unions finding it increasingly difficult to provide real protections for their members. In 2002, neither trends in money wage growth nor the legislative and institutional developments have provided any strong evidence to dispute this contention. Unfortunately, it has not been possible to draw on any contemporary data to explore the evolution of wage inequality under the different types of agreement.
The government has maintained its rigid belief in the effectiveness of the system of enterprise bargaining and has imposed pressure to increase the inci-dence of AWAs. Where a serious issue of economic disadvantage appeared, namely the preservation of workers’ entitlements following corporate collapses, the federal government papered over the cracks, rather than addressing the funda-mental issue of inadequate corporate governance. Also, it has been responsive to politically sensitive workplace issues relating to work and family, which was noted in Watts (2001).
ENDNOTES
1. The measure of underlying inflation is designed to remove the effects of extreme price movements.
2. The preliminary 2002 data do not differentiate between registered and unregistered agreements.
3. The wage cost index measures hourly wages net of bonuses and, in contrast to measures of average weekly ordinary time earnings (AWOTE), is independent of compositional changes, because it is based on a fixed basket of jobs, which, however, includes part-time jobs. 4. Watts (2002) cites ACIRRT data for 2000 that revealed a significant disparity between high
and low wage bargains across industries, but no recent comparative data are available. 5. Paid paternity leave provisions are even more uncommon, with only 3.3 per cent of currently
operating collective agreements and only 0.4 per cent of currently operating AWAs with such a provision. 7.9 per cent of union agreements have these provisions compared to 2.6 per cent of non-union agreements ACIRRT (2002a).
REFERENCES
Abbott T (2003) Reform with a Social Conscience.Young Liberals Annual Conference, Adelaide, January 11.
Australian Associated Press (2002) NSW – Employers Forced to Repay over Half a Million in Wages.
24 April.
Australian Bureau of Statistics (2000) Survey of Employee Earnings and Hours. Cat no. 6306.0, May, Canberra: ABS.
Australian Bureau of Statistics (2001) Employee Earnings, Benefits and Trade Union Membership.
Cat no. 6310.0, August, Canberra: ABS.
Australian Bureau of Statistics (2002a) National Income, Expenditure and Product. Cat no. 5206.0,
September, Canberra: ABS.
Australian Bureau of Statistics (2002b) Survey of Employee Earnings and Hours. Cat no. 6305.0, May, Canberra: ABS.
Australian Bureau of Statistics (2002c) Wage Cost Index, Australia. Cat no. 6345.0, September, Canberra: ABS.
Australian Bureau of Statistics (2002) The Labour Force. Cat no. 6203.0, various issues, Canberra: ABS.
Australian Centre for Industrial Relations Research and Training (2002b) Agreements Database and Monitor (ADAM) Report. June, Sydney: Sydney: ACIRRT.
Australian Centre for Industrial Relations Research and Training (2002c) Agreements Database and Monitor (ADAM) Report. December, Sydney: Sydney: ACIRRT.
Australian Industrial Relations Commission (2002) Safety Net Review – Wages, May 2002, http://www.airc.gov.au/my_html/S5000.htm
Bebchuk LA, Fried JM, Walker DI (2002) Managerial power and rent extraction in the design of executive compensation. University of Chicago Law Review69, 751–846.
Bown J (2002) Options an outdated way of managing management. Australian Financial Review, 28 October.
Buchanan J, Briggs C (2002) Works councils and inequality at work in contemporary Australia. In: Gollan J, Markey R, Ross I (eds), Works Councils in Australia. Future Prospects and Possibilities, Sydney: Federation Press, pp. 48-73.
Buffini F (2002) Goward says maternity plan will be cost-effective. Australian Financial Review,
3 December 12.
Burgess J (1995) Aggregate wage indicators, enterprise bargaining and recent wage increases.
Economic and Labour Relations Review6(2), 216–33.
Combet G (2002a) Casuals the worst casualties of unfair redundancy rules. Adelaide Advertiser, 18 September.
Combet G (2002b) Paying for the privilege. Herald Sun, 1 July. Corbett J (2001) Fee for non-unionists. Newcastle Herald, May 29.
Cornell A (2002) Boss–up, up & away. Australian Financial Review. 8 November. Daily Telegraph (2002) More pay doesn’t help results. 9 October.
Denholm M (2002) Salary gap grows between basement and the boardroom. Adelaide Advertiser, 8 October.
Department of Employment and Workplace Relations (2002) Trends in Enterprise Bargaining, September. Canberra: DEWR.
Easterbrook G (2002) Greed is God. The Australian, 6 July.
Florez M (2002) Third of women earn more than partners, survey finds. The Mercury
(ABIX Abstracts), 5 December.
Gough K (2002) Unions win right to strike to make non-members pay up.The Australian, 22 June. Goward P (2002a) Valuing Parenthood: Options for paid maternity leave, Interim Paper. Canberra:
Human Rights and Equal Opportunity Commission.
Goward P (2002b) A Time to Value: Proposal for a National Scheme of Paid Maternity Leave. Canberra: Human Rights and Equal Opportunity Commission.
Kohler A (2002) Why the great salary debate has been missing the point. Australian Financial Review, 5 October.
Long S (2001) The wages of fear and the new workplace. Australian Financial Review, 21 March. Long, S (2002) Ansett shows staff need to have a say. Australian Financial Review, 6 March. Mitchell WF (2001) The unemployed cannot find jobs that are not there. In: Mitchell WF, Carlson
E (eds) Unemployment: The Tip of the Iceberg,Sydney: UNSW Press, 85–116.
Mitchell WF, Watts MJ (2002) Restoring full employment–the job guarantee. In: Carlson E, Mitchell W (eds) The Urgency of Full Employment, Sydney: UNSW Press.
Owen-Brown M (2002) Casuals’ redundancy bid. Adelaide Advertiser, 30 August. Phillips M (2002) Unions to resist Abbott assault. Hobart Mercury, 18 December.
Preston A (2001) The changing Australian labour market: Developments during the last decade.
Australian Bulletin of Labour, 27(3), 153–76.
RBA (2002a) Statement of Monetary Policy.Reserve Bank of Australia Bulletin, May. RBA (2002b) Statement of Monetary Policy.Reserve Bank of Australia Bulletin, November. Robinson P (2002a) Pay ruling a windfall for workers. The Age, 3 October, p. 31. Robinson P (2002b) Push for 16 weeks’ redundancy pay. The Age,21 December.
Saunders P (2001) Household Income and its Distribution, Australian Economic Indicators. Cat. No. 1350.0, June, Canberra: ABS.
Skulley M (2002) ACTU Claim Attacked. Australian Financial ReviewSeptember 5.
The Commonwealth of Australia (2002) Safety Net Review–Wages, 2001–2002. Commonwealth submission, March.
Watts MJ (2001) Wage polarisation and unemployment in Australia in Mitchell WF, Carlson E, (eds)Unemployment: The Tip of the Iceberg,pp. 171–92. Sydney: CAER, UNSW.