NATIONAL OBSTETRICS REGISTRY
PRELIMINARY REPORT OF NATIONAL OBSTETRICS REGISTRY
JULY-DECEMBER 2009
Editors:
Ravichandran Jeganathan Shamala Devi Karalasingam
With Contributions from
Aw Lin Da, Zarina Man, G. Bavanandan Naidu, Maimunah Bt Fadzi
Nuryuziliana D, Chong Guan Kim, Wan J.N, Soon Ruey, Anita Malek, S.Thillainathan Rohana Mat Noor, Ruhaizan binti Haron
December 2011
© National Obstetrics Registry Publisher:
Jointly published by the National Obstetrics Registry and the Clinical Research Centre (CRC), Ministry of Health Malaysia.
National Obstetrics Registry 1st Floor MMA House, 124, Jalan Pahang, 53000 Kuala Lumpur, Malaysia.
Tel : (603) 4044 3060 / (603) 4044 3070 Fax : (603) 4044 3080
Email : [email protected]
Website : https://www.macr.org.my/enor/
Suggested citation: Ravichandran Jeganathan (Eds). Preliminary Report of National Obstetrics Registry, July-December 2009. Kuala Lumpur, Malaysia: National Obstetrics Registry 2009
Disclaimer:
Data reported in this report were collected for 6 months period (from July to December 2009). This report is copyrighted. Reproduction and dissemination of this report in part or in whole for research, educational or other non-commercial purposes are authorized without any prior written permission from the copyright holders provided the source is fully acknowledged.
Electronic version
The electronic version of this report may be downloaded at https://www.macr.org.my/enor/ or http://www.crc.gov.my/publication/report.
Funding
The National Obstetrics Registry is funded with grants from the Ministry of Health Malaysia (MOH)
i
PRELIMINARY REPORT OF NATIONAL OBSTETRICS REGISTRY JULY-DECEMBER 2009
Acknowledgements
The National Obstetrics Registry (NOR) would like to give its grateful appreciation to everyone who has helped make this report possible.
We would especially like to thank the following:
•
Director General of Health Malaysia for the support and approval to publish this report.•
Ministry of Health Malaysia for the research grants to fund the registry.•
Our sauce data providers for their timely data collection and hard work.•
Steering committee members and governance board for their tireless effort and expertise dedicated to this registry•
Clinical Research Centre National for its leadership, supervision and technical support.•
The registry coordinating team and technical support team for their commitment andii
PRELIMINARY REPORT OF NATIONAL OBSTETRICS REGISTRY JULY-DECEMBER 2009About National Obstetric Registry
The National Obstetrics Registry (NOR) is a project initiated by the O&G fraternity with the support of the family health division of MOH. The CRC was instrumental in the development, implementation and administration of this registry. The NOR is the youngest of all the registries under the umbrella of Association of Clinical Registries Malaysia (ACRM).
NOR evolved, as a result of the dearth of statistics and information available, on the obstetric performance of hospitals within the Ministry of Health, Malaysia. Presently information is available upon request to each hospital, which is collected manually. Collective data and data mining were almost impossible. With the advent of NOR, it is now possible to get real time updates as to the performance and work output of each of the hospitals. NOR will also facilitate audits and research which is necessary to improve healthcare delivery systems which will translate into quality patient care. It must also be reflective of staffing norms, equipment needs and allow focused attention on areas of concern.
NOR is a clinical “disease” database which compiles the obstetric data, to enable healthcare planning, implementation and evaluation in a defined population. It is web-based which means it is readily accessible from any computer with internet access. NOR will assist us in evaluating some key areas in obstetric practice, including distribution of birthing centres in Malaysia with regards to population, outcome of breech deliveries, burden of disease in pregnancy, indications and rising rates of Caesarean Section, and outcome of LBW babies. Analysis of these parameters will enhance our efforts to achieve the Millennium Development Goal (MDG)
NOR was conceived years ago in the corridors of O&G congress in 2007, the initial meeting involving senior O&G consultants and CRC was held in Sept. 2007. The stakeholders were JKPPOG, Family Health Division, MOH and the CRC.
The soft launch was in May 2009 and went fully online on 1st July 2009. It involves 14 state hospitals across Peninsular Malaysia and East Malaysia, which represents the bulk of obstetric practice. Data entry is done by the nursing staff and doctors, using a specific username and password with confidential authentication codes, with the use of SMS. Each hospital has a dedicated site coordinator represented by one specialist and sister, who oversee the running of NOR on a daily basis. There is a very close liaison between CRC and the participating hospitals. To date, all 14 hospitals have been actively participating in data collection, which has resulted in the entry of 73, 095 up till 31st Dec 2009. All this data has been put to good use, hence this report. NOR will eventually expand to all hospitals with obstetric service within the Ministry of Health on a phased plan. It is our silent prayer that in time NOR will permeate to all delivery centres in Malaysia, both in the public and private sectors.
With the advent of NOR, we have faced a few obstacles which is expected when a new system is introduced. The initial hurdles NOR faced included resistance to change in terms of time, effort, manpower and funding. In time, we managed to overcome these hurdles. Other areas of concern include data entry which may take longer than the stipulated time, internet speed, missing data which requires frequent updates and hanging computer systems.
The funding of NOR is by CR for the next 2 years. Following this we hope that the funding will be contributed by the Ministry of Health as part of the 10th Malaysian plan
iii
PRELIMINARY REPORT OF NATIONAL OBSTETRICS REGISTRY JULY-DECEMBER 2009
About National Obstetric Registry (
cont
)
Objectives of this registry are:
1. To develop a complete picture of patient care through a comprehensive database wherein it would help to track patients’ management and outcome.
2. To enable in depth study of factors influencing patients outcome and its effective forms of treatment.
3. To evaluate management of patients’ obstetric outcome and subsequently to develop guidelines for improved care.
4. To facilitate research on .improving maternal and foetal morbidity and mortality
iv
PRELIMINARY REPORT OF NATIONAL OBSTETRICS REGISTRY JULY-DECEMBER 2009 NOR Web Application•
Go to www.acrm.gov.my and click on NOR•
Login to NOR•
Select Patient and fill up NOR notification and relevant details.•
Print out reports.Organization of NOR
The organizational structure for the registry is depicted below.
Sponsor
Governance Board
Expert Panel Steering Committee/
Technical Support Team
v
PRELIMINARY REPORT OF NATIONAL OBSTETRICS REGISTRY JULY-DECEMBER 2009
NOR Steering Committee
Advisors Dr Mukudan Krishnan
Department of Obstetrics & Gynaecology, Ipoh Hospital
Dato’ Dr Ravindran Jegasothy
Department of Obstetrics & Gynaecology, Kuala Lumpur Hospital
Chairman Dr J Ravichandran Jegnathan
Department of Obstetrics & Gynaecology, Sultanah Aminah Hospital, Johor Baharu Project Manager Dr Shanthi Varatharajan
Clinical Research Centre (June 2009-June 2010) Dr Shamala Devi Karalasingam
Hospital Raja Perempuan Zainab II Kota Bh Dr Wan Abu Bakar Yusoff
vii
PRELIMINARY REPORT OF NATIONAL OBSTETRICS REGISTRY JULY-DECEMBER 2009
NOR Source Data Providers 2009
The current source data providers for NORM are:
No. Hospital Site investigators Second person-in-charge 1 Hospital Kuala Lumpur Dr S. Thallainathan Sister Rohana Bt Mat Noor 2 Hospital Raja Perempuan Zainab II
Kota Bharu
Dr Sukri Ahmad KJ Sariah Bt Tais
3 Hospital Sultanah Nur Zahirah Kuala Terengganu
Dr Wan Abu Bakar Yusoff KJ Salmah Sulaiman
4 Hospital Tengku Ampuan Rahimah Klang
Dr Malar Kawdasamy Sister Paremeswari Sinnathamby 5 Hospital Sultanah Bahiyah
Alor Setar
Dr Aw Lin Da Sister Zarina Man
6 Hospital Sultanah Aminah Johor Bahru
Dr Nisha Angela Dominic Sister Rohayah Mahmood S/N Ruhaizan Haron 7 Hospital Melaka Dr Maimunah Bt Fadzil Sister Chong Guan Khim
8 Hospital Tuanku Fauziah Kangar
Dr Maizuriati Bt. Abd. Rahman
Sister Maslia bt Dali
9 Hospital Raja Permaisuri Bainun Ipoh
Dr Liza Ling Ping Sister Padilah Aziz
10 Hospital Tengku Ampuan Afzan Kuantan
Dr Sudesan Raman Sister Noor Lida Bt Jusoh
11 Hospital Tuanku Ja’afar Seremban
Dr Nazura Bt. Karim Sister Salbiah Janggi
12 Hospital Pulau Pinang Dr Azmy Bin Mohamad Yusoff
Sister Salbiah Din
13 Hospital Queen Elizabeth Kota Kinabalu
Dr Carol Lim KJ Anita Malek
viii
PRELIMINARY REPORT OF NATIONAL OBSTETRICS REGISTRY JULY-DECEMBER 2009NOR Technical Support Team
Head of ICT Unit Ms Celine Tsai PaoChien
Clinical Data Manager Ms Teo Jau Shya Database Adminstrator Ms Lim Jie Ying
Mr Sebastian Thoo Web Application Developer Mr Eng Kok King
Network Adminstrator Mr Ng Foong Heng
Biostatistion Ms Lena Yeap Lay Ling
Desktop Publusher Ms Azizah Alimat
Patient Registry Unit Dr Jaya Purany Stanley Ponniah Mr Naren Kumar A/L Surendra Ms Safura Ilyani Kamariddin Clinical Epidemiology Unit Dr Jamaiyah Haniff
ix
PRELIMINARY REPORT OF NATIONAL OBSTETRICS REGISTRY JULY-DECEMBER 2009
Letter From The Principal Investigator
The National Obstetrics Registry has been collecting data since mid July 2009 and it is with great pleasure and pride that we see this report materialized.
It is imperative and timely that this study is done in Malaysia so that further research on obstetrics can emerge from this national registry. The information captured in the registry is important in assisting the MOH, Non Governmental Organization (NGO), healthcare providers and industry in terms of planning and evaluating obstetrics management in the hospitals.
I would like to thank all those who have collected, verified and analyzed the data. The co-operation and energy demonstrated in units throughout the country indicates the importance they place on improving patient management. The success of this report is due to continuous support and cooperation from various people and agencies. The effort of the entire group must be congratulated and it has been my sincere hope that this registry is able to sustain in coming years.
I also take this opportunity to thank the Clinical Research centre Ministry of Health Malaysia, to have trust in us and to provide us with the funding for us embark in this project. This annual report is a testament of all our combined effort.
Thank you,
Dr Ravichandran Jeganathan
x
PRELIMINARY REPORT OF NATIONAL OBSTETRICS REGISTRY JULY-DECEMBER 2009Abbreviations
ACRM Association of Clinical Registries Malaysia
APH Antepartum haemorrhage
CRC Clinical Research Centre
CRF Case Report Form
DIVC Disseminated Intravascular Coagulation
DM Diabetes Mellitus
Dr Doctor
ECV External cephalic version
FSB Fresh Stillbirth
GDM Gestational diabetes mellitus
IUGR Intrauterine growth restriction
LSCS Lower segment Cesarean section
MGTT Meal Glucose Tolerance Test
MOH Ministry of Health
MSB Macerated stillbirth
NICU Neonatal intensive-care unit
NHMS National Health Morbidity Survey
NOR National Obstetrics Registry
SDP Source Data Provider
xi
PRELIMINARY REPORT OF NATIONAL OBSTETRICS REGISTRY JULY-DECEMBER 2009
Table of Content
Acknowledgements i
About National Obstetric Registry ii
NOR Steering Committee v
The Editorial Board vi
NOR Source Data Providers 2009 vii
NOR Technical Support Team viii
Letter From The Principal Investigator ix
Abbreviations x
Table Of Content xi
List of Tables xii
List of Figures xiv
Chapter 1: Type Of Delivery 1
Chapter 2 : Anaemia 9
Chapter 3 : Breech Deliveries 15
Chapter 4 : Caesarean Section 21
Chapter 5 : Diabetes Mellitus In Pregnancy 29
Chapter 6 : Prematurity 39
Chapter 7 : Massive Primary Post Partum Haemorrhage 47
xii
PRELIMINARY REPORT OF NATIONAL OBSTETRICS REGISTRY JULY-DECEMBER 2009List of Tables
Table 1.1 : Total Deliveries by Centre, July-December 2009 2 Table 1.2 : Distribution of total deliveries by Type of Delivery, July-December 2009 3 Table 1.3 : Distribution of total deliveries by Age Group, July-December 2009 3 Table 1.4 : Distribution of total deliveries by Ethnicity, July-December 2009 4 Table 1.5 : Distribution of total deliveries by Gravida, July-December 2009 5 Table 1.6 : Distribution of total deliveries by Apgar score, July-December 2009 5 Table 1.7 : Distribution of total deliveries by Medical History - Hypertension,
July-December 2009 6
Table 1.8 : Distribution of total deliveries by Medical History - HIV, July-December 2009 6 Table 1.9 : Distribution of total deliveries by Medical History - Syphilis
July-December 2009 7
Table 1.10 : Distribution of total deliveries by Mother’s Discharge Summary
July-December 2009 7
Table 2.1 : Anaemia at booking and delivery, July-December 2009 10 Table 2.2 : Total deliveries with Anaemia by Age, July-December 2009 10 Table 2.3 : Total deliveries with Anaemia by parity, July-December 2009 11 Table 2.4 : Total deliveries with Anaemia by ethnicity, July-December 2009 11 Table 2.5 : Total deliveries with anaemia by type of delivery, July-December 2009 12 Table 2.6 : Apgar score at 1 min and 5 min in relation to maternal anaemia,
July-December 2009 12
Table 3.1 : Distribution of total breech delivery by age group and ethnicity,
July-December 2009 17
Table 3.2 : Distribution of total breech delivery with complications to baby,
July-December 2009 18
Table 3.3 : Total breech delivery by birth weight and Apgar score, July-December 2009 18 Table 3.4 : Risk and complications associated with breech delivery, July-December 2009 19 Table 4.1 : Distribution for total deliveries by type of delivery, July-December 2009 22 Table 4.2 : Distribution of LSCS by elective and emergency, July-December 2009 22 Table 4.3 : Caesarean Section Rates by Participating Institutions, July-December 2009 23 Table 4.4 : Distribution of Caesarean Section by age, ethnicity and parity,
July-December 2009 24
Table 4.5 : Distribution by Apgar score for alive status birth outcome of LSCS,
July-December 2009 26
Table 4.6 : Primary Post Partum Haemorrhage associated with type of delivery,
July-December 2009 27
Table 4.7 : Primary Post Partum Haemorrhage associated with Caesarean Sections,
July-December 2009 27
Table 5.1 : Incidence of Diabetes in the Participating Hospitals, July-Dec 2009 30 Table 5.2 : Distribution by type of Diabetes. July-December 2009 30 Table 5.3 : Distribution of Preexisting Diabetes Mellitus and GDM by age,
July-December 2009 31
Table 5.4 : Distribution for total deliveries with Diabetes Mellitus by ethnicity,
July-December 2009 31
Table 5.5 : Distribution of total deliveries with diabetes mellitus by parity,
July-December 2009 32
Table 5.6 : Distribution of Diabetes Mellitus by mode of delivery, July-December 2009 33 Table 5.7 : Distribution of Diabetes mellitus by Gestation, July-December 2009 33 Table 5.8 : Distribution of Diabetes Mellitus by birth weight, July-December 2009 34 Table 5.9 : Correlating Apgar score to Diabetes in pregnancy, July-December 2009 35 Table 5.10 : Risk and complications associated with diabetes in pregnancy,
xiii
PRELIMINARY REPORT OF NATIONAL OBSTETRICS REGISTRY JULY-DECEMBER 2009 Table 6.1 : Total number of premature delivery, July-December 2009 40 Table 6.2 : Distribution of total prematurity births (POG < 37 weeks) by Centre,
July-December 2009 41
Table 6.3 : Distribution of total prematurity deliveries (POG < 37 weeks) by
Age group and Ethnicity, July-December 2009 42
Table 6.4 : Distribution of total prematurity deliveries (POG < 37 weeks by Gravida
and Parity groups, July-December 2009 43
Table 6.5 : Distribution of total prematurity deliveries (POG < 37 weeks) by Multiple
pregnancies, July-December 2009 43
Table 6.6 : Distribution of total prematurity births (POG < 37 Weeks) by births status,
July-December 2009 43
Table 7.1 : Distribution of total deliveries with PPH 48
Table 7.2 : Blood loss according to Ethnicity 49
Table 7.3 : Blood loss according to Age 49
Table 7.4 : Blood loss according to Parity 50
Table 7.5 : Complications of pregnancy associated with PPH 50
Table 7.6 : Causes of PPH by mode of delivery 51
Table 7.7 : Maternal outcome following PPH 51
xiv
PRELIMINARY REPORT OF NATIONAL OBSTETRICS REGISTRY JULY-DECEMBER 2009List of Figures
Figure 3.1 : Breech deliveries versus type of deliveries 16 Figure 3.2 : Distribution of total breech delivery by Centre, July-December 2009 17 Figure 4.1 : Distribution by indications (LSCS Details), July-December 2009 26 Figure 5.1 : Distribution of diabetes mellitus by type of stillbirth’s incidents,
1
PRELIMINARY REPORT OF NATIONAL OBSTETRICS REGISTRY JULY-DECEMBER 2009
CHAPTER 1
2
PRELIMINARY REPORT OF NATIONAL OBSTETRICS REGISTRY JULY-DECEMBER 2009CHAPTER 1 TYPE OF DELIVERY
CHAPTER 1: TYPE OF DELIVERY
1.1 Summary
There were 73 095 deliveries recorded in National Obstetrics Registry between July 2009 and December 2009 out of which 53 954 were vaginal deliveries. Malays contributed to 68.5% of the total number of deliveries.
1.2 Introduction
A total of 14 participating hospitals were the source data providers. Table 1.1: Total Deliveries by Centre, July-December 2009
Participating Institutions n %
Hospital Sultanah Aminah 6,608 9.0
Hospital Sultanah Bahiyah 5,257 7.2
Hospital Raja Perempuan Zainab II 6,574 9.0
Hospital Melaka 5,463 7.4
Hospital Tuanku Jaafar 3,703 5.1
Hospital Tengku Ampuan Afzan (HTAA) 4,755 6.5
Hospital Raja Permaisuri Bainun 4,576 6.2
Hospital Tuanku Fauziah 2,259 3.1
Hospital Pulau Pinang 2,608 3.6
Hospital Likas 7,355 10.1
Hospital Umum Sarawak 5,990 8.2
Hospital Tengku Ampuan Rahimah 6,034 8.3
Hospital Sultanah Nur Zahirah 5,915 8.1
Hospital Kuala Lumpur 5,998 8.2
Total 73,095 100.0
3
Table 1.2: Distribution of total deliveries by Type of Delivery, July-December 2009
Type of Delivery n %
The Caesarean Section rate shown in table 1.2 is at 22.4%whilst the overall rate of Caesarean Section in the country was 10.5% in 2000 and 15.7% in 2006.(1) This clearly shows that Caesarean Section rates have progressively gone up over the last 10 years and currently the Caesarean section rate is similar to that of the UK in 2004 at 22.4%.
1.3 Patient Demographic
Table 1.3: Distribution of total deliveries by Age Group, July-December 2009
Age group (Years) Vaginal (n) % Instrument (n) % Caesarean (n) % Missing (n) Total (n) %
10-<20 3,180 5.9 168 6.1 476 2.9 0 3,824 5.2
20-<30 30,081 55.8 1,820 66.3 7,916 48.3 5 39,822 54.5
30-<40 18,514 34.3 675 24.6 7,025 42.9 1 26,215 35.9
40-<50 1,890 3.5 64 2.3 887 5.4 0 2,841 3.9
50-<55 10 0.0 0 0.0 4 0.0 0 14 0.0
Missing 279 0.5 19 0.7 81 0.5 0 379 0.5
Total 53,954 73.8 2,746 3.8 16,389 22.4 6 73,095 100.0
4
Table 1.4: Distribution of total deliveries by Ethnicity, July-December 2009
Ethnicity Vaginal (n) % Instrument (n) % Caesarean (n) % Missing (n) Total (n) %
Malay 37,156 68.9 1,811 66.0 11,117 66.0 4 50,088 68.5
Chinese 3,821 7.1 283 10.3 1,430 10.3 1 5,535 7.6
Other indigenous group in Sabah & Sar-awak
5
Table 1.5: Distribution of total deliveries by Gravida, July-December 2009
Gravida Vaginal (n) % Instrument (n) % Caesarean (n) % Missing (n) Total (n) %
1 16,088 29.8 1,712 62.3 5,583 34.1 3 23,386 32.0
2-5 32,858 60.9 955 34.8 9,472 57.8 3 43,288 59.2
6-9 4,574 8.5 69 2.5 1,201 7.3 0 5,844 8.0
≥10 387 0.7 8 0.3 120 0.7 0 515 0.7
0/missing 47 0.1 2 0.1 13 0.1 0 62 0.1
Total 53,954 73.8 2,746 3.8 16,389 22.4 6 73,095 100.0
Table 1.5 shows that the rate of Caesarean Section is almost consistent with all parity ranging from 23.0% in Primigravida, 21.8% in Gravida 2-5, 20.5% in Gravida 6-9 and 23.0 % in Gravida 10 and above.
1.4 Complications and Outcome
Studies have shown that Apgar score does not usually reflect the degree of acidosis at delivery and hence it needs to be correlated to umbilical artery pH.
Table 1.6: Distribution of total deliveries by Apgar score, July-December 2009
Apgar at 1 min Vaginal (n) % Instrument (n) % Caesarean (n) % Total (n) %
<7 834 1.6 246 8.9 1068 6.4 2148 2.9
≥7 52326 97.4 2490 90.5 15627 93.6 70443 96.3
Missing 559 1.0 15 0.5 5 0.0 579 0.8
TOTAL(Alive Births) 53719 73.4 2751 3.8 16700 22.8 73170 100.0
Apgar at 5 min Vaginal % Instrument % Caesarean % Total %
<7 202 0.4 38 1.4 239 1.4 479 0.6
≥7 52923 98.5 2694 97.9 16442 98.5 72059 98.5
Missing 594 1.1 19 0.7 19 0.1 632 0.9
6
From table 1.6, low Apgar score incidence seems to be highest at 1 and 5 mins with Caesarean Section deliveries at 49.0% and this is consistent with most studies.
Table 1.7: Distribution of total deliveries by Medical History - Hypertension, July-December 2009
Type of Hypertension Vaginal (n) % Instrument (n) % Caesarean (n) % Total (n) %
Pre Existing 388 13.4 28 14.1 213 11.3 629 12.7
Gestational 1,672 58.0 117 59.1 1,280 67.9 3,069 61.8
Chronic hypertension with uperimposed
Pre-Eclampsia 134 4.6 10 5.1 162 8.6 306 6.2
Unclassified 35 1.2 5 2.5 13 0.7 53 1.1
NA/Missing 656 22.7 38 19.2 216 11.5 910 18.3
Total 2,885 58.1 198 4.0 1884 37.9 4,967 100
The prevalence of Gestational Hypertension is 4.1 % in the Malaysian population whilst 54.4% of these patients delivered vaginally and 41.0 % had undergone Caesarean Section.
Table 1.8: Distribution of total deliveries by Medical History - HIV, July-December 2009
HIV Vaginal (n) % Instrument (n) % Caesarean (n) % Missing (n) Total (n) %
Reactive 110 0.2 7 0.3 102 0.6 0 219 0.3
Non Reactive 52,584 97.5 2,662 96.9 15,573 95.0 5 70824 96.9
Indeterminate 6 0.0 0 0.0 1 0.0 0 7 0.0
NA 1254 2.3 77 2.8 713 4.4 1 2,045 2.8
7
The proportion of new cases of HIV in females was 1.4% in 2000 and 15.0% in 2006.(2) In our pregnant mothers this incidence is 0.3%.This low figure could be due to not reporting as this was not a mandatory field when the CRF was initially developed. The current MOH guideline for mode of delivery of retroviral positive cases to reduce vertical transmission is by Caesarean Section. This includes those not on treatment as well as those with monotherapy of zidovudine and for those with viral load of more than 1, /ml. 46.5% of patients underwent Caesarean Section whereas 50.2% of patients delivered vaginally. Grade B recommendation for vaginal delivery is if a patient has been treated with HAART with viral load of less than 1,000 copies/ml and has opted for vaginal delivery. Further analysis is required to conclude the reason for a high percentage of patients being delivered vaginally.
Table 1.9: Distribution of total deliveries by Medical History - Syphilis July-December 2009
Syphilis Vaginal (n) % Instrument (n) % Caesarean (n) % Missing (n) Total (n) %
Yes 106 0.2 4 0.1 53 0.3 0 163 0.2
No 51,616 95.7 2,627 95.7 15,256 93.1 5 69,504 95.1
NA 2,232 4.1 115 4.2 1,080 6.6 1 3428 4.7
Total 53,954 73.8 2,746 3.8 16,389 22.4 6 73,095 100.0
The incidence of Syphilis in our pregnant mothers is 0.2%. This low figure could again be due to not reporting as this was not a mandatory field when the CRF (Case Report Form) was initially developed.
Table 1.10: Distribution of total deliveries by Mother’s Discharge Summary July-December 2009
Mother Discharge Summary Vaginal (n) % Instrument (n) % Caesarean (n) % Missing (n) Total (n) %
Alive 53,944 100 2,745 100 16,385 99.9 6 73,080 100
Dead 10 <0.0 1 <0.0 4 0.02 0 15 <0.0
Total 53,954 73.8 2,746 3.8 16,389 22.4 6 73,095 100
8
PRELIMINARY REPORT OF NATIONAL OBSTETRICS REGISTRY JULY-DECEMBER 2009CHAPTER 1 TYPE OF DELIVERY
1.5 Conclusion
Currently the registry gets data from 14 participating hospital. In 2009 the recorded deliveries for the nation was 481,669. From July to Dec 2009 the deliveries recorded was 242,396 and NOR captured 73,095 which accounted for 30.15 of deliveries. The data obtained could be useful in future to improve obstetric services in the country.
Our future plans are to include all hospitals with birthing facilities in stages to contribute data to the obstetric registry for a comprehensive analysis
1.6 Recommendation
1. To develop a CRF that is more comprehensive to analyze the data.
2. Train people to key in complete accurate data so that time invested in cleaning data is negligible.
3. Convert important data fields to mandatory fields. 4. Include trend analysis reports into the system.
1.7 References
1. Rising Caesarean section rates in Public Hospitals in Malaysia 2006. J Ravindran FRCOG. 2. Clinical Practice Guidelines. Management of HIV infection in pregnant mother. MOH/P/PAK/
156.08(GU)
9
PRELIMINARY REPORT OF NATIONAL OBSTETRICS REGISTRY JULY-DECEMBER 2009
CHAPTER 2
10
PRELIMINARY REPORT OF NATIONAL OBSTETRICS REGISTRY JULY-DECEMBER 2009CHAPTER 2 ANAEMIA
CHAPTER 2 : ANAEMIA
2.1 Summary
The incidence of anaemia at booking was 22.1% and there is a noticeable improvement to 7.3% at delivery. More than 30.0% Indians, Orang Asli Peninsular, Bajau, Murut and the Kadazan/ Dusun ethnicities in the 14 state Hospitals had anaemia at booking. Grandmultiparity and teenage pregnancy are seen as significant risk factors for anemia.
2.2 Introduction
Anemia is the most prevalent nutritional deficiency during pregnancy. It is a pathological condition in which the oxygen-carrying capacity of red blood cells is insufficient to meet the body’s needs. Often the diagnosis is based on blood values, in particular haemoglobin concentration. The WHO recommends that the haemoglobin concentration should not fall below 11g/dl at any time during pregnancy, but many clinicians use the figure of 10.5g/dl as recommended by the Centers for Disease Control of North America. In this report the reference level of < 11g/dl was taken as anemia.
Table 2.1: Anaemia at booking and delivery, July-December 2009
Category (n) Total (n) %
Anaemia At Booking 16129 73095 22.1
Anaemia at Delivery 5369 73095 7.3
The data for analysis was obtained from 73095 patients in the 14 state hospitals. The number of women with anemia at booking was 16129 from a total of 73095, which accounts for 22.1% as compared to the overall prevalence of anemia in pregnancy. A cross sectional survey done in 2007 reported the prevalence of anaemia was 35%(1) The incidence of anemia at delivery was only 7.3%. This improvement is most probably due to an early identification of anemia during the antenatal period and active measures had been taken by all attending medical personals to correct the condition prior to delivery.
2.3 Patient Demographic
Table 2.2: Total deliveries with Anaemia by Age, July-December 2009
Age group n Anaemia at booking % Anaemia at delivery %
10-<20 years 3180 1266 39.8 272 8.6
20-<30 years 39822 8434 21.2 2835 7.1
30-<40 years 26215 5626 21.5 2014 7.9
40-<50 years 2841 698 24.6 219 7.7
50-<55 years 14 3 21.4 0 0
Unknown 379 102 26.9 29 7.7
11
PRELIMINARY REPORT OF NATIONAL OBSTETRICS REGISTRY JULY-DECEMBER 2009
ANAEMIA CHAPTER 2
Table 2.2 showed that the highest rate of anemia in pregnancy at booking involved the age groups of 10-<20 years old which accounted for 39.8% and this was also noted in the cross sectional survey done in 2007.The incidence of anemia in this age group improved to 8.5% at delivery. For the other age groups the incidence of anemia at booking was at 21.2% and has improved to about 7.0% at delivery. It is a known fact that anemia in pregnancy is a common problem in teenage pregnancy and the most likely reason for this is their poor dietary habits, poor nutritional knowledge, ignorant about pre-pregnancy care and unstable socio economic status.
Table 2.3: Total deliveries with Anaemia by parity, July-December 2009
Parity group n Anaemia at booking % Anaemia at delivery %
Para 1 18639 3804 20.4 1376 25.6
Para 2-5 26543 6230 23.5 2133 39.7
Para 6-9 2126 686 32.3 192 3.6
Para ≥10 206 76 36.9 13 6.3
Total 73038 16129 22.1 5369 7.4
The table above illustrates the total deliveries with anaemia by parity.
The majority was from parity ≥ 10 group, which comprised of 36.9% in the anaemia at booking and followed by 32.3 % in the para 6-9 group. It is obvious that the incidence of anemia increases with parity. This finding is consistent with previous reports and studies that the risk of anemia is highest among grandmultipara. Grandmultiparity is strongly associated with uterine atony and PPH, which can be worsened in the presence of anemia. It is a known fact that adequate family planning can significantly reduce anemia by reducing the frequency of pregnancy and delivery. Importance of family planning counseling must be emphasized in the training sessions of all health care providers.
Table 2.4: Total deliveries with Anaemia by ethnicity, July-December 2009
Race n Anaemia at booking % Anaemia at delivery %
Malay 50088 9945 19.9 3997 8.0
Chinese 5535 1126 20.3 299 5.4
Indian 4068 1405 34.5 600 14.7
Kadazan/ Dusun 2275 706 31.0 23 1.0
Murut 160 51 31.9 1 0.6
Bajau 2080 681 32.7 22 1.1
Melanau 55 16 29.1 2 3.6
Iban 1303 247 19.0 23 1.8
Bidayuh 935 165 17.6 16 1.7
Orang Asli
Other 5435 1462 26.9 298 5.5
Unknown 40 19 13.6 1 0.7
12
PRELIMINARY REPORT OF NATIONAL OBSTETRICS REGISTRY JULY-DECEMBER 2009CHAPTER 2 ANAEMIA
From Table 2.4, the Indian ethnicity had the highest incidence of anaemia at 34.1%. A small study done in the 80’s at Maternity Hospital Kuala Lumpur showed the prevalence of anemia to be the highest among the Indian mothers (2). From our data we also noted the incidence of anaemia among the indigenous people in Malaysia to be high. The incidence of anaemia in the Orang Asli Peninsular, Bajau, Murut and the Kadazan/Dusun ethnicities were at 32.7%, 32.7%, 31.9% and 31.0% respectively. This is probably attributed by the lower socio-economic background leading to poor dietary intake and resulting in poor body iron stores. Fortunately, the incidence of anaemia has reduced with prompt detection and correction during antenatal period.
2.4 Complications and Outcome
Table 2.5: Total deliveries with anaemia by type of delivery, July-December 2009
Type of delivery n Anaemia at booking % Anaemia at delivery %
Vaginal 53954 12521 23.2 3590 6.7
Instrumental 2746 507 18.5 147 5.4
Caesarean 16389 3101 18.9 1632 10.0
Total 73089 16129 22.1 5369 7.3
About 10.0% of patients who had anaemia at delivery needed caesarean section. Women undergoing caesarean section are exposed to the risk of haemorrhage. With a decreased haemoglobin concentration they are at risk of compromise and therefore it is vital to identify these patients for early correction of anaemia during the antenatal period
Table 2.6: Apgar score at 1 min and 5 min in relation to maternal anaemia, July-December 2009
Apgar 1 min Anaemia at Delivery %
1min <7 209 3.9
1min >=7 5132 95.1
Missing 55 1.0
Total (Alive Births) 5396 100.0
Apgar 5 min Anaemia at Delivery %
5min <7 46 0.9
5min >=7 5286 98.0
Missing 64 1.2
Total (Alive Births) 5396 100.0
13
PRELIMINARY REPORT OF NATIONAL OBSTETRICS REGISTRY JULY-DECEMBER 2009
ANAEMIA CHAPTER 2
2.5 Conclusion
Approximately one fifth of mothers who delivered in a tertiary government hospital had anemia at booking. However, the incidence of anemia at the time of delivery improved to 7.3%. This is mainly due to prompt detection and correction of anemia during the antenatal period. There is a higher incidence of woman with anemia in the 10-<20 years age group. This is consistent with the findings of other studies. Indians are at risk of developing anemia during pregnancy. Grandmultiparas are at a higher risk of anemia as compared to lower parity. About 10% of women undergoing caesarean section had anemia.
2.6 Recommendation
1. Anemia in pregnancy should be diagnosed early and corrected appropriately.
2. Family planning should be emphasized to have adequate spacing and this allows the woman to build up her iron stores before embarking on the next pregnancy.
3. Patients with poor compliance to oral haematinics will require parenteral iron to ensure optimal iron stores.
4. Family planning counseling should be given to both husband and wife, to ascertain adequate birth spacing.
5. Early diagnosis and intervention of anemia is important to reduce incidence of anemia at delivery and its associated complications especially in the ethnic groups with high prevalence of anemia.
2.7 Reference
1. Anemia in pregnancy in Malaysia: a cross-sectional survey. Jamaiyah Haniff et al on behalf of Malaysian Anemia study group. 2007
15
PRELIMINARY REPORT OF NATIONAL OBSTETRICS REGISTRY JULY-DECEMBER 2009
CHAPTER 3
16
PRELIMINARY REPORT OF NATIONAL OBSTETRICS REGISTRY JULY-DECEMBER 2009CHAPTER 3 BREECH DELIVERIES
CHAPTER 3 : BREECH DELIVERIES
3.1 Summary
The incidence of breech deliveries is 3.5% and the majority of cases was delivered by Caesarean section which accounted to 85.0% whilst External cephalic version (ECV) is a was rarely practiced at the participating hospitals and this accounted for 5.7% of the cases.
Most of the breech deliveries were among nulliparous women. There was no significant difference in the baby’s outcome when compared vaginal breech delivery to abdominal delivery. Preterm labour contributed to the highest complication associated with breech deliveries.
3.2 Introduction
Breech presentation is the most commonly encountered malpresentation. The incidence of breech presentation decreases from 20.0% at 28 weeks of gestation to 3.0-4.0% at term. The management of breech deliveries has been the subject of intense discussion in obstetrics.
ECV has been shown to reduce the risk of caesarean section without apparent risk to fetus. Current practice suggested that ECV should be performed later than 37 completed weeks with success rate varying from center to center.
Women should be counseled for elective caesarean section as this two-third reduction in perinatal mortality or morbidity. There is also a place for vaginal breech delivery in centers with adequate trained personnel and no contraindication to vaginal breech delivery. Woman must be fully informed of the risks and benefits of ECV.
3.3 Mode of breech deliveries
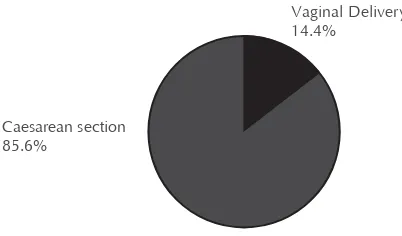
Figure 3.1: Breech deliveries versus type of deliveries
From the data collected, of the 73095 total deliveries, breech deliveries accounted for 3.5% of which 85.6% of cases were delivered by caesarean section and the rest of the cases had assisted vaginal breech deliveries.
Vaginal Delivery 14.4%
17
PRELIMINARY REPORT OF NATIONAL OBSTETRICS REGISTRY JULY-DECEMBER 2009
BREECH DELIVERIES CHAPTER 3
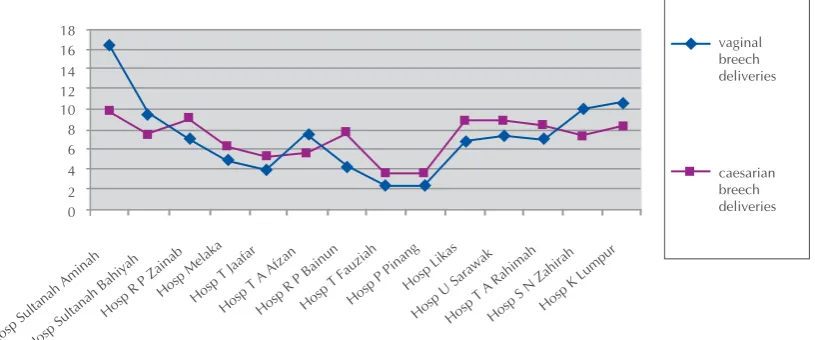
Figure 3.2: Distribution of total breech delivery by Centre, July-December 2009
The above figure shows that Hospital Sultanah Aminah had the highest number of assisted vaginal breech deliveries.
3.4 Patient Demographic
Table 3.1: Distribution of total breech delivery by age group and ethnicity, July-December 2009 Age group (years) Vaginal Breech % Caesarean Breech % Total %
10-<20 22 16.2 114 83.8 136 5.4
20-<30 169 13.4 1095 86.6 1264 50.4
30-<40 144 14.8 827 85.2 971 38.8
40-<50 24 19.7 98 80.3 122 4.9
50-<55 0 0 0 0 0 0
Missing 2 16.7 10 83.3 12 0.5
Ethnicity Vaginal Breech % Caesarean Breech % Total %
Malay 259 15.1 1457 84.9 1716 68.6
Chinese 25 11.7 189 88.3 214 8.5
Indian 19 15.2 106 84.8 125 5.0
Kadazan/ Dusun 10 12.5 70 87.5 80 3.2
Murut 1 16.7 5 83.3 6 0.2
Other 19 11.2 150 88.8 169 6.7
Unknown 1 16.7 5 83.3 6 0.2
Total 361 14.4 2144 85.6 2505 100.0
18
PRELIMINARY REPORT OF NATIONAL OBSTETRICS REGISTRY JULY-DECEMBER 2009CHAPTER 3 BREECH DELIVERIES
As shown in the above table 50.4% of patients in the 20-30yrs age group had breech deliveries. There was no correlation between ethnicity and breech deliveries where else. From chapter 1 we know that caesarean section rates were higher among the Indians however caesarean section as mode of delivery for breech presentation didn’t vary between the Malay, Indians and Chinese communities.
Table 3.2: Distribution of total breech delivery with complications to baby, July-December 2009 Complications to Baby Vaginal Breech % Caesarean Breech % Total %
None 158 43.2 1303 60.4 1461 57.9
Asphyxia (As <5 at 1 min, <7 at 5 min)
39 10.7 49 2.3 88 3.5
Meconium aspiration syndrome
3 0.8 6 0.3 9 0.4
Births injuries, specify 0 0 0 0 0 0
Anomaly 3 0.8 7 0.3 10 0.4
IUGR 1 0.3 7 0.32 8 0.3
Prematurity 19 5.2 29 1.34 48 1.9
IUD 20 5.5 0 0 20 0.8
Other, specify 0 0 5 0.23 5 0.2
Vaginal breech delivery requires an experienced obstetrician and careful counseling of the parents. Breech babies born vaginally in most studies have poor Apgar score when compared to breech babies delivered by elective caesarean section. From our data breech babies delivered by caesarean section both elective and emergency had good Apgar score as compared to vaginal delivery.
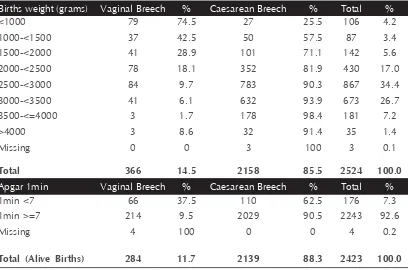
Table 3.3: Total breech delivery by birth weight and Apgar score, July-December 2009 Births weight (grams) Vaginal Breech % Caesarean Breech % Total %
<1000 79 74.5 27 25.5 106 4.2
1000-<1500 37 42.5 50 57.5 87 3.4
1500-<2000 41 28.9 101 71.1 142 5.6
2000-<2500 78 18.1 352 81.9 430 17.0
2500-<3000 84 9.7 783 90.3 867 34.4
3000-<3500 41 6.1 632 93.9 673 26.7
3500-<=4000 3 1.7 178 98.4 181 7.2
>4000 3 8.6 32 91.4 35 1.4
Missing 0 0 3 100 3 0.1
Total 366 14.5 2158 85.5 2524 100.0
Apgar 1min Vaginal Breech % Caesarean Breech % Total %
1min <7 66 37.5 110 62.5 176 7.3
1min >=7 214 9.5 2029 90.5 2243 92.6
Missing 4 100 0 0 4 0.2
19
PRELIMINARY REPORT OF NATIONAL OBSTETRICS REGISTRY JULY-DECEMBER 2009
BREECH DELIVERIES CHAPTER 3
Apgar 5min Vaginal Breech % Caesarean Breech % Total %
5min <7 28 57.1 21 42.9 49 2.0
5min >=7 247 10.4 2116 89.5 2363 97.5
Missing 9 81.8 2 18.2 11 0.5
Total (Alive Births) 284 11.7 2139 88.3 2423 100.0
From the Table 3.3, it was seen that 85.5% of patients with breech presentation had caesarean section as the mode of delivery. Apgar score of >7 at 1 min and > 7 at 5 min was 90.5% and 89.5% respectively. In most studies it has been reported that the caesarean breech babies have poor Apgar score but this is not so from the NOR data.
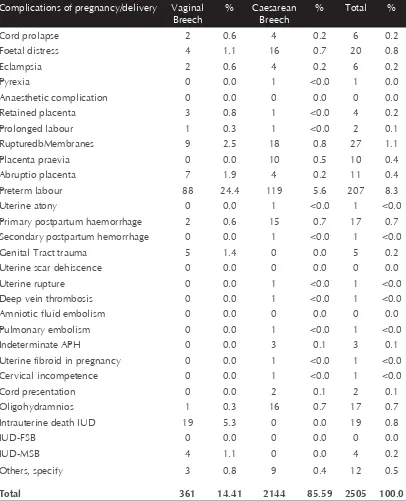
Table 3.4: Risk and complications associated with breech delivery, July-December 2009 Complications of pregnancy/delivery Vaginal
Foetal distress 4 1.1 16 0.7 20 0.8
Eclampsia 2 0.6 4 0.2 6 0.2
Pyrexia 0 0.0 1 <0.0 1 0.0
Anaesthetic complication 0 0.0 0 0.0 0 0.0
Retained placenta 3 0.8 1 <0.0 4 0.2
Prolonged labour 1 0.3 1 <0.0 2 0.1
RupturedbMembranes 9 2.5 18 0.8 27 1.1
Placenta praevia 0 0.0 10 0.5 10 0.4
Abruptio placenta 7 1.9 4 0.2 11 0.4
Preterm labour 88 24.4 119 5.6 207 8.3
Uterine atony 0 0.0 1 <0.0 1 <0.0
Primary postpartum haemorrhage 2 0.6 15 0.7 17 0.7
Secondary postpartum hemorrhage 0 0.0 1 <0.0 1 <0.0
Genital Tract trauma 5 1.4 0 0.0 5 0.2
Uterine scar dehiscence 0 0.0 0 0.0 0 0.0
Uterine rupture 0 0.0 1 <0.0 1 <0.0
Deep vein thrombosis 0 0.0 1 <0.0 1 <0.0
Amniotic fluid embolism 0 0.0 0 0.0 0 0.0
Pulmonary embolism 0 0.0 1 <0.0 1 <0.0
Indeterminate APH 0 0.0 3 0.1 3 0.1
Uterine fibroid in pregnancy 0 0.0 1 <0.0 1 <0.0
Cervical incompetence 0 0.0 1 <0.0 1 <0.0
Cord presentation 0 0.0 2 0.1 2 0.1
Oligohydramnios 1 0.3 16 0.7 17 0.7
Intrauterine death IUD 19 5.3 0 0.0 19 0.8
IUD-FSB 0 0.0 0 0.0 0 0.0
IUD-MSB 4 1.1 0 0.0 4 0.2
Others, specify 3 0.8 9 0.4 12 0.5
20
PRELIMINARY REPORT OF NATIONAL OBSTETRICS REGISTRY JULY-DECEMBER 2009CHAPTER 3 BREECH DELIVERIES
Although studies on the delivery of the preterm breech are limited, the recent multicenter term breech trial found an increased rate of perinatal mortality and serious immediate perinatal morbidity. Our data showed that 8.3% of breech delivery was associated with prematurity and 24.4% of these cases had vaginal breech deliver. Fetal head entrapment may result from an incompletely dilated cervix and this percentage is higher with preterm fetuses (< 32 wk), when the head is larger than the body and a head that lacks time to mold to the maternal pelvis. This occurs in 0- 8.5% of vaginal breech deliveries. Hence careful assessment is mandatory when premature breech babies are allowed vaginal delivery.
3.5 Conclusion
The incidence of breech delivery was 3.5% from the total number of deliveries captured from the 14 hospitals contributing data to the registry of which 85.0% were delivered via caesarean section. Breech babies delivered by caesarean section had good outcome as compared to babies delivered vaginally and this is consistent with most studies. Breech deliveries were also associated with prematurity from our data.
3.6 Recommendation
1. External cephalic version (ECV) is a safe alternative to vaginal breech delivery or cesarean delivery hence it should be an option offered for suitable cases as several studies evaluating the success of ECV have good outcome which varies between 50%-80%.
2. Modules on methods and protocols for ECV should be available at all centers with specialist and should be included in the formal training for the trainees.
3. With the dwindling numbers of experienced obstetricians who still perform vaginal breech deliveries and who can teach future generations of obstetricians, this technique may soon be lost.Continuous training for all birth attendances using models and videos in performing vaginal breech delivery, supervised by experienced obstetricians/consultants should be implemented in all centers.
3.7 Reference
1. Royal College of Obstetricians and Gynaecologist : Guideline No 20b December 2006. The management of breech presentation.
2. Royal College of Obstetricians and Gynaecologist, Guideline No 20a Externalcephalic version (ECV) and reducing the incidence of Breech presentation.
21
PRELIMINARY REPORT OF NATIONAL OBSTETRICS REGISTRY JULY-DECEMBER 2009
CHAPTER 4
22
PRELIMINARY REPORT OF NATIONAL OBSTETRICS REGISTRY JULY-DECEMBER 2009CHAPTER 4 CAESAREAN SECTION
CHAPTER 4 : CAESAREAN SECTION
4.1 Summary
Caesarean sections account for 22.4% of all deliveries in major Government Hospitals in Malaysia. There is a higher risk of Caesarean sections among older mothers and among Indian mothers. The main indication for Caesarean section is fetal distress and this is followed by malpresentations/lie and abnormal progress of labour. There is significant morbidity from Caesarean sections especially from primary Postpartum Haemorrhage.
4.2 Introduction
Table 4.1: Distribution for total deliveries by type of delivery, July-December 2009
Type of Delivery No. %
Vaginal 53954 73.8
Instrument 2746 3.8
Caesarean 16389 22.4
Missing 6 0.0
Total 73095 100.0
There were a total of 16,389 Caesarean sections which accounted for approximately 22.4% of all deliveries. This figure is unusually high but as NOR data is currently from tertiary Government Hospitals, this high Caesarean Section rate is not unexpected as these Hospitals cater for referrals and high risk deliveries. However, there is a significant increase compared to the early nineties. Table 4.2: Distribution of LSCS by elective and emergency, July-December 2009
Type of LSCS No. %
Elective 3718 22.7
Emergency 12671 77.3
Total 16389 100.0
2
Table 4.3: Caesarean Section Rates by Participating Institutions, July-December 2009
Participating Institutions LSCS
Rates (%)
Elective Emergency Total Deliveries
Hospital Sultanah Aminah 25.9 339 1373 6608
Hospital Sultanah Bahiyah 23.2 407 812 5257
Hospital Raja Perempuan Zainab II 20.7 149 1210 6574
Hospital Melaka 19.9 320 766 5463
Hospital Tuanku Jaafar 25.2 231 704 3703
Hospital Tengku Ampuan Afzan (HTAA) 24.9 260 924 4755
Hospital Raja Permaisuri Bainun 31.1 329 1096 4576
Hospital Tuanku Fauziah 21.7 115 376 2259
Hospital Pulau Pinang 23.4 186 425 2608
Hospital Likas 16.8 254 985 7355
Hospital Umum Sarawak 18.3 208 887 5990
Hospital Tengku Ampuan Rahimah 24.4 337 1134 6034
Hospital Sultanah Nur Zahirah 17.8 240 816 5915
Hospital Kuala Lumpur 25.1 343 1163 5998
2
Table 4.4: Distribution of Caesarean Section by age, ethnicity and parity, July-December 2009
Type of delivery Vaginal Instrument Caesarean Missing Total
Age Group (Years) No. % No. % No. % No. % No. % of all del.
10-<20 3180 83.2 168 4.4 476 12.4 0 0.0 3824 5.2
20-<30 30081 75.5 1820 4.6 7916 19.9 5 <0.0 39822 54.5
30-<40 18514 70.6 675 2,6 7025 26.8 1 <0.0 26215 35.9
40-<50 1890 66.5 64 2.3 887 31.2 0 0.0 2841 3.9
50-<55 10 71.4 0 0.0 4 28.6 0 0.0 14 <0.0
Unknown 279 73.6 19 5.0 81 21.4 0 0.0 379 0.5
Race No. % No. % No. % No. % No. %
Malay 37156 74.2 1811 3.6 11117 22.2 4 <0.0 50088 68.5
Chinese 3821 69.0 283 5.1 1430 25.8 1 <0.0 5535 7.6
Indian 2578 63.4 187 4.6 1303 32.0 0 0.0 4068 5.6
Kadazan/ Dusun 1775 78.0 71 3.1 429 18.9 0 0.0 2275 3.1
Murut 132 82.5 4 2.5 24 15.0 0 0.0 160 0.2
Other indigenous group in Sabah & Sarawak 368 70.5 12 23.0 142 27.2 0 0.0 522 0.7
2
0 17293 67.8 1878 7.4 6350 24.9 3 <0.0 25524 34.9
1 14140 75.9 497 2.7 4000 21.5 2 <0.0 18639 25.5
2-5 20624 77.7 348 1.3 5570 21.0 1 <0.0 26543 36.3
6-9 1692 79.6 21 1.0 413 19.4 0 0 2126 2.9
≥10 161 78.2 1 0.5 44 21.4 0 0 206 0.3
Total 53910 73.7 2745 3.8 16389 22.4 6 <0.0 73095 100.0
There was a low Caesarean Section rate among very young mothers with a rate of only 12.4% and more Caesarean sections as the mother gets older (Caesarean section rate of 31.2% among mothers aged 40 to 50 years). This is expected as the older mother usually carries more risks during her pregnancy
and in labour and may have other medical problems, previous scars and for subfertility as well as for fetal issues (IUGR, fetal abnormalities, multiple pregnancies).
26
PRELIMINARY REPORT OF NATIONAL OBSTETRICS REGISTRY JULY-DECEMBER 2009CHAPTER 4 CAESAREAN SECTION
4.4 Complications and Outcomes
Figure 4.1: Distribution by indications (LSCS Details), July-December 2009
Approximately 30.0% of all Caesarean sections are for ‘Fetal Distress’. This is followed by abnormal labour progress and malpresentation, both which roughly accounts for 14.0% of all sections. Table 4.5: Distribution by Apgar score for alive status birth outcome of LSCS, July-December 2009
Apgar 1min Elective % Emergency % Total %
Apgar 1min <7 88 8.5 947 91.5 1035 6.3
Apgar 1min ≥7 3616 23.9 11654 76.3 15270 93.6
Missing 0 0.0 5 100.0 5 <0.0
Total (Alive Births) 3704 22.7 12606 77.3 16310 100.0
Apgar 5min Elective % Emergency % Total %
Apgar 5min <7 13 5.7 215 94.3 228 1.4
Apgar 5min ≥7 3689 23.0 12375 77.0 16064 98.5
Missing 2 11.1 16 88.9 18 0.1
Total (Alive Births) 3704 22.7 12606 77.3 16310 100.0
There were 79 babies who were born dead to mothers who had undergone Caesarean Section. Majority of these Caesarean sections were for malpresentation of the dead fetus. Of the remaining 16310 babies who were born alive, 93.6% had an Apgar score of 7 or higher at delivery and by 5 minutes, about 98.5% of babies had Apgar scores of 7 or higher. This suggests that for the majority of Caesarean section, the section were timely. About 6.7% of babies were delivered with very low Apgar scores (less than 6) at 1 minute.
27
PRELIMINARY REPORT OF NATIONAL OBSTETRICS REGISTRY JULY-DECEMBER 2009
CAESAREAN SECTION CHAPTER 4
Table 4.6: Primary Post Partum Haemorrhage associated with type of delivery, July-December 2009
Type of delivery Vaginal Instrument Caesarean
Primary postpartum
<1500 mls 199 36.88 26 94.68 154 93.97
≥1500 mls 18 3.34 2 7.28 77 46.98
Not Available/Missing 11 3 9
Total 228 42.25 31 112.89 241 147.05
According to the table above, the risk of bleeding following a Caesarean section (primary PPH) is much higher (147.05/10,000 CS) than when compared to a vaginal delivery (42.35/10,000 vaginal deliveries). The risk of bleeding of less than 1500mls is no different from risks of bleeding following an instrumental delivery. However risks of excessive bleeding of more than 1500mls is 20 times higher than that following a vaginal or instrumental delivery. This excess risk is worrying and needs to be address further.
Table 4.7: Primary Post Partum Haemorrhage associated with Caesarean Sections, July-December 2009
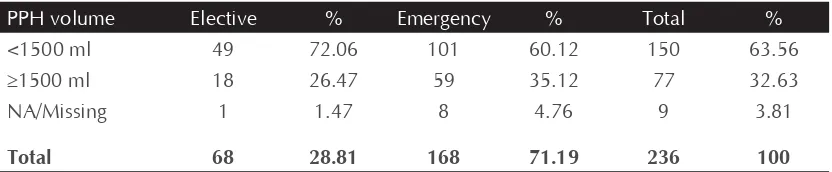
PPH volume Elective % Emergency % Total %
<1500 ml 49 72.06 101 60.12 150 63.56
≥1500 ml 18 26.47 59 35.12 77 32.63
NA/Missing 1 1.47 8 4.76 9 3.81
Total 68 28.81 168 71.19 236 100
4.5 Conclusion
Approximately one fifth of mothers who deliver in a tertiary Government Hospital were though Caesarean section. This high incidence of Caesarean Section (22.4%) is significantly higher than rates quoted from the same hospitals in the late eighties and early nineties. For example, in HKL, the Caesarean section rates was 12.0 % in 1990 and 25.1% in 2009.There is a higher chance of an older mother delivering by Caesarean Section than a younger mother but this is not unexpected. What is interesting however the higher rate of Caesarean sections among Indian mothers is (32.0%) when compared to other races.
These Caesarean section carries with it significant morbidity. In the immediate post operative period, risks of PPH are extremely high with risks of severe PPH (>1500mls) to be about 20 X higher that those mothers delivered vaginally.
These operative deliveries are also though to be associated with higher risks of thromboembolic events and ICU admissions but unfortunately for the moment these events are not captured by the NOR. Based on the previous CEMD reports, many mothers die as well following the Caesarean sections. There is a need to ensure that Caesarean section are indicated, timely, adequately performed by adequately trained staff and with adequate resources (blood, blood
28
PRELIMINARY REPORT OF NATIONAL OBSTETRICS REGISTRY JULY-DECEMBER 2009CHAPTER 4 CAESAREAN SECTION
4.6 Recommendations
1. Standardized protocols / guidelines for labour management
2. To encourage all Hospitals to have a Caesarean Audit on a regular basis.
3. As majority of the Caesarean section were done as an emergency procedure, the Hospital should ensure that there is a dedicated operating theatre to cater for these emergency sections.
4. There should be adequate guidelines on safe surgery, access of blood, category of staff managing the case both from the O & G department as well as the anaesthetic department. These guidelines must be applicable for both during office hours and after hours.
5. Because of the very high risk of excessive bleeding following a Caesarean section, there must be adequate protocols to address the availability of blood. The role of ‘Group and Save’ versus ‘Group and Cross Match’ and the role and use of Emergency Blood.
6. Drugs to control PPH following Caesarean Sections such as Carboprost, Misoprostol, i/v Tranxenemic Acid and Novo 7 should be readily available especially after office hours. 7. In busy Obstetric specialist should be on site during on calls.
4.7 References
29
PRELIMINARY REPORT OF NATIONAL OBSTETRICS REGISTRY JULY-DECEMBER 2009
CHAPTER 5
30
PRELIMINARY REPORT OF NATIONAL OBSTETRICS REGISTRY JULY-DECEMBER 2009CHAPTER 5 DIABETES MELLITUS IN PREGNANCY
CHAPTER 5 : DIABETES MELLITUS IN PREGNANCY
5.1 Summary
The incidence of Diabetes in Pregnancy is about 11.1%of all deliveries in Government Hospitals. Higher incidence of Diabetes in Pregnancy was seen in age group 40-50 years. Multigravidas and Indians had a higher incidence of Diabetes complicating pregnancy.
5.2 Introduction
There was a total of 73855 deliveries recorded in the NOR data of which 8241 patients had diabetes in pregnancy and this included both pre-existing and gestational diabetes making the incidence about 11.1% of all pregnancies. This data correlates well with the national statistics of about 10.0%
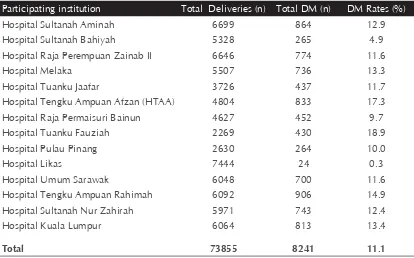
Table 5.1: Incidence of Diabetes in the Participating Hospitals, July-Dec 2009
Participating institution Total Deliveries (n) Total DM (n) DM Rates (%)
Hospital Sultanah Aminah 6699 864 12.9
Hospital Sultanah Bahiyah 5328 265 4.9
Hospital Raja Perempuan Zainab II 6646 774 11.6
Hospital Melaka 5507 736 13.3
Hospital Tuanku Jaafar 3726 437 11.7
Hospital Tengku Ampuan Afzan (HTAA) 4804 833 17.3
Hospital Raja Permaisuri Bainun 4627 452 9.7
Hospital Tuanku Fauziah 2269 430 18.9
Hospital Pulau Pinang 2630 264 10.0
Hospital Likas 7444 24 0.3
Hospital Umum Sarawak 6048 700 11.6
Hospital Tengku Ampuan Rahimah 6092 906 14.9
Hospital Sultanah Nur Zahirah 5971 743 12.4
Hospital Kuala Lumpur 6064 813 13.4
Total 73855 8241 11.1
From our data the highest incident of Diabetes in pregnancy was seen from Perlis, the smallest state in Malaysia at 18.9%.and this finding needs further analysis. Whilst Hospital Likas had the lowest number of cases at 0.3%.
Table 5.2: Distribution by type of Diabetes. July-December 2009
Type of diabetes n %
Pre Existing 486 6.0
GDM 6829 83.9
Missing 827 10.1
31
PRELIMINARY REPORT OF NATIONAL OBSTETRICS REGISTRY JULY-DECEMBER 2009
DIABETES MELLITUS IN PREGNANCY CHAPTER 5
Table 5.2 showed that 83.9% of patients had glucose intolerance which was first recognized during pregnancy and this is consistent with most studies. About 10.1% of the data was not entered and this was because when the CRF was first developed it was not a mandatory field to be captured.
5.3 Patient Demographic
The age incidence of diabetes in pregnancy is higher in the 40-50 years age group at 27.3% as compared to the age group 30-40 years which is at 15.5%. In the former, the distribution in the pre-existing and gestational group is at 2.3% and 24.1% respectively while in the latter group, the distribution in the pre-existing and gestational group is at 1.0% and 13.5% respectively.
Table 5.3: Distribution of Preexisting Diabetes Mellitus and GDM by age, July-December 2009 Age group
20-<30 154 0.4 2478 6.2 466 1.2 3098 39822 7.8
30-<40 265 1.0 3550 13.5 260 0.9 4075 26215 15.5
40-<50 59 2.3 687 24.1 32 1.1 778 2841 27.3
50-<55 0 0.0 2 14.2 0 0 2 14 14.3
<10 / ≥55 / Missing
1 0.3 22 5.80 13 3.4 36 379 9.5
Total 486 6829 827 8142 73095 11.1
This table above shows an increasing incidence of diabetes in pregnancy with advanced maternal age. Women marry late these days in the 3rd and 4th decade and hence postpone pregnancy until they have finished their tertiary education and embarking on a career. These women probably already have preexixting diabetes however glucose intolerance is only noticed for the first time during pregnancy.
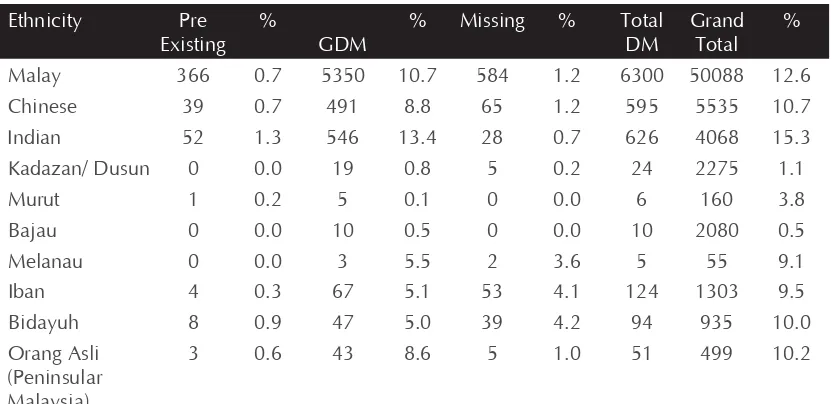
Table 5.4: Distribution for total deliveries with Diabetes Mellitus by ethnicity, July-December 2009
Malay 366 0.7 5350 10.7 584 1.2 6300 50088 12.6
Chinese 39 0.7 491 8.8 65 1.2 595 5535 10.7
Indian 52 1.3 546 13.4 28 0.7 626 4068 15.3
32
PRELIMINARY REPORT OF NATIONAL OBSTETRICS REGISTRY JULY-DECEMBER 2009CHAPTER 5 DIABETES MELLITUS IN PREGNANCY
Other
Total 486 6829 827 8142 7305 11.1
Diabetes in pregnancy was highest among the Indians at 15.3% followed by the Malays at 12.5% and the Chinese at 10.7%
In the National Health Morbidity Survey III (NHMS III) the prevalence of diabetics among Indians were higher and this may be due to the dietary habits among Indians. The incidence among the Chinese was lower and this may not be the true reflection of the incidence in the country as many deliver in private hospitals and the data is not captured. The Ibans have an incidence of 9.5% while the Bidayuhs are at 10.0%. The foreigners who delivered in the participating hospitals accounted for 5.2% of cases with Diabetes in pregnancy but this figures are probably inaccurate as many have not been diagnosed as they come late for booking or in labour.
Table 5.5: Distribution of total deliveries with diabetes mellitus by parity, July-December 2009 Parity Pre
Total 486 6829 827 8142 73095 11.1
From Table 5.5 Diabetes in pregnancy was 22.8% in grandmultipara and this is probably due to correlation between advancing maternal age and diabetes.
5.4 Complications and Outcomes
33
PRELIMINARY REPORT OF NATIONAL OBSTETRICS REGISTRY JULY-DECEMBER 2009
DIABETES MELLITUS IN PREGNANCY CHAPTER 5
Since more cases of stillbirth occurred in the gestational diabetes group there needs to be further evaluation to see if these cases were probably having preexisting diabetes mellitus as it is known that fetal outcome is poor in the diabetes group.
Vigilant antenatal care for optimal glycemic control is required in this group.
These patients will benefit from combined care with the endocrinologist to reduce morbidity and stillbirth rates.
Table 5.6: Distribution of Diabetes Mellitus by mode of delivery, July-December 2009 Pre Existing
Vaginal 274 0.6 4329 8.1 603 1.1 5206 53954 9.6
Instrumental 15 0.6 228 8.3 34 1.2 277 2746 10.1
Caesarean 202 1.2 2355 14.4 201 1.2 2758 16389 16.8
Total 491 0.7 6912 9.5 838 1.2 8241 73095 11.3
In the Diabetic group, 0.6% with pre existing diabetes delivered vaginally as compared to 8.1% from the gestational diabetes. Of those who delivered by caesarean section 1.2% are from the pre existing diabetes group as compared to 14.4% from the gestational diabetes group. The incidence of caesarean section was higher in patients with diabetes in pregnancy as compared to vaginal deliveries In Chapter 4 we see that caesarean section for macrosomia accounted for 5.4% of the total caesarean section done.
Only 3.4% patients with diabetes mellitus in pregnancy had babies weighing more than 4kg from our data and this is probably due to good glycemic control throughout the pregnancy.
NICE guidelines states that pregnant mothers with diabetes who have a normally grown fetus should be offered elective birth through induction of labour or by caesarean section if indicated after 38 completed weeks and hospitals under MOH follow this guidelines.
Table 5.7: Distribution of Diabetes mellitus by Gestation, July-December 2009
Gestation (weeks) Pre Existing % GDM % Missing % Total %
<26 0 0.0 3 0.0 3 0.4 6 0.1
Missing 349 71.8 4714 69.0 513 62.0 5576 68.5
Total 486 6.0 6829 83.9 827 10.2 8142 100.0
3
Table 5.8: Distribution of Diabetes Mellitus by birth weight, July-December 2009
Births weight group (grams) Pre Existing % GDM % Missing % Total DM % Total Delivery %
<1000 6 0.7 58 6.5 19 2.1 83 1.0 888 9.3
1000-<1500 8 1.0 65 7.7 13 1.6 86 1.0 840 10.2
1500-<2000 18 1.0 145 8.2 25 1.4 188 2.3 1761 10.6
2000-<2500 44 0.6 601 8.3 97 1.4 742 9.0 7202 10.3
2500-<3000 136 0.6 1982 8.3 281 1.2 2399 29.1 24021 10.0
3000-<3500 168 0.6 2621 9.3 296 1.1 3085 37.4 28134 11.0
3500-≤4000 88 0.9 1185 12.3 100 1.0 1373 16.7 9673 14.2
>4000 22 1.8 251 20.1 7 0.6 280 3.4 1252 22.4
Missing 1 1.2 4 4.8 0 0.0 5 0.1 84 6.0
Total 491 0.7 6912 9.4 838 1.1 8241 100.0 73855 11.2
3
Table 5.9: Correlating Apgar score to Diabetes in pregnancy, July-December 2009
Apgar score at 1 min Pre Existing % GDM % Missing % Total DM %
<7 16 0.8 221 10.3 32 1.5 269 3.3
≥7 468 0.7 6593 9.4 799 1.1 7860 96.1
Missing 1 0.2 48 8.3 2 0.4 51 0.6
TOTAL(Alive Births) 485 0.7 6862 9.4 833 1.1 8180 100
Apgar score at 5 min
Total (Alive Births) 485 0.7 6862 9.4 833 1.1 8180 100
3
Table 5.10: Risk and complications associated with diabetes in pregnancy, July-December 2009
Complications of pregnancy/delivery Pre Existing % GDM % Missing % Total %
Cord prolapse 1 0.2 16 0.2 4 0.5 21 0.3
Foetal distress 42 8.6 405 5.9 26 3.1 473 5.8
Maternal collapse 1 0.2 1 0.0 0 0.0 2 <0.0
Eclampsia 4 0.8 28 0.4 2 0.2 34 0.4
Pyrexia 2 0.4 8 0.1 0 0.0 10 0.1
Shoulder dystocia 2 0.4 20 0.3 1 0.1 23 0.3
Retained placenta 1 0.2 47 0.7 2 0.2 50 0.6
Prolonged Labour 8 1.7 89 1.3 13 1.6 110 1.4
Ruptured Membranes 8 1.7 85 1.2 11 1.3 104 1.3
Failed instrumentation 1 0.2 11 0.2 2 0.2 14 0.2
Placenta praevia 3 0.6 49 0.7 7 0.9 59 0.7
Abruptio placenta 0 0.0 18 0.3 3 0.4 21 0.3
Preterm labour 24 4.9 220 3.2 35 4.2 279 3.4
Uterine atony 1 0.2 11 0.2 0 0.0 12 0.2
Primary postpartum haemorrhage 4 0.8 76 1.1 6 0.7 86 1.1
Genital Tract trauma 9 1.9 149 2.2 4 0.5 162 2.0
Uterine scar dehiscence 0 0.0 4 0.1 1 0.1 5 0.1
Uterine rupture 0 0.0 2 <0.0 0 0.0 2 0.0
Deep vein thrombosis 0 0.0 1 <0.0 0 0.0 1 0.0
Pulmonary embolism 1 0.2 3 0.0 0 0.0 4 0.1
Indeterminate APH 1 0.2 4 0.1 1 0.1 6 0.1
Breech 1 0.2 4 0.1 1 0.1 6 0.1
Intrauterine death IUD 0 0.0 1 <0.0 0 0.0 1 <0.0
37
PRELIMINARY REPORT OF NATIONAL OBSTETRICS REGISTRY JULY-DECEMBER 2009
DIABETES MELLITUS IN PREGNANCY CHAPTER 5
Fetal distress was the commonest complication at 5.8% followed by genital tract trauma at 2.0% and shoulder dystocia at 0.3%.The complication rate is low in our data as when the CRF was first developed these entries were not mandatory.
5.5 Conclusion
The overall incidence of Diabetes in pregnancy is 11.1% from the data obtained from the 14 participating hospitals which is same as in NHMS III. The overall National incidence is about 10.1%. In Hospital Likas the incidence was only 0.3%. For a comprehensive analysis all fields in the CRF needs to be mandatory.
In the Malaysian women the incidence of Diabetes in pregnancy is highest in the 40-50 years age group at 27.3%. It was also found to be common in the Indian population at 15.3% followed by the Malays at 12.6%. and lowest among the indigenous group Bajau at 0.5%.Diabetes in pregnancy was seen more in grandmultipara, Para >10 and this is probably due to advanced maternal age in this group of patients. The overall C-section rates in diabetics were 16.8%. Of this about 5.4% patients had caesarean section for macrosomia. The commonest complication seen in this group of patients was fetal distress as compared to shoulder dystocia which was the least .Diabetes mellitus is a major cause of perinatal morbidity and mortality, as well as maternal morbidity and therefore early detection is vital. As seen in our data more stillbirth occurred in the gestational age group as compared to the diabetic group and this is probably due to late detection in patients that may be having preexisting diabetes.
5.6 Recommendation
1. Early detection of diabetes in women with risk factors for to reduce incidence of stillbirth and perinatal morbidity and mortality.
2. Women with diabetes mellitus should receive preconception counseling(1) as major fetal malformations is as a result of poor glycemic control before and during the early weeks of gestation.
3. Folic acid supplement should be given prior to conception to reduced neural tube defects.
5.7 References
39
PRELIMINARY REPORT OF NATIONAL OBSTETRICS REGISTRY JULY-DECEMBER 2009