SIXTH
REPORT OF THE
NATIONAL TRANSPLANT REGISTRY
2009
Editors
Hooi LS
Lela Yasmin Mansor
With contributions by:
October 2011
National Transplant Registry, Malaysia ISSN
Published by:
National Transplant Registry
Level 5, Menara Wisma Sejarah
230, Jalan Tun Razak
50400 Kuala Lumpur
Malaysia
Tel
: (603) 2681 5948
Fax
: (603) 2681 5949
e-mail : [email protected]
Website: http://www.mst.org.my
This report is copyrighted. However it may be freely reproduced without the
permission of the National Transplant Registry. Acknowledgement would be
appreciated.
Suggested citation of this report is as follows:
Hooi LS, Lela Yasmin Mansor (Eds). Sixth Report of the National Transplant Registry
Malaysia 2009. Kuala Lumpur 2011.
The electronic version of this report can be downloaded at:
http://www.mst.org.my/ntrSite
Disclaimer
There is a potential that data for previous years printed in this report are different from
what were printed in previous reports. This is because analysis for this report is based
Foreword
We, at The Malaysian Society of Transplantation, are both pleased and delighted to present the 6th National Transplant Registry Report which summarises the cumulative data related to organ donation & transplantation activities in Malaysia up to 31st December 2009. Though the data is collected, compiled and presented in a ‘retrospective’ manner, it nevertheless provides a useful means to monitor trends in organ donation and transplantation over the years. The information generated is highly relevant and essential to plan the future development of transplantation in this country.
The report includes chapters on kidney, liver, heart and lung transplantation, further chapters on cornea, bone, blood and marrow transplantation and a chapter on cadaveric organ & tissue donation. Each chapter outlines and presents epidemiological information, the types of immunosuppression and the outcomes for each of the different transplant modalities.
The National Transplant Registry Report is a product of the hard work, commitment and dedication of its editors, Dr Hooi Lai Seong & Datin (Dr) Fadhilah Zowyah Lela Yasmin Mansor, the members of the steering committee, the expert panels, the source data providers and the Registry coordinator, Ms Leong Wei Chee. Unfortunately Ms Leong will be resigning from the National Transplant Registry in December 2011 for personal reasons. Her resignation will bring to a close her remarkable career with the Registry for almost 8 years. The Registry wishes to acknowledge her enormous contribution to its success.
The editors have devoted much time and energies to the preparation of the report, and to ensure uniformity in the style of presentation of each of the organ / tissue specific reports. The expert panels, representing each area of clinical transplantation, completed their tasks with great precision and professionalism. I am indeed indebted to each and every individual who has contributed, in one way or another, towards the successful completion of the 6th NTR Report.
ii
The data in the registry is copyrighted, but may be used in scientific and/or research publications; in compliance with current national and international guidelines on research ethics and data handling including the ‘Vancouver Guidelines on Responsible Authorship’.
The 6th NTR Report is dedicated to the commitment of all individuals and source data providers throughout Malaysia. I wish to thank them all for their continued support and contributions to the successful release of this report. It would not have been possible to sustain the activities of the registry without the support of each and every individual including our corporate sponsors Roche & Janssen. We sincerely hope that you will find this report both informative and useful.
ACKNOWLEDGEMENTS
The National Transplant Registry would like to record its appreciation to everyone who have helped made this report possible.
We would especially like to thank the following:
x Our source data providers that are the transplant surgeons, physicians and staff
of all organ and tissue transplant centres and transplant follow up centres from the government, universities and private sectors, without whose commitment, hard work and timely data submission, there will be no report
x National Renal Registry for sharing the renal transplant data x Clinical Research Centre, Hospital Kuala Lumpur
x Ministry of Health, Malaysia
x The members of the various expert panels for their expertise and for devoting
their valuable time and effort in preparing and writing the various chapters
x Roche (M) Sdn. Bhd. and Janssen-Cilag for their support in providing
sponsorships
iv PARTICIPATING CENTRES
Discipline: Blood and Marrow Transplant
1. Ampang Puteri Specialist Hospital
2. Division of Haematology, Department of Medicine, University of Malaya Medical Centre 3. Haematology Department, Hospital Ampang
4. Haematology Department, Sime Darby Medical Centre Subang Jaya
5. Haemapoietic Stem Cell Transplant Unit, Hospital Universiti Sains Malaysia 6. Maybank BMT Centre, Universiti Kebangsaan Malaysia Medical Centre 7. Oncology-Haematology Department, Gleneagles Medical Centre, Penang 8. Oncology-Haematology Department, Lam Wah Ee Hospital
9. Paediatric BMT Unit, Department of Paediatrics, University of Malaya Medical Centre 10. Paediatric BMT Unit, Institute of Paediatrics, Hospital Kuala Lumpur
11. Paediatric BMT Unit, Sime Darby Medical Centre Subang Jaya
Discipline: Bone and Tissue Transplant
1. Bone Bank, Hospital Kuala Lumpur
2. Bone Bank, University of Malaya Medical Centre
3. Department of Orthopaedic & Traumatology, Hospital Kangar 4. Department of Orthopaedic Surgery, Hospital Sultanah Bahiyah 5. Department of Orthopaedic Surgery, Hospital Taiping
6. Department of Orthopaedic Surgery, University of Malaya Medical Centre 7. Department of Orthopaedics, Hospital Ipoh
8. Department of Orthopaedics, Hospital Kajang 9. Department of Orthopaedics, Hospital Kuantan 10. Department of Orthopaedics, Hospital Pulau Pinang
11. Department of Orthopaedics, Hospital Raja Perempuan Zainab II 12. Department of Orthopaedics, Hospital Seberang Jaya
13. Department of Orthopaedics, Hospital Sultanah Aminah 14. Department of Orthopaedics, Hospital Sultanah Nur Zahirah 15. Department of Orthopaedics, Hospital Tengku Ampuan Rahimah 16. Department of Orthopaedics, Hospital Universiti Sains Malaysia 17. Department of Orthopaedics, Sarawak General Hospital
18. Department of Orthopaedics, Sultanah Fatimah Specialist Hospital
19. Department of Orthopaedics, Traumatology and Rehabilitation, International Islamic University Malaysia
20. Department of Surgery, Hospital Raja Perempuan Zainab II 21. Hospital Fatimah, Ipoh
22. Institute of Orthopaedic & Traumatology, Hospital Kuala Lumpur 23. Island Hospital, Penang
24. Kota Bharu Medical Centre 25. Malaysian Nuclear Agency
26. National Tissue Bank, Universiti Sains Malaysia 27. Normah Medical Specialist Centre, Kuching
Discipline: Bone and Tissue Transplant
32. Ophthalmology Department, Hospital Tengku Ampuan Afzan 33. Ophthalmology Department, Hospital Tengku Ampuan Rahimah 34. Ophthalmology Department, Hospital Universiti Sains Malaysia 35. Ophthalmology Department, Sri Kota Medical Centre
36. Timberland Medical Centre, Kuching
37. Wan Orthopaedic, Trauma & Sports Injury Centre, Seremban Specialist Hospital
Discipline: Cornea Transplant
1. Eye Clinic, Mahkota Medical Centre
2. Hope Eye Centre, Gleneagles Intan Medical Centre, Kuala Lumpur 3. International Specialist Eye Centre, Kuala Lumpur
4. K.C. Yeo Eye Specialist Centre, Melaka
5. Ophthalmology Department, 94 Hospital Angkatan Tentera Kem Terendak 6. Ophthalmology Department, Gleneagles Medical Centre, Penang
7. Ophthalmology Department, Hospital Batu Pahat 8. Ophthalmology Department, Hospital Bukit Mertajam 9. Ophthalmology Department, Hospital Duchess of Kent 10. Ophthalmology Department, Hospital Ipoh
11. Ophthalmology Department, Hospital Kangar 12. Ophthalmology Department, Hospital Kuala Lipis 13. Ophthalmology Department, Hospital Kuala Lumpur 14. Ophthalmology Department, Hospital Kuala Pilah 15. Ophthalmology Department, Hospital Melaka 16. Ophthalmology Department, Hospital Mentakab 17. Ophthalmology Department, Hospital Miri
18. Ophthalmology Department, Hospital Pakar Sultanah Fatimah 19. Ophthalmology Department, Hospital Pantai Indah
20. Ophthalmology Department, Hospital Pulau Pinang 21. Ophthalmology Department, Hospital Putrajaya
22. Ophthalmology Department, Hospital Queen Elizabeth, Kota Kinabalu 23. Ophthalmology Department, Hospital Raja Perempuan Zainab II 24. Ophthalmology Department, Hospital Selayang
25. Ophthalmology Department, Hospital Sibu
26. Ophthalmology Department, Hospital Sultan Ismail Pandan 27. Ophthalmology Department, Hospital Sultanah Aminah 28. Ophthalmology Department, Hospital Sultanah Bahiyah 29. Ophthalmology Department, Hospital Sultanah Nur Zahirah 30. Ophthalmology Department, Hospital Sungai Buloh
31. Ophthalmology Department, Hospital Sungai Petani 32. Ophthalmology Department, Hospital Taiping 33. Ophthalmology Department, Hospital Tawau 34. Ophthalmology Department, Hospital Teluk Intan
35. Ophthalmology Department, Hospital Tengku Ampuan Afzan 36. Ophthalmology Department, Hospital Tengku Ampuan Rahimah 37. Ophthalmology Department, Hospital Tuanku Ja’afar
38. Ophthalmology Department, Hospital Umum Sarawak
vi Discipline: Cornea Transplant
41. Ophthalmology Department, Sri Kota Medical Centre
42. Ophthalmology Department, University of Malaya Medical Centre 43. Pusat Pakar Mata Centre For Sight, PJ
44. Puteri Specialist Hospital, Johor Bahru 45. Sunway Medical Centre
46. Tan Eye Specialist Centre, Sunway Medical Centre 47. Tun Hussein Onn National Eye Hospital
Discipline: Heart and Lung Transplant
1. Cardiothoracic Department, Institut Jantung Negara 2. Institut Perubatan Respiratori, Hospital Kuala Lumpur
Discipline: Heart Valve Transplant
1. Cardiovascular Tissue Bank, Department of Cardiothoracic Surgery, Institut Jantung Negara
Discipline: Liver Transplant
1. Department of Paediatrics, University of Malaya Medical Centre 2. Hepatobiliary Department, Hospital Selayang
3. Paediatric Hepatology Unit, Hospital Selayang 4. Institute of Paediatrics, Hospital Kuala Lumpur 5. Sime Darby Medical Centre Subang Jaya
Discipline: Renal Transplant
1. C. S. Loo Kidney & Medical Specialist Centre 2. Damai Medical & Heart Clinic
3. Fan Medical Renal Clinic 4. Kidney Unit, Assunta Hospital 5. Klinik Dr Choo & Liew
6. Nephrology Clinic (Renal Transplant), Hospital Kuala Lumpur
7. Nephrology Clinic (Renal Transplant), Hospital Kuala Lumpur (Paed) 8. Renal Transplant Clinic, Hospital Batu Pahat
9. Renal Transplant Clinic, Hospital Bintulu
10. Renal Transplant Clinic, Hospital Duchess of Kent 11. Renal Transplant Clinic, Hospital Dungun
Discipline: Renal Transplant
19. Renal Transplant Clinic, Hospital Pakar Sultanah Fatimah 20. Renal Transplant Clinic, Hospital Pantai Penang
21. Renal Transplant Clinic, Hospital Pontian 22. Renal Transplant Clinic, Hospital Pulau Pinang 23. Renal Transplant Clinic, Hospital Queen Elizabeth
24. Renal Transplant Clinic, Hospital Raja Perempuan Zainab II 25. Renal Transplant Clinic, Hospital Raja Permaisuri Bainun 26. Renal Transplant Clinic, Hospital Segamat
27. Renal Transplant Clinic, Hospital Selayang 28. Renal Transplant Clinic, Hospital Serdang 29. Renal Transplant Clinic, Hospital Sibu
30. Renal Transplant Clinic, Hospital Sultan Ismail 31. Renal Transplant Clinic, Hospital Sultanah Aminah 32. Renal Transplant Clinic, Hospital Sultanah Bahiyah 33. Renal Transplant Clinic, Hospital Sultanah Nur Zahirah 34. Renal Transplant Clinic, Hospital Taiping
35. Renal Transplant Clinic, Hospital Tawau
36. Renal Transplant Clinic, Hospital Tengku Ampuan Afzan 37. Renal Transplant Clinic, Hospital Tengku Ampuan Rahimah 38. Renal Transplant Clinic, Hospital Tuanku Ja’afar
39. Renal Transplant Clinic, KPJ Ampang Puteri Specialist Hospital 40. Renal Transplant Clinic, KPJ Selangor Specialist Hospital 41. Renal Transplant Clinic, Normah Medical Specialist Centre 42. Renal Transplant Clinic, Prince Court Medical Centre
43. Renal Transplant Clinic, Pusat Perubatan Universiti Kebangsaan Malaysia 44. Renal Transplant Clinic, Renal Care (Ipoh Specialist Hospital)
45. Renal Transplant Clinic, Sabah Medical Centre 46. Renal Transplant Clinic, Sarawak General Hospital 47. Renal Transplant Clinic, Selangor Medical Centre
48. Renal Transplant Clinic, Sime Darby Medical Centre Subang Jaya 49. Renal Transplant Clinic, Sri Kota Medical Centre
50. Renal Transplant Clinic, Sunway Medical Centre
51. Renal Transplant Clinic, Universiti Sains Malaysia Hospital 52. Renal Transplant Clinic, University Malaya Medical Centre
53. Renal Transplant Clinic (Paed), Ward 8C&D, Hospital Sultan Ismail 54. Simon Wong Medical & Kidney Clinic, Timberland Medical Centre 55. Smartcare Dialysis Centre, Subang Jaya
56. Tan Medical Renal Clinic
viii
ABOUT THE NATIONAL TRANSPLANT REGISTRY
The National Transplant Registry (NTR) is a Ministry of Health (MOH) supported registry whose aim is to collect information about organ and tissue transplantations in Malaysia. The information allows us to estimate the magnitude of transplant activity in the country. Such information besides being useful to transplantation practitioners, can be used in assisting the MOH, non-governmental organisations, private providers and industry in program planning and evaluation of transplantation services.
The objectives of NTR are to:
1. Determine the frequency and distribution of all types of transplantation activity in Malaysia.
2. Determine the outcomes of transplantation.
3. Determine the factors influencing outcomes of transplantation. 4. Evaluate transplantation services in the country.
5. Stimulate and facilitate research on transplantation and its management.
The NTR receives data on organ / tissue transplantation from 3 main sources:
1. The individual doctors who provide transplantation services, who voluntarily report data to the NTR. Data collection will be from seven main types of transplantation services:
x Blood and Marrow Transplant x Cornea Transplant
x Heart and Lung Transplant x Liver Transplant
x Renal Transplant x Heart Valve Transplant x Bone and Tissue Transplant
2. The National Vital Registration system (Jabatan Pendaftaran Negara). Their data is useful for determining or verifying mortality outcomes of transplant patients.
3. Information Documentation Unit of the MOH, which operates the Health Management Information System (HMIS).
NTR SPONSORS
x Medical Development Division, MOH
x National Transplant Coordinating Committee x Malaysian Society Of Transplantation
GOVERNANCE BOARD
The Governance Board is established to govern the NTR and the terms of reference are as follows:
1. Provide the necessary leadership and direction for the National Transplant Registry.
2. Ensure that the vision, objectives and goals of the National Transplant Registry are clearly established and that strategies are in place for achieving them.
3. Establish policies and procedures for the proper functioning of the National Transplant Registry.
4. Seek input and feedback from all stakeholders and end users with regards to their expectations and the performance of the National Transplant Registry. 5. Secure funding and financial support for the National Transplant Registry. 6. Galvanize the commitment of all interested parties to the National Transplant
Registry.
7. Receive and review the annual report from the steering committee.
Current members of the Governance Board are as follows:
Chairperson
Dato’ Dr Zaki Morad Mohd Zaher
Vice Chairperson
Datin Dr Fadhilah Zowyah Lela Yasmin Mansor
Members:
Datuk (Mr) Harjit Singh Malaysian Society of Transplantation Dr Teng Seng Chong Medical Development Division, Ministry of
Health
Tan Sri Dato’ Seri Dr Mohd. Ismail Merican Malaysian Liver Foundation Mr Rohan Malek Malaysian Urological Association Dr Hooi Lai Seong Malaysian Society of Nephrology Dr Aizai Azan Abdul Rahim National Heart Association of Malaysia Dr Suzina Sheikh Ab. Hamid Malaysian National Tissue Bank Dr Abdul Malik Hussein Malaysian Orthopaedic Association Dr Tan Chwee Choon National Kidney Foundation of Malaysia Dato’ Dr Chang Kian Meng Malaysian Society of Haematology Dato’ Dr M.Venugopal Balchand Malaysian Association of Thoracic &
Cardiovascular Surgeons
Dr Goh Pik Pin Clinical Research Centre, Hospital Kuala Lumpur & Malaysian Society of Ophthalmology
Dr Jamaiyah Haniff Clinical Research Centre, Hospital Kuala Lumpur
Secretariat:
x EXPERT PANEL
NTR has established seven groups of Expert Panel comprising members of the medical profession and allied health with expert knowledge in these various disciplines:
x Blood and Marrow Transplant x Cornea Transplant
x Heart and Lung Transplant x Liver Transplant
x Renal Transplant x Heart Valve Transplant x Bone and Tissue Transplant The role of the Expert Panel is:
1. To undertake quality control of the clinical registry form and the data dictionary as deemed necessary.
2. To undertake quality control of the reported data. 3. To undertake literature review on the relevant area. 4. To interpret the results generated by NTR’s statisticians.
5. To write the section of the NTR report relevant to the panel’s expertise. 6. To specify the data reporting procedure.
7. To facilitate access to source documents for Transplant Registry Unit (TRU) staff to do data verification.
List of Expert Panel members for each respective discipline:
Discipline: Blood and Marrow Transplant
Co-chairperson (Adult) Dr Alan Teh Kee Hean
Co-chairperson (Paeds) Prof Dr Chan Lee Lee
Members Prof Gan Gin Gin @ Gan Shiaw Sze
Dr Hishamshah Mohd Ibrahim
Prof Madya Dr S Fadilah Abdul Wahid Dr Ong Tee Chuan
Discipline: Cornea Transplant
Chairperson Dr Shamala Retnasabapathy
Members Prof Dato’ Dr Veera Ramani
Dr Choong Yean Yaw Dr Michael Law Sie Haur Dr Thiageswari Umapathy
Discipline: Heart and Lung Transplant
Chairperson Mr Mohamed Ezani Hj Md. Taib
Members Dato’ Dr David Chew Soon Ping
Dr Aizai Azan Abdul Rahim Dr Abdul Rais Sanusi Dr Ashari Yunus
Discipline: Liver Transplant
Chairperson Dr Ganesalingam A/L Kanagasabai
Members Dr Lim Kin Foong
Dr Haniza Omar Dr Lim Chooi Bee Prof Dr Lee Way Seah
Discipline: Renal Transplant
Chairperson Dr Goh Bak Leong
Members Dato’ Dr Zaki Morad Mohd Zaher
Dato’ Dr (Mr) Rohan Malek Dr Fan Kin Sing
Dr S Prasad Menon Dr Lily Mushahar Dr Lim Soo Kun
Discipline: Bone and Tissue Transplant
Chairperson Dr Suzina Sheikh Ab Hamid
Members Dr Abdul Malik Mohamed Hussein
Assoc Prof Dr Ahmad Hafiz Zulkifly Dr Thiageswari Umapathy
Dr Ewe Teong Wan Dr Norimah Yusof
Assoc Prof Dr Vivek Ajit Singh
Discipline: Cadaveric Organ and Tissue Donations
Chairperson Datin Dr Fadhilah Zowyah Lela Yasmin Mansor
Members Dr Hooi Lai Seong
Dr Omar Sulaiman
Dr Muhammed Anis Bin Abdul Wahab Matron Jamaliah Kario
CONTENTS
Foreword i
Acknowledgements iii
Participating Centres iv
About the National Transplant Registry viii
NTR Sponsors viii
Governance Board viii
Expert Panel x
Contents xii
Report Summary 1
Chapter 1: Blood and Marrow Transplantation 4
Chapter 2: Corneal Transplantation 40
Chapter 3: Heart and Lung Transplantation 64
Chapter 4: Liver Transplantation 78
Chapter 5: Renal Transplantation 93
Chapter 6: Heart Valve Transplantation 130
Chapter 7: Bone and Tissue Transplantation 141
Chapter 8: Cadaveric Organ and Tissue Donation 156
Appendix A: Data Management 178
Appendix B: Analysis Sets and Statistical Methods 182
Appendix C: Glossary 183
Appendix D: Directory of Participating Centres 186
REPORT SUMMARY
1. BLOOD AND MARROW TRANSPLANTATION
There were 213 new transplantations done in Malaysia in 2009 with 11 centres performing transplants.
The majority of all transplants were for malignant disorders and most of these are haematological malignancies like leukaemia (42%) and lymphoma (32%). The main non-malignant disorders transplanted were thalassaemia and aplastic anaemia (6% each).
Mean age of new transplant patients in 2009 was 31 + 18 years; 58% were male, 46% Malay, 37% Chinese, 7% Indian and 9% others. Autologous transplants accounted for 48%. Eighty-five percent of the transplant source was from peripheral blood stem cells and 95% were from Human Leukocyte Antigen (HLA) identical donors.
In 2009m 43 of the transplant recipients died. Underlying disease and infection were the commonest causes of death accounting for 63% and 28% respectively.
2. CORNEAL TRANSPLANTATION
There were 47 centres which provided cornea transplantation data.
Two hundred and nine new cornea transplantations were reported in Malaysia in 2009. Mean age of new transplant recipients in 2009 was 44 + 20 years. Of these, 63% were male. Twenty-nine percent of recipients were Malay, 33% were Chinese, 28% were Indian and 10% were other races.
The primary diagnoses for cornea transplantation recipients in 2009 were keratoconus (22%), microbial keratitis (22%), pseudophakic bullous keratopathy (13%), corneal perforation (9%) and corneal dystrophy (8%).
Sixty-six percent of recipients were legally blind before their transplant surgery.
In 2009, 62% of donated corneas were from the USA, 20% from local sources and 18% from Sri Lanka. The mean age of the donors was 56 + 16 years.
The commonest cornea transplantation surgery performed was penetrating keratoplasty (86%) i.e. transplantation of a full thickness cornea tissue. Graft survival at 1 year was 77%, 65% at 3 years.
3. HEART AND LUNG TRANSPLANTATION
The transplant patient survival rate was 59% and 42% at 1 year and 3 years respectively.
There were no lung transplants in 2009. At the end of the year there were 2 patients with lung transplants surviving with functioning graft (from a total of 4 done since 2005).
4. LIVER TRANSPLANTATION
There were a total of 109 liver transplantations reported to the Registry between 1993 and 2009; 62 grafts were functioning by the end of 2009.
There were 8 new liver transplantations done in Malaysia in 2009. There were 5 follow-up centres for liver transplant recipients in 2009.
Mean age of all transplant patients was 8.9 + 14 years (range 9 months to 74 years); 50% were male, 54% Chinese, 37% Malay, 7% Indian, 70% were for biliary atresia. Majority were living donor liver transplantations (72%).
At the time of transplantation the main immunosuppressive drugs used were tacrolimus (77%) and steroids (63%).
Transplant patient survival rate for the cohort 1993 to 1998 was 71% at 1 year; survival rate for the cohort 1999 to 2009 was 65% at 1 year.
5. RENAL TRANSPLANTATION
There were 57 follow-up centres for renal transplant recipients in 2009. There were 109 new renal transplants in 2009, 4 per million population per year.
The number of functioning renal transplants in 2009 was 1779. The transplant prevalence rate was 63 per million population.
In 2009, the mean age for new transplant recipients was 37+13 years, 60% were male, 12% had diabetes, 7% were anti-HCV positive at the time of transplantation.
Ninety-four percent of prevalent renal transplant recipients were on prednisolone, 64% on cyclosporine, 27% on tacrolimus, 60% mycophenolate mofetil and 22% on azathioprine.
In 2009, 39 (2%) of prevalent transplant recipients died and 34 (2%) lost their grafts. Infection, cardiovascular causes and died at home were the commonest causes of death accounting for 35%, 23% and 21% respectively. Cancers were the fourth commonest cause at 14%. Renal allograft rejection accounted for 68% of graft loss.
The overall transplant patient survival rate from 2000 to 2009 was 95%, 90%, 87% and 79% at 1 year, 3 years, 5 years and 10 years respectively, while the overall graft survival rate for these years was 92%, 86%, 80% and 68% respectively.
6. HEART VALVE TRANSPLANTATION
There were a total of 237 heart valve homografts reported to the Registry between 1996 and 2009; 200 grafts were functioning at the end of 2009. One hundred and six were aortic and 121 were pulmonary valves.
Mean age of all heart valve transplant patients was 10.2 + 10 years (range 1 month to 70 years); 50% were male, 64% Malay.
7. BONE AND TISSUE TRANSPLANTATION
In 2009, 42 bone allografts, 3 frozen tendons and 932 amniotic membranes were supplied by Tissue Bank, USM.
Eleven hospitals used the bone grafts and 1 centre used the amniotic membranes. Characteristics were reported for only 16 of the recipients.
8. CADAVERIC ORGAN AND TISSUE DONATION
There had been 143 referrals for donation with 39 donors in 2009, the highest recorded in Malaysia in a calendar year. This translated to a conversion rate of 27%. Eighteen were brain dead multi-organ and tissue donors and 21 were post cardiac death tissue donors. The donation rate was 1.38 donations per million population.
The mean age of the donors was 28.8 + 16.7 years, age range 25 days – 68 years of age. Sixty-seven percent were male, 66% were Chinese, 26% Indian, 8% Malay.
CHAPTER 1
BLOOD AND MARROW TRANSPLANTATION
Editors:
Dr Alan Teh Kee Hean Prof Dr Chan Lee Lee
Expert Panel
Dr Alan Teh Kee Hean (co-chairperson) Prof Dr Chan Lee Lee (co-chairperson)
Dr Gan Gin Gin
Dr Hishamshah Mohd Ibrahim Prof Dr S. Fadilah Abdul Wahid
Dr Ong Tee Chuan
Contents
1.0 Introduction
1.1 Stock and Flow of Blood and Marrow Transplantation
x Stock and Flow x Transplant Rates x Places of Transplant
1.2 Recipients’ Characteristics
x Demographics x Primary Diagnosis
1.3 Transplant Practices
x Graft Number x Type of Transplant
x Source of Transplantation and HLA Match
1.4 Transplant Outcomes
x Patient Survival
BLOOD AND MARROW TRANSPLANTATION
Sixth Report of the National Transplant Registry 2009
5 List of Tables
Table 1.1.1: Stock and Flow of Blood and Marrow Transplantation, 1987-2009 ...7
Table 1.1.2: New Transplant Rate per million population (pmp), 1987-2009 ...8
Table 1.1.3: Distribution of Patients by Transplant Centre, 1987-2009………9
Table 1.2.1: Distribution of Patients by Gender, 1987-2009...12
Table 1.2.2: Distribution of Patients by Ethnic Group, 1987-2009 ...14
Table 1.2.3: Distribution of Patients by Age Group, 1987-2009...16
Table 1.2.4: Distribution of Patients by Primary Diagnosis, 1987-2009...18
Table 1.3.1: Distribution of Patients by Graft Number, 1987-2009 ...20
Table 1.3.2: Distribution of Patients by Transplantation Type, 1987-2009 ...22
Table 1.3.3: Type of Transplant by Centre, 1987-2009...23
Table 1.3.4: Source of Stem Cells, 1987-2009 ...24
Table 1.3.5: Distribution of Patients by HLA Match, 1987-2009 ...26
Table 1.3.6: Distribution of Patients by Allogeneic Donor Relationship, 1987-2009.27 Table 1.4.1: Distribution of Patients by Cause of Death, 1987-2009 ...28
List of Figures Figure 1.1.1: Stock and Flow of Blood and Marrow Transplantation, 1987-2009...7
Figure 1.1.2: New Transplant Rate per million population (pmp), 1987-2009 ...8
Figure 1.1.3: Distribution of Patients by Transplant Centre, 1987-2009...11
Figure 1.2.1: Distribution of Patients by Gender, 1987-2009...13
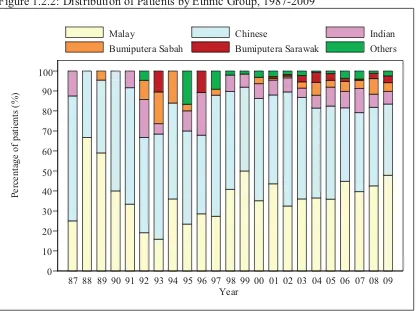
Figure 1.2.2: Distribution of Patients by Ethnic Group, 1987-2009...15
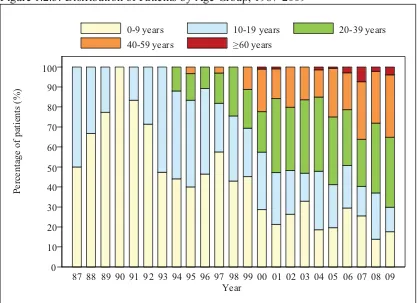
Figure 1.2.3: Distribution of Patients by Age Group, 1987-2009 ...17
Figure 1.3.1: Distribution of Patients by Graft Number, 1987-2009...21
Figure 1.3.2: Distribution of Patients by Transplantation Type, 1987-2009 ...22
Figure 1.3.3: Type of Transplant by Centre, 1987-2009 ...23
Figure 1.3.4: Source of Stem Cells, 1987-2009...25
Figure 1.4.1: Patient Survival by Year of Transplant, 1987-2009...30
Figure 1.4.2: Patient Survival by Gender, 1987-2009 ...30
Figure 1.4.3: Patient Survival by Age Group, 1987-2009 ...31
Figure 1.4.4: Patient Survival by Type of Transplant, 1987-2009 ...31
Figure 1.5.1: Disease-free Survival for Acute Myeloid Leukaemia, 1987-2009 (Allogeneic vs. Autologous) ...32
Figure 1.5.2: Disease-free Survival for Acute Lymphoblastic Leukaemia, 1987-2009 (Allogeneic) ...33
Figure 1.5.3: Disease-free Survival for Thalassaemia, 1987-2009 (Allogeneic) ...33
Figure 1.5.4: Disease-free Survival for Non-Hodgkin’s Lymphoma, 1987-2009 (Allogeneic vs. Autologous) ...34
Figure 1.5.5 Disease-free Survival for Hodgkin’s Disease, 1987-2009 (Autologous) 34 Figure 1.5.6: Disease-free Survival for Chronic Myeloid Leukaemia, 1987-2009 (Allogeneic) ...35
Figure 1.5.7: Disease-free Survival for Aplastic Anaemia, 1987-2009 (Allogeneic) .35 Figure 1.5.8: Disease-free Survival by Age Group for Acute Myeloid Leukaemia, ...36
Figure 1.5.9: Disease-free Survival by Age Group for Acute Lymphoblastic Leukaemia, 1987-2009 ...36
Figure 1.5.10: Disease-free Survival by Age Group for Thalassaemia, 1987-2009....37
Figure 1.5.11: Disease-free Survival by Age Group for Non-Hodgkin’s Lymphoma, 1987-2009 ...37
Sixth Report of the
National Transplant Registry 2009 BLOOD AND MARROW TRANSPLANTATION
6
Figure 1.5.13: Disease-free Survival by Age Group for Chronic Myeloid Leukaemia, 1987-2009 ...38 Figure 1.5.14: Disease-free Survival by Age Group for Aplastic Anaemia, 1987-2009
BLOOD AND MARROW TRANSPLANTATION
Sixth Report of the National Transplant Registry 2009
7 1.0 INTRODUCTION
Haematopoietic Stem Cell Transplantation (HSCT) activity in Malaysia continued to increase at a steady pace and for the first time exceeded 200 new transplants per year in 2009. Overall access to HSCT in the general population still remains low but has increased slightly to 8 per million population. This 6th annual report attempts to provide an accurate record of HSCT activity in 2009.
1.1 STOCK AND FLOW
In 2009 a total of 213 HSCTs were performed. The vast majority (87.7%) were performed in public/university hospitals, the single largest centre being Hospital Ampang which contributed to about 40% of transplants in 2009.
Table 1.1.1: Stock and Flow of Blood and Marrow Transplantation, 1987-2009
Year 1987 1988 1989 1990 1991 1992 1993 1994 1995 1996 1997
New transplant patients 8 6 22 5 12 21 19 25 30 28 33
Deaths 1 1 6 6 1 2 9 5 17 11 15
Lost to follow- up 0 0 0 0 0 0 0 0 0 0 0
Alive at 31stDecember 7 12 28 27 38 57 67 87 100 117 135
Year 1998 1999 2000 2001 2002 2003 2004 2005 2006 2007 2008 2009
New transplant patients 49 62 94 108 114 128 140 148 136 149 181 213
Deaths 17 16 31 47 34 56 52 63 42 50 70 43
Lost to follow- up 0 0 0 0 0 0 0 0 0 0 0 0
Alive at 31stDecember 167 213 276 337 417 489 577 662 756 855 966 1136
Figure 1.1.1: Stock and Flow of Blood and Marrow Transplantation, 1987-2009
0
Sixth Report of the
National Transplant Registry 2009 BLOOD AND MARROW TRANSPLANTATION
Table 1.1.2: New Transplant Rate per million population (pmp), 1987-2009
Year 1987 1988 1989 1990 1991 1992 1993 1994 1995 1996 1997
New transplant patients 8 6 22 5 12 21 19 25 30 28 33
New transplant rate pmp 1 0 1 0 1 1 1 1 1 1 2
Year 1998 1999 2000 2001 2002 2003 2004 2005 2006 2007 2008 2009
New transplant patients 49 62 94 108 114 128 140 148 136 149 181 213
New transplant rate pmp 2 3 4 5 5 5 5 6 5 5 7 8
Figure 1.1.2: New Transplant Rate per million population (pmp), 1987-2009
0 1 2 3 4 5 6 7
N
ew Tra
nplant
rate , pmp
87 88 89 90 91 92 93 94 95 96 97 98 99 00 01 02 03 04 05 06 07 08 09 Year
BLOOD AND MARROW TRANSPLANTATION
Sixth Report of the National Transplant Registry 2009
9
Table 1.1.3: Distribution of Patients by Transplant Centre, 1987-2009
1987 1988 1989 1990 1991 1992 1993
Year
Year 1994 1995 1996 1997 1998 1999 2000
No. % No. % No. % No. % No. % No. % No. %
Year 2001 2002 2003 2004 2005 2006 2007
Sixth Report of the
National Transplant Registry 2009 BLOOD AND MARROW TRANSPLANTATION
10
Year 2008 2009 Total No. % No. % No. %
KLA 0 0 0 0 223 13
KLP 29 16 26 12 291 17
UKM 24 13 19 9 147 8
SJA 25 14 24 11 221 13
UMA 17 9 19 9 192 11
UMP 16 9 17 8 364 21
GMC 1 1 1 0 12 1
LWE 0 0 0 0 10 1
SJP 4 2 0 0 44 3
HUSM 6 3 10 5 16 1
APSH 0 0 1 0 3 0
HA 57 31 86 40 195 11
HPP 2 1 10 5 12 1
Others 0 0 0 0 1 0
TOTAL 181 100 213 100 1731 100 *Others include Royal Perth Australia Hospital
KLA Hospital Kuala Lumpur, (Adult)
KLP Hospital Kuala Lumpur, Institute Paediatrics (Paed)
UKM Hospital Universiti Kebangsaan Malaysia
SJA Sime Darby Medical Centre, Subang Jaya (Adult)
UMA University of Malaya Medical Centre (Adult)
UMP University of Malaya Medical Centre (Paed)
GMC Gleneagles Medical Centre, Penang
LWE Lam Wah Ee Hospital, Penang
SJP Sime Darby Medical Centre, Subang Jaya (Paed)
HUSM Hospital Universiti Sains Malaysia
APSH Ampang Puteri Specialist Hospital
HA Hospital Ampang
BLOOD AND MARROW TRANSPLANTATION
Sixth Report of the National Transplant Registry 2009
11
Figure 1.1.3: Distribution of Patients by Transplant Centre, 1987-2009
0 20 40 60 80 100 120 140
N
umbe
r
of
pati
ents (
n
)
87 88 89 90 91 92 93 94 95 96 97 98 99 00 01 02 03 04 05 06 07 08 09 Year
KLA KLP UKM SJA UMA UMP GMC
LWE SJP HUSM APSH HA HPP Others
Sixth Report of the
National Transplant Registry 2009 BLOOD AND MARROW TRANSPLANTATION
12 1.2 RECIPIENTS’ CHARACTERISTICS
Out of the 213 HSCTs, there was a male preponderance, the male:female ratio being 58:42, which is similar to the cumulative gender ratio since 1987. The ethnic breakdown was 46%, 37%, 7%, 7% and 2% for Malay, Chinese, Indian, Bumiputra East Malaysians and Others respectively. The proportion of patients aged younger than 20 years transplanted was lower in 2009 compared with the previous year (29% vs. 37%). This is consistent with the trend to an increasing number of adults being transplanted over the years. The commonest indications for HSCT were acute leukaemia, lymphoma and hypoplastic anaemia. There has been a significant drop in the number of patients transplanted for chronic leukemia, probably reflecting the use of medical (TKI) therapy in this group of patients in preference to HSCT.
Table 1.2.1: Distribution of Patients by Gender, 1987-2009
Year 1987 1988 1989 1990 1991 1992 1993 1994 Gender No. % No. % No. % No. % No. % No. % No. % No. %
Male 7 88 4 67 12 55 3 60 7 58 13 62 13 68 16 64
Female 1 13 2 33 10 45 2 40 5 42 8 38 6 32 9 36
TOTAL 8 100 6 100 22 100 5 100 12 100 21 100 19 100 25 100
Year 1995 1996 1997 1998 1999 2000 2001 2002 Gender No. % No. % No. % No. % No. % No. % No. % No. %
Male 11 37 15 54 18 55 33 67 36 58 54 57 66 61 62 54
Female 19 63 13 46 15 45 16 33 26 42 40 43 42 39 52 46
TOTAL 30 100 28 100 33 100 49 100 62 100 94 100 108 100 114 100
Year 2003 2004 2005 2006 2007 2008 2009 Total Gender No. % No. % No. % No. % No. % No. % No. % No. %
Male 71 55 84 60 71 48 80 59 90 60 99 55 124 58 989 57
Female 57 45 56 40 77 52 56 41 59 40 82 45 89 42 742 43
BLOOD AND MARROW TRANSPLANTATION
Sixth Report of the National Transplant Registry 2009
13
Figure 1.2.1: Distribution of Patients by Gender, 1987-2009
0 10 20 30 40 50 60 70 80 90 100
Perce
ntage of patients
(%)
87 88 89 90 91 92 93 94 95 96 97 98 99 00 01 02 03 04 05 06 07 08 09 Year
Sixth Report of the
National Transplant Registry 2009 BLOOD AND MARROW TRANSPLANTATION
14
Table 1.2.2: Distribution of Patients by Ethnic Group, 1987-2009
Year 1987 1988 1989 1990 1991 1992 1993 1994 Race No. % No. % No. % No. % No. % No. % No. % No. %
Malay 2 25 4 67 13 59 2 40 4 33 4 19 3 16 9 36
Chinese 5 63 2 33 8 36 3 60 7 58 10 48 10 53 12 48
Indian 1 13 0 0 0 0 0 0 1 8 4 19 1 5 0 0
Bumiputra
Sabah 0 0 0 0 1 5 0 0 0 0 2 10 3 16 4 16
Bumiputra
Sarawak 0 0 0 0 0 0 0 0 0 0 0 0 2 10 0 0
Others 0 0 0 0 0 0 0 0 0 0 1 5 0 0 0 0
TOTAL 8 100 6 100 22 100 5 100 12 100 21 100 19 100 25 100
Year 1995 1996 1997 1998 1999 2000 2001 2002 Race No. % No. % No. % No. % No. % No. % No. % No. %
Malay 7 23 8 29 9 27 20 41 31 50 33 35 47 44 37 32
Chinese 14 47 11 39 20 61 24 49 26 42 48 51 48 44 65 57
Indian 3 10 6 21 0 0 4 8 4 6 7 7 8 7 8 7
Bumiputra
Sabah 1 3 0 0 1 3 0 0 0 0 3 3 1 1 1 1
Bumiputra
Sarawak 0 0 3 11 0 0 0 0 0 0 0 0 1 1 1 1
Others 5 17 0 0 3 9 1 2 1 2 3 3 3 3 2 2
TOTAL 30 100 28 100 33 100 49 100 62 100 94 100 108 100 114 100
Year 2003 2004 2005 2006 2007 2008 2009 Total Race No. % No. % No. % No. % No. % No. % No. % No. %
Malay 46 36 51 36 53 36 61 45 59 40 77 43 99 46 679 39
Chinese 65 51 63 45 69 47 50 37 59 40 71 39 79 37 769 44
Indian 6 5 9 6 14 9 11 8 18 12 12 7 14 7 131 8
Bumiputra
Sabah 4 3 9 6 5 3 7 5 6 4 14 8 9 4 71 4
Bumiputra
Sarawak 4 3 7 5 5 3 2 1 1 1 5 3 7 3 38 2
Others 3 2 1 1 2 1 5 4 6 4 2 1 5 2 43 2
BLOOD AND MARROW TRANSPLANTATION
Sixth Report of the National Transplant Registry 2009
15
Figure 1.2.2: Distribution of Patients by Ethnic Group, 1987-2009
0 10 20 30 40 50 60 70 80 90 100
Perce
ntage of patients
(%)
87 88 89 90 91 92 93 94 95 96 97 98 99 00 01 02 03 04 05 06 07 08 09 Year
Malay Chinese Indian
Sixth Report of the
National Transplant Registry 2009 BLOOD AND MARROW TRANSPLANTATION
16
Table 1.2.3: Distribution of Patients by Age Group, 1987-2009
Year 1987 1988 1989 1990 1991 1992 1993 1994 Age group No. % No. % No. % No. % No. % No. % No. % No. %
Year 1995 1996 1997 1998 1999 2000 2001 2002 Age group No. % No. % No. % No. % No. % No. % No. % No. %
Year 2003 2004 2005 2006 2007 2008 2009 Total Age group No. % No. %. No. % No. % No. % No. % No. % No. %
TOTAL 128 100 140 100 148 100 136 100 149 100 181 100 213 100 1731 100
Mean 22 23 26 24 29 28 31 23
SD 15 15 16 18 20 17 18 17
Median 23 20 24 19 28 25 28 19
Minimum 5 months 1 1 1 1 2 1 1 month
BLOOD AND MARROW TRANSPLANTATION
Sixth Report of the National Transplant Registry 2009
17
Figure 1.2.3: Distribution of Patients by Age Group, 1987-2009
0 10 20 30 40 50 60 70 80 90 100
Perce
ntage of patients
(%)
87 88 89 90 91 92 93 94 95 96 97 98 99 00 01 02 03 04 05 06 07 08 09 Year
Sixth Report of the
National Transplant Registry 2009 BLOOD AND MARROW TRANSPLANTATION
18
Table 1.2.4: Distribution of Patients by Primary Diagnosis, 1987-2009
Year 1987 1988 1989 1990 1991 1992 1993 1994 Diagnosis No. % No. % No. % No. % No. % No. % No. % No. %
Year 1995 1996 1997 1998 1999 2000 2001 2002
Diagnosis No. % No. % No. % No. % No. % No. % No. % No. %
Year 2003 2004 2005 2006 2007 2008 2009 Total
BLOOD AND MARROW TRANSPLANTATION
Sixth Report of the National Transplant Registry 2009
19
Diagnosis Categorisation
1 Acute leukaemia, unclassified 2 Acute undifferentiated leukaemia 3 Acute Lymphocytic Leukaemia (ALL)
4 Acute Myelogenous Leukaemia (AML) denovo 5 AML post-chemotherapy
6 AML post-MDS
Acute leukaemia
7 Chronic lymphocytic leukaemia
8 Chronic myeloid leukaemia Chronic leukaemia 9 Aplastic anaemia
10 Fanconi's anaemia Hypoplastic anaemia
11 Diamond-Blackfan anaemia
12 Congenital Dyserythropoeitic Anaemia (CDA) Erythrocytic Disorders 13 Hodgkin's lymphoma
14 Non-Hodgkin's lymphoma, Aggressive 15 Non-Hodgkin's lymphoma, Indolent
Lymphoma
16 Carcinoma, breast 17 Carcinoma, ovary
18 Germ Cell Tumour (GCT)-testicular 19 GCT-primary non-testis
20 Ewing's sarcoma 21 Glioma
22 Hepatoblastoma 23 Neuroblastoma 24 Rhabdomyosarcoma
25 Soft tissue sarcoma (non-RMS) 26 Wilms tumour
27 Primitive Neuroectodermal Tumour (NET)
Solid tumors
28 Juvenile Myelomonocytic leukaemia 29 Myelodyplastic syndrome (MDS) 30 Myelofibrosis
Myelodysplasia
31 Thalassaemia major
32 Sickle Cell Anaemia Haemoglobinopathy
33 Multiple myeloma Multiple myeloma
34 Haemophagocytic Lymphohistiocytosis Syndrome 35 Congenital Immunodeficiencies
36 Osteopetrosis 37 Others
Sixth Report of the
National Transplant Registry 2009 BLOOD AND MARROW TRANSPLANTATION
20 1.3 TRANSPLANT PRACTICES
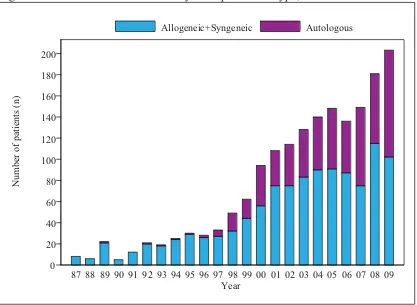
There was a jump in the number of autologous transplants seen in 2009, the allogeneic:autologous ratio declining from 64:36 in 2008 to 52:48 in 2009. The commonest stem cell source was peripheral blood stem cells (PBSC) which formed 85% of HSCT done. Bone marrow and cord blood stem cells contributed 11% and 4% to the total, respectively.
Of the 110 allogeneic HSCT performed in 2009, 104 (95%) were HLA-identical donors, the vast majority being sibling matched donors. The recourse to unrelated donors remains low at 10% in Malaysia compared with Japan, Singapore and Hong Kong where 40-60% of HSCT used unrelated donors.
Table 1.3.1: Distribution of Patients by Graft Number, 1987-2009
Year 1987 1988 1989 1990 1991 1992 1993 1994 Graft
number No. % No. % No. % No. % No. % No. % No. % No. %
1 8 100 6 100 19 86 4 80 9 75 19 91 18 95 24 96
2 0 0 0 0 2 9 1 20 3 25 2 10 1 5 1 4
3 0 0 0 0 1 5 0 0 0 0 0 0 0 0 0 0
TOTAL 8 100 6 100 22 100 5 100 12 100 21 100 19 100 25 100
Year 1995 1996 1997 1998 1999 2000 2001 2002 Graft
number No. % No. % No. % No. % No. % No. % No. % No. %
1 29 97 28 100 31 94 47 96 61 98 91 97 103 95 113 99
2 1 3 0 0 1 3 1 2 1 2 3 3 5 5 1 1
3 0 0 0 0 1 3 1 2 0 0 0 0 0 0 0 0
TOTAL 30 100 28 100 33 100 49 100 62 100 94 100 108 100 114 100
Year 2003 2004 2005 2006 2007 2008 2009 Total Graft
number No. % No. % No. % No. % No. % No. % No. % No. %
1 125 98 135 98 137 99 132 98 122 98 159 92 205 97 1625 97
2 3 2 3 2 2 1 2 2 2 2 13 8 6 3 54 3
3 0 0 0 0 0 0 1 1 0 0 0 0 0 0 4 0
BLOOD AND MARROW TRANSPLANTATION
Sixth Report of the National Transplant Registry 2009
21
Figure 1.3.1: Distribution of Patients by Graft Number, 1987-2009
0 10 20 30 40 50 60 70 80 90 100
Perce
ntage of patients
(%)
87 88 89 90 91 92 93 94 95 96 97 98 99 00 01 02 03 04 05 06 07 08 09 Year
Sixth Report of the
National Transplant Registry 2009 BLOOD AND MARROW TRANSPLANTATION
Table 1.3.2: Distribution of Patients by Transplantation Type, 1987-2009
Year 1987 1988 1989 1990 1991 1992 1993 1994 Type of
Year 1995 1996 1997 1998 1999 2000 2001 2002 Type of
Year 2003 2004 2005 2006 2007 2008 2009 Total Type of
Figure 1.3.2: Distribution of Patients by Transplantation Type, 1987-2009
BLOOD AND MARROW TRANSPLANTATION
Sixth Report of the National Transplant Registry 2009
23
Table 1.3.3: Type of Transplant by Centre, 1987-2009
Type of transplant Allogeneic + Syngeneic Autologous TOTAL
Centre No. % No. % No. %
TOTAL 1129 100 602 100 1731 100
Figure 1.3.3: Type of Transplant by Centre, 1987-2009
Sixth Report of the
National Transplant Registry 2009 BLOOD AND MARROW TRANSPLANTATION
24 Table 1.3.4: Source of Stem Cells, 1987-2009
Year 1987 1988 1989 1990 1991 1992 1993 1994
Transplant source No. % No. % No. % No. % No. % No. % No. % No. %
Marrow 8 100 6 100 22 100 5 100 12 100 21 100 19 100 25 100
PBSC / Marrow +
PBSC 0 0 0 0 0 0 0 0 0 0 0 0 0 0 0 0
Cord blood / Marrow +
cord 0 0 0 0 0 0 0 0 0 0 0 0 0 0 0 0
TOTAL 8 100 6 100 22 100 5 100 12 100 21 100 19 100 25 100
Year 1995 1996 1997 1998 1999 2000 2001 2002
Transplant source No. % No. % No. % No. % No. % No. % No. % No. %
Marrow 30 100 28 100 24 73 25 51 37 60 31 33 30 28 31 27
PBSC / Marrow +
PBSC 0 0 0 0 7 21 23 47 23 37 57 61 74 69 79 69
Cord blood / Marrow +
cord 0 0 0 0 2 6 1 2 2 3 6 6 4 4 4 4
TOTAL 30 100 28 100 33 100 49 100 62 100 94 100 108 100 114 100
Year 2003 2004 2005 2006 2007 2008 2009 Total
Transplant source No. % No. % No. % No. % No. % No. % No. % No. %
Marrow 44 34 30 21 25 17 17 13 23 15 20 11 23 11 536 31
PBSC / Marrow +
PBSC 79 62 101 72 116 78 109 80 119 80 152 84 181 85 1120 65
Cord blood / Marrow +
cord 5 4 9 6 7 5 10 7 7 5 9 5 9 4 75 4
BLOOD AND MARROW TRANSPLANTATION
Sixth Report of the National Transplant Registry 2009
25 Figure 1.3.4: Source of Stem Cells, 1987-2009
0 20 40 60 80 100 120 140 160 180 200
N
umbe
r
of
pati
ents (
n
)
87 88 89 90 91 92 93 94 95 96 97 98 99 00 01 02 03 04 05 06 07 08 09 Year
Sixth Report of the
National Transplant Registry 2009 BLOOD AND MARROW TRANSPLANTATION
26
Table 1.3.5: Distribution of Patients by HLA Match, 1987-2009
Year 1987 1988 1989 1990 1991
HLA Match No. % No. % No. % No. % No. %
Identical 8 100 6 100 21 100 5 100 12 100
1 AG 0 0 0 0 0 0 0 0 0 0
2 AG 0 0 0 0 0 0 0 0 0 0
3 AG Disparate 0 0 0 0 0 0 0 0 0 0
TOTAL 8 100 6 100 21 100 5 100 12 100
Year 1992 1993 1994 1995 1996
HLA Match No. % No. % No. % No. % No. %
Identical 20 100 18 100 23 96 29 100 26 100
1 AG 0 0 0 0 1 4 0 0 0 0
2 AG 0 0 0 0 0 0 0 0 0 0
3 AG Disparate 0 0 0 0 0 0 0 0 0 0
TOTAL 20 100 18 100 24 100 29 100 26 100
Year 1997 1998 1999 2000 2001
HLA Match No. % No. % No. % No. % No. %
Identical 25 93 31 97 40 91 52 93 69 92
1 AG 2 7 0 0 3 7 0 0 4 5
2 AG 0 0 1 3 1 2 4 7 1 1
3 AG Disparate 0 0 0 0 0 0 0 0 1 1
TOTAL 27 100 32 100 44 100 56 100 75 100
Year 2002 2003 2004 2005 2006
HLA Match No. % No. % No. % No. % No. %
Identical 70 93 78 94 83 92 86 95 81 93
1 AG 3 4 3 4 3 3 4 4 4 5
2 AG 2 3 2 2 4 4 1 1 2 2
3 AG Disparate 0 0 0 0 0 0 0 0 0 0
TOTAL 75 100 83 100 90 100 91 100 87 100
Year 2007 2008 2009 Total
HLA Match No. % No. % No. % No. %
Identical 68 91 102 89 104 95 1057 94
1 AG 4 5 7 6 2 2 40 4
2 AG 2 3 6 5 3 3 29 3
3 AG Disparate 1 1 0 0 1 1 3 0
BLOOD AND MARROW TRANSPLANTATION
Sixth Report of the National Transplant Registry 2009
27
Table 1.3.6: Distribution of Patients by Allogeneic Donor Relationship, 1987-2009
Year 1987 1988 1989 1990 1991
Allogeneic Donor Relationship No. % No. % No. % No. % No. %
Year 1992 1993 1994 1995 1996
Allogeneic Donor Relationship No. % No. % No. % No. % No. %
Year 1997 1998 1999 2000 2001
Allogeneic Donor Relationship No. % No. % No. % No. % No. %
Year 2002 2003 2004 2005 2006
Allogeneic Donor Relationship No. % No. % No. % No. % No. %
Year 2007 2008 2009 Total
Allogeneic Donor Relationship No. % No. % No. % No. %
Sixth Report of the
National Transplant Registry 2009 BLOOD AND MARROW TRANSPLANTATION
28 1.4 TRANSPLANT OUTCOMES
A total of 43 deaths were reported for the 213 HSCT in 2009 making the mortality rate 20%. Underlying disease contributed to 63% of these deaths followed by sepsis in 28% and graft-versus-host disease in 2%.
Paediatric patients had better survival rates as shown in Figure 1.4.3. The survival curve for the most recent transplants (Figure 1.4.1 1987-2009) compared with the previous decade is inferior most probably because of a higher proportion of older patients and poorer risk (e.g. more advanced disease) had access to HSCT and more complicated unrelated donor HSCT had been undertaken.
Table 1.4.1: Distribution of Patients by Cause of Death, 1987-2009
Year 1987 1988 1989 1990 1991
Cause of death No. % No. % No. % No. % No. %
Sepsis 1 100 0 0 0 0 0 0 1 100
GVHD 0 0 0 0 0 0 1 17 0 0
Underlying disease 0 0 0 0 6 100 5 83 0 0
Haemorrhage 0 0 1 100 0 0 0 0 0 0
VOD 0 0 0 0 0 0 0 0 0 0
Organ Failure 0 0 0 0 0 0 0 0 0 0
Interstitial pneumonitis 0 0 0 0 0 0 0 0 0 0
Secondary malignancy 0 0 0 0 0 0 0 0 0 0
Others 0 0 0 0 0 0 0 0 0 0
Unknown 0 0 0 0 0 0 0 0 0 0
TOTAL 1 100 1 100 6 100 6 100 1 100
Year 1992 1993 1994 1995 1996
Cause of death No. % No. % No. % No. % No. %
Sepsis 1 50 2 22 1 20 4 24 6 55
GVHD 0 0 0 0 0 0 4 24 0 0
Underlying disease 0 0 6 67 3 60 3 18 3 27
Haemorrhage 0 0 1 11 0 0 2 12 1 9
VOD 0 0 0 0 0 0 1 6 1 9
Organ Failure 1 50 0 0 1 20 2 12 0 0
Interstitial pneumonitis 0 0 0 0 0 0 0 0 0 0
Secondary malignancy 0 0 0 0 0 0 1 6 0 0
Others 0 0 0 0 0 0 0 0 0 0
Unknown 0 0 0 0 0 0 0 0 0 0
BLOOD AND MARROW TRANSPLANTATION
Sixth Report of the National Transplant Registry 2009
29
Year 1997 1998 1999 2000 2001
Cause of death No. % No. % No. % No. % No. %
Year 2002 2003 2004 2005 2006
Cause of death No. % No. % No. % No. % No. %
Year 2007 2008 2009 Total
Sixth Report of the
National Transplant Registry 2009 BLOOD AND MARROW TRANSPLANTATION
Figure 1.4.1: Patient Survival by Year of Transplant, 1987-2009
0.00 0.25 0.50 0.75 1.00
Cu
mu
lativ
e su
rv
iv
al
0 1 2 3 4 5 6 7 8 9 10 11 12 13 14 15 16 17 18 19 20 Duration in years
Year 1987-1992 Year 1993-1998 Year 1999-2009
Figure 1.4.2: Patient Survival by Gender, 1987-2009
0.00 0.25 0.50 0.75 1.00
Cu
mu
lativ
e su
rv
iv
al
0 1 2 3 4 5 6 7 8 9 10 11 12 13 14 15 16 17 18 19 20 Duration in years
Male Female
BLOOD AND MARROW TRANSPLANTATION
Sixth Report of the National Transplant Registry 2009
31
Figure 1.4.3: Patient Survival by Age Group, 1987-2009
0.00 0.25 0.50 0.75 1.00
Cu
mu
lativ
e su
rv
iv
al
0 1 2 3 4 5 6 7 8 9 10 11 12 13 14 15 16 17 18 19 20 Duration in years
0-9 years 10-19 years 20-39 years 40 years
Figure 1.4.4: Patient Survival by Type of Transplant, 1987-2009
0.00 0.25 0.50 0.75 1.00
Cu
mu
lativ
e su
rv
iv
al
0 1 2 3 4 5 6 7 8 9 10 11 12 13 14 15 16 17 18 19 20 Duration in years
Sixth Report of the
National Transplant Registry 2009 BLOOD AND MARROW TRANSPLANTATION
1.5 DISEASE-FREE SURVIVAL
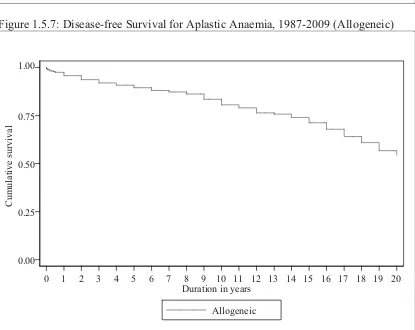
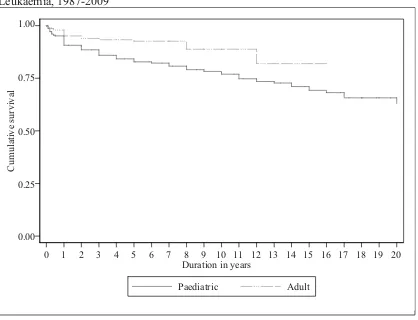
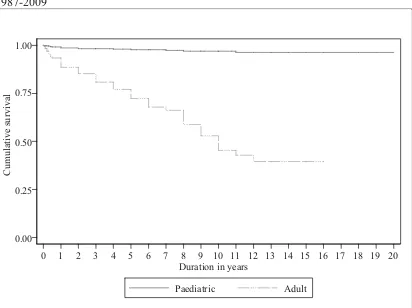
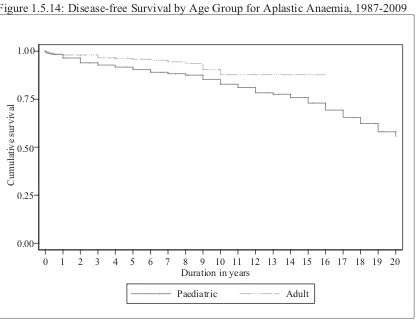
Figures 1.5.1 to 1.5.7 show the disease free survival for individual diseases while Figures 1.5.8 to 1.5.13 show the breakdown between paediatric and adult patients.
It is difficult to interpret the survival curves for individual diseases (e.g. allogeniec vs autologous in AML and NHL) without analyses according to stage of disease (CR1 vs CR2) and prognostic risk factors. Similarly it is difficult to interpret differences in survival curves between paediatric and adult DFS curves e.g. the unexpected better adult survival in ALL. The survival data could be better analysed in the future when there is more detailed information on disease characteristics (particularly prognostic sub-groups) of the transplanted patients.
Figure 1.5.1: Disease-free Survival for Acute Myeloid Leukaemia, 1987-2009 (Allogeneic vs. Autologous)
0.00 0.25 0.50 0.75 1.00
Cu
mu
lativ
e su
rv
iv
al
0 1 2 3 4 5 6 7 8 9 10 11 12 13 14 15 16 17 18 19 20 Duration in years
Allogeneic Autologous
BLOOD AND MARROW TRANSPLANTATION
Sixth Report of the National Transplant Registry 2009
33
Figure 1.5.2: Disease-free Survival for Acute Lymphoblastic Leukaemia, 1987-2009 (Allogeneic)
0.00 0.25 0.50 0.75 1.00
Cu
mu
lativ
e su
rv
iv
al
0 1 2 3 4 5 6 7 8 9 10 11 12 13 14 15 16 17 18 19 20 Duration in years
Allogeneic
Figure 1.5.3: Disease-free Survival for Thalassaemia, 1987-2009 (Allogeneic)
0.00 0.25 0.50 0.75 1.00
Cu
mu
lativ
e su
rv
iv
al
0 1 2 3 4 5 6 7 8 9 10 11 12 13 14 15 16 17 18 19 20 Duration in years
Sixth Report of the
National Transplant Registry 2009 BLOOD AND MARROW TRANSPLANTATION
Figure 1.5.4: Disease-free Survival for Non-Hodgkin’s Lymphoma, 1987-2009 (Allogeneic vs. Autologous)
0.00 0.25 0.50 0.75 1.00
Cu
mu
lativ
e su
rv
iv
al
0 1 2 3 4 5 6 7 8 9 10 11 12 13 14 15 16 17 18 19 20 Duration in years
Allogeneic Autologous
Figure 1.5.5 Disease-free Survival for Hodgkin’s Disease, 1987-2009 (Autologous)
0.00 0.25 0.50 0.75 1.00
Cu
mu
lativ
e su
rv
iv
al
0 1 2 3 4 5 6 7 8 9 10 11 12 13 14 15 16 17 18 19 20 Duration in years
Autologous
BLOOD AND MARROW TRANSPLANTATION
Sixth Report of the National Transplant Registry 2009
35
Figure 1.5.6: Disease-free Survival for Chronic Myeloid Leukaemia, 1987-2009 (Allogeneic)
0.00 0.25 0.50 0.75 1.00
Cu
mu
lativ
e su
rv
iv
al
0 1 2 3 4 5 6 7 8 9 10 11 12 13 14 15 16 17 18 19 20 Duration in years
Allogeneic
Figure 1.5.7: Disease-free Survival for Aplastic Anaemia, 1987-2009 (Allogeneic)
0.00 0.25 0.50 0.75 1.00
Cu
mu
lativ
e su
rv
iv
al
0 1 2 3 4 5 6 7 8 9 10 11 12 13 14 15 16 17 18 19 20 Duration in years
Sixth Report of the
National Transplant Registry 2009 BLOOD AND MARROW TRANSPLANTATION
Figure 1.5.8: Disease-free Survival by Age Group for Acute Myeloid Leukaemia, 1987-2009
0.00 0.25 0.50 0.75 1.00
Cu
mu
lativ
e su
rv
iv
al
0 1 2 3 4 5 6 7 8 9 10 11 12 13 14 15 16 17 18 19 20 Duration in years
Paediatric Adult Paediatric is defined as age d18 years and adult age >18 years
Figure 1.5.9: Disease-free Survival by Age Group for Acute Lymphoblastic Leukaemia, 1987-2009
0.00 0.25 0.50 0.75 1.00
Cu
mu
lativ
e su
rv
iv
al
0 1 2 3 4 5 6 7 8 9 10 11 12 13 14 15 16 17 18 19 20 Duration in years
Paediatric Adult
BLOOD AND MARROW TRANSPLANTATION
Sixth Report of the National Transplant Registry 2009
37
Pediatric is defined as age d18 years and adult age >18 years Pediatric is defined as age d18 years and adult age >18 years
Figure 1.5.10: Disease-free Survival by Age Group for Thalassaemia, 1987-2009
0.00 0.25 0.50 0.75 1.00
Cu
mu
lativ
e su
rv
iv
al
0 1 2 3 4 5 6 7 8 9 10 11 12 13 14 15 16 17 18 19 20 Duration in years
*No adult cases reported for Thalassaemia
Figure 1.5.11: Disease-free Survival by Age Group for Non-Hodgkin’s Lymphoma, 1987-2009
0.00 0.25 0.50 0.75 1.00
Cu
mu
lativ
e su
rv
iv
al
0 1 2 3 4 5 6 7 8 9 10 11 12 13 14 15 16 17 18 19 20 Duration in years
Sixth Report of the
National Transplant Registry 2009 BLOOD AND MARROW TRANSPLANTATION
38
igure 1.5.12: Disease-free Survival by Age Group for Hodgkin’s Disease, 1987-2009
igure 1.5.13: Disease-free Survival by Age Group for Chronic Myeloid Leukaemia, F
Paediatric is defined as age d18 years and adult age >18 years
F
1987-2009
0.00 0.25 0.50 0.75 1.00
Cu
mu
lativ
e su
rv
iv
al
0 1 2 3 4 5 6 7 8 9 10 11 12 13 14 15 16 17 18 19 20 Duration in years
Paediatric Adult 0.00
0.25 0.50 0.75 1.00
Cu
mu
lativ
e su
rv
iv
al
0 1 2 3 4 5 6 7 8 9 10 11 12 13 14 15 16 17 18 19 20 Duration in years
BLOOD AND MARROW TRANSPLANTATION
Sixth Report of the National Transplant Registry 2009
39
Figure 1.5.14: Disease-free Survival by Age Group for Aplastic Anaemia, 1987-2009
Pediatric is defined as age d18 years and adult age >18 years
0.00 0.25 0.50 0.75 1.00
Cu
mu
lativ
e su
rv
iv
al
0 1 2 3 4 5 6 7 8 9 10 11 12 13 14 15 16 17 18 19 20 Duration in years
CHAPTER 2
CORNEAL TRANSPLANTATION
Editors:
Dr Shamala Retnasabapathy Dr Chandramalar Santhirathelagan
Expert Panel:
Dr Shamala Retnasabapathy (Chairperson) Dr Chandramalar Santhirathelagan
Dr Choong Yean Yaw Dr Michael Law Sie Haur Prof Dato’ Dr Veera Ramani
Dr Thiageswari Umapathy Assoc Prof Dr Mohtar Ibrahim
Contents
2.0 Introduction
2.1 Corneal Transplant Activities and Trends 1998-2009
x Transplant Rates x Type of Transplant
2.2 Recipients’ Characteristics 1998-2009
x Demographics x Primary Diagnosis
2.3 Transplant Practices 2004 - 2009
x Recipient Details x Donor Details x Transplant Practices
2.4 Corneal Transplant Outcome 2004-2009
x Outcome - Graft Survival x Outome – Vision
Sixth Report of the National Transplant Registry 2009
CORNEAL TRANSPLANTATION
List of Tables
Table 2.1.1: Number of Corneal Transplantation and Transplant Rate per million population (pmp), 1998-2009 ... 4 Table 2.1.2: Types of Corneal Transplant, 1998-2009... 4 Table 2.2.1: Gender Distribution, 1998-2009 ... 5 Table 2.2.2: Ethnic Distribution, 1998-2009... 5 Table 2.2.3: Age Distribution of Corneal Transplant Recipient Patients, 1998-2009 ... 6 Table 2.2.4: Diagnosis, 1998-2009 ... 7 Table 2.2.5: Indications of Corneal Transplant, 2004-2009... 8 Table 2.3.1.1: No of Previous Grafts in Grafted Eye, 2004-2009... 9 Table 2.3.1.2: Ocular Co-morbidity, 2004-2009... 9 Table 2.3.1.3: Pre-operative Vision, 2004-2009 ... 10 Table 2.3.2.1: Source of Donor Cornea Tissue, 2004-2009... 11 Table 2.3.2.2: Donor Age Distribution, 2004-2009 ... 12 Table 2.3.2.3: Preservation Media, 2004-2009 ... 12 Table 2.3.2.4: Cause of Death in Corneal Donors, 2004-2009 ... 13 Table 2.3.3.1: Types of Surgeries, 2004-2009 ... 13 Table 2.3.3.2: Types of Combined Surgeries, 2004-2009... 13 Table 2.3.3.3: Recipient Cornea Trephine Size, 2004-2009 ... 14 Table 2.3.3.4: Difference in Trephined Sizes of Recipient and Donor Corneas, 2004-2009.... 15 Table 2.3.3.5: Suture Technique, 2004-2009 ... 15 Table 2.4.1: Stock and Flow - Graft Status (Whole Database) ... 16 Table 2.4.2.1: Graft Survival, 2004-2009... 17 Table 2.4.2.2: Graft Survival by Optical and Non-optical Indication, 2004-2009... 18 Table 2.4.2.3 Graft Success by Gender, 2004-2009... 19 Table 2.4.2.4 Graft Survival by Age, 2004-2009 ... 20 Table 2.4.2.5: Causes of Graft Failure ... 21 Table 2.4.3.1: Availability of Data on Post Corneal Transplant Unaided Vision ... 22 Table 2.4.3.2 Unaided Visual Outcome After Cornea Transplant Surgery... 22 Table 2.4.3.3 Unaided Vision for Optical and Non Optical Cases ... 23 Table 2.5.1: Post Transplant Complications ... 24 Table 2.5.2: Post Transplant Graft Rejection Types ... 24
List of Figures
Figure 2.3.2.1: Source of Donor Corneal Tissue, 2004-2009 ... 11
Figure 2.3.2.3: Preservation Media, 2004-2009 ... 12
Figure 2.4.2.1: Graft Survival, 2004-2009 ... 17
Figure 2.4.2.2: Graft Survival by Optical and Non-optical Indication, 2004-2009 ... 18
Figure 2.4.2.3 Graft Success by Gender, 2004-2009 ... 19
Figure 2.4.2.4 Graft Survival by Age, 2004-2009... 20
Figure 2.4.3.2 Unaided Visual Outcome After Corneal Transplant Surgery ... 22