www.elsevier.com / locate / bres
Research report
Is there an optimal age for recovery from motor cortex lesions?
I. Behavioral and anatomical sequelae of bilateral motor cortex lesions
in rats on postnatal days 1, 10, and in adulthood
a ,
*
a,b aBryan Kolb
, Jan Cioe
, Ian Q. Whishaw
a
Department of Psychology and Neuroscience, University of Lethbridge, Lethbridge, AB T1K 3M4, Canada
b
Okanagan University College, Kelowna, BC V1V 1V7, Canada
Accepted 8 August 2000
Abstract
Rats were given bilateral lesions of the motor cortex on the day of birth (P1), tenth day of life (P10), or in adulthood. They were trained on several motor tasks (skilled forelimb reaching, beam traversing, tongue extension), general motor activity, and a test of spatial learning (Morris water task). Although all lesion groups were impaired at skilled reaching, the P10 group was less impaired than either of the other two lesion groups. Furthermore, on the other motor tests the P10 group did not differ from controls whereas both P1 and adult groups were impaired. Only the P1 lesion group was impaired at the acquisition of the Morris water task. Anatomical analyses revealed that the P1 and P10 rats had smaller brains than the other two groups as well as having a generalized decrease in cortical thickness. Dendritic analysis of layer III pyramidal cells in the parietal cortex revealed a decrease in apical arbor in the lesion groups and an increase in the basilar arbor of the P1 and adult lesion animals. The P1 and adult operated groups showed an increase in spine density in the basilar dendrites of layer V pyramidal cells. Finally, analysis of the pattern of corticospinal projections revealed that the P1 animals had a markedly wider field of corticospinal projection neurons than any of the other groups. The widespread anatomical changes in all lesion groups versus the relatively better behavioral recovery after P10 lesions suggests that day 10 represents an optimal period for adapting to brain damage and subsequent brain reorganization. 2000 Elsevier Science B.V. All rights reserved.
Theme: Neural basis of behavior
Topic: Neural plasticity
Keywords: Recovery of function; Motor cortex; Corticospinal
1. Introduction [2,3,7,8,17,33]). The better functional outcome in the neonatal group is correlated with an augmentation of the This study is one of a series examining the behavioral ipsilateral corticospinal pathway from the normal hemi-and anatomical effects of neonatal decortication, sphere. The questions we asked here was whether there hemidecortication, or restricted lesions in rats of different were changes in the corticospinal connectivity after bilater-ages (for reviews, see Refs. [11,20]). The present study al lesions and whether there was an age-dependent differ-compared the effects of bilateral removal of motor cortex ence in recovery after bilateral motor cortex lesions. It was in neonatal, infant, and adult rats on a broad range of our expectation that if there were changes in connectivity behavioral and anatomical measures. It has been shown within the lesion hemispheres, then this might produce that rats with unilateral motor cortex lesions on the first what Teuber [28] referred to as crowding. That is, there few days after birth have better skilled forelimb reaching would be an interference with the control of other be-movements than adults with similar lesions (e.g., Refs. haviors not normally affected by lesions of the motor cortex. We therefore chose a broad battery of behavioral tasks that included tests sensitive to motor cortex injury in
*Corresponding author. Tel.: 11-403-3292-405; fax: 1
1-403-3292-adulthood (skilled forelimb reaching; beam traversing;
555.
E-mail address: [email protected] (B. Kolb). tongue extension; see Refs. [18,31]) as well as tests that
we knew were unaffected by motor cortex lesions in relative to bregma. After retraction of the dura, the adulthood (general activity, spatial learning) but that were neocortex exposed was removed by aspiration. This in-extremely sensitive to the effects of cortical lesions early cluded Zilles’ [39] areas Fr1, the lateral part of Fr2, the in life (for a review, see Ref. [20]). posterior part of Fr3, and FL. Following hemostasis the In the current study we chose to compare the effects of scalp wound was closed with wound clips. Control animals bilateral lesions on postnatal day 1 to those of animals with were anesthetized, the skin incised, and closed with wound lesions on postnatal day 10 or in adulthood. The ana- clips.
tomical analysis in our previous studies of rats with The neonatal animals were anesthetized by cooling them neonatal motor cortex lesions was limited to an inves- in a Thermatron cooling chamber until their rectal body tigation of cortical thickness and corticospinal connectivi- temperatures were in the range of 18–208C. The bone over ty. In this study we expanded our analysis to look at the the motor neocortex area was removed with iris scissors, changes in dendritic morphology in the parietal cortex and motor decortication was achieved as in the adult rats. adjacent to the lesions. We chose to measure pyramidal We have shown previously that on postnatal day 1, the neurons in area Par1 for several reasons. Brains with frontal cortex lies more anterior relative to bregma than it lesions on the first few postnatal days show considerable does in adulthood, but that the relation between the distortion in cortical architecture and, particularly in Golgi- bregmoidal junction and the underlying cortex is constant stained sections it is difficult to distinguish frontal cortical after about postnatal day 5 [10]. Thus, the lesion coordi-regions. Neurons in Par1 are much easier to identify nates were adjusted accordingly. On day 1 the lesion was reliably, thus ensuring that we are measuring comparable made from about11.5 to 21 whereas on day 10 it was neurons in the different groups. Furthermore, in previous made from about 12 to 22, relative to the bregmoidal studies we had found large changes in these neurons after junction. The scalp wound was sutured with silk thread as midline frontal lesions in both infant and adult rats (e.g., soon as the operation was complete. The normal control Refs. [12,14,15]). Finally, because preliminary results had animals were anesthetized, the skin incised, and then shown us that there was an expansion of the corticospinal closed with silk suture. The control animals were litter-projection neurons into the parietal cortex of rats with P1 mates of the operated animals. Behavioral training began motor cortex lesions, we anticipated that there might be about 3 months after surgery.
differences in the cell morphology in the parietal cortex of
the P1 animals. 2.3. Retrograde dyes
At the completion of the behavioral tests, 14 rats (four 2. Materials and methods control, three P1, three P10, four adult) were anesthetized with sodium pentobarbital and placed in a stereotaxic 2.1. Subjects apparatus. By blunt dissection, an aperture to the spinal cord was made through the neck, the spinal cord was This study used 42 rats, derived from the Charles River exposed at the cervical enlargement, and the rats were Long-Evans strains, which were divided into four groups: given two 1-ml injections of a 5% solution of True Blue at control (six M, 11 F), and bilateral motor cortex lesions approximately C8-T1. The injections were made unilateral-performed at postnatal day 1 (P1; four M, six F), postnatal ly into the gray matter. The rats were killed 14 days after day 10 (P10; four M, three F), and at adulthood (Ad; five the True Blue injections. They were deeply anesthetized M, five F). Half of the control animals were age-matched and intracardially perfused with a solution of 0.9% saline with the infant operates, the other half being age-matched and 10% formalin. The brains were removed and weighed, with the adult operates. The animals were group housed and then placed into a 30% sucrose formalin solution for with same sex littermates in stainless steel hanging cages 48 h before being cut frozen at 40 mm. Every tenth and on a 12:12 h light–dark schedule throughout the experi- eleventh section was mounted to make two complete sets ments. The animals were on ad lib food throughout except of sections through the entire brain. One section was kept during the food reaching task. Animals were cared for for fluorescence microscopy and one set was stained with under the rules and provisions of the Canadian Council on Cresyl Violet.
Animal Care.
2.4. Anatomical methods 2.2. Surgical procedures
solution for 2 days and cut on a vibratome at 200mm and thetically that although early cortical lesions do alter developed using a procedure described by Gibb and Kolb cortical thickness, the general pattern of cortical cyto-[6]. Layer III and layer V pyramidal cells in Zilles’ [30] architecture is largely maintained in the Golgi-stained area Par1 were traced using a camera lucida drawing tube, sections. Thus, we are confident that we are measuring the magnified at 2503, that was attached to the microscope. same tissue in the animals with early lesions as those with Both the basilar and apical fields were drawn for layer III the later lesions.
but because many of the apical dendrites were incomplete
for the layer V cells, only the basilar dendrites were drawn. 2.5. Behavioral methods In order to be included in the data analysis, the dendritic
trees of pyramidal cells had to fulfill the following criteria: The behavioral tests for this experiment included a (a) the cell had to be well impregnated and not obscured measure of forepaw use, hindlimb placing, tongue exten-with blood vessels, astrocytes, or heavy clusters of de- sion, locomotor activity and spatial navigation (i.e., Morris ndrites from other cells; and (b) the dendritic branching water task). Behavioral training began about 3 months after had to appear to be largely intact and visible in the plane surgery.
of section. The cells were analyzed by using the concentric ring procedure of Sholl [26]. The number of intersections
2.5.1. Forelimb reaching task of dendrites with a series of concentric spheres at 20-mm
Forepaw use was measured with a procedure that was intervals from the center of the cell body was counted for
adapted from the method devised by Whishaw et al. [36]. each cell. Statistical analyses were performed by averaging
Each animal was food-deprived to 85% body weight for across all cells per hemisphere. An estimate of mean total
the training and testing. The animals were placed in the dendritic length (in mm) can be made by multiplying the
test cages (10318310 cm high) with floors and fronts mean total number of intersections by 20.
constructed of 2-mm bars, 9 mm apart edge to edge. A Cells were chosen by locating area Par1 and every cell
4-cm wide and 5-cm deep tray, containing chicken feed meeting the criteria above was then drawn until there were
pellets, was mounted in the front of each box. The rats 10 drawn for each area per hemisphere. Statistical analyses
were required to extend a forelimb through the gap in the were performed by averaging across all cells per
hemi-bars, grasp and retract the food. The tray was mounted on sphere. Spine density was measured on the layer V neurons
runners and was retracted 0.5 cm from the cage so that the only. A terminal tip segment and a secondary basilar
rats could not scrape the food into the cage. If the animal branch were measured. A terminal tip was the distal 40mm
attempted to rake the pellet out of the tray, the pellet would of a third order branch. A secondary branch was a 40 mm
fall irretrievably through the gap. An attempt was scored segment beginning with the proximal stump of the
sec-only when the rat reached into the tray and touched the ondary branch. Spine-density measures were made from a
food. If it reached into the tray without touching a pellet, segment greater than 10 mm in length, and usually about
no attempt was scored. Animals were trained for 20–30 40mm in length. The dendrite was traced at 10003using a
min per day for a minimum of 10 days, by which time camera lucida drawing tube, and the exact length of the
their performance had reached asymptote [27,37]. Once dendritic segment was calculated. Spine density was
trained, the rats received a 5-min reaching test with each expressed as the number of spines per 10mm. Because we
paw during which time they were videotaped and then did not attempt to correct for spines hidden beneath or
scored later. In order to try to control for training effects above the dendritic segment, the spine-density values
on the brain, all animals continued to practice reaching for likely underestimated the actual density of the dendritic
about 4 months. Some of this training was concurrent with spines. As for the dendritic drawing, the cytologist was
training on the other behavioral measures. blind to the group assignment of individual rats.
Cortical thickness was measured by projecting the
Golgi-Cox stained sections on a Zeiss DL 2 POL petro- 2.5.2. Beam walking
animal’s hindfoot was placed over the edge of the runway hoc evaluations. Sex differences were assessed for each or if it slipped off the edge of the runway. measure using a two-way ANOVA but were only signifi-cant for brain and body weights, and are thus reported 2.5.3. Tongue extension separately for these measures. There were no differences in Each rat was tested to see how far it could extend its the performance of the infant control animals, who began tongue beyond the wire mesh front of its home cage [34]. behavioral training about 100 days of age, and the adult The last 2 cm of a clear plastic millimeter ruler was control animals, who began training at about 200 days of smeared with a slurry of chocolate-chip cookies and water age. The two control groups therefore were combined for and placed against the wire of the cage. The rats, which all statistical analyses.
had been previously exposed to the food, licked the ruler through the wire bars of the cage front, and the area
cleared of cookie mixture on the ruler indicated how far 3. Anatomical results the rat could extend its tongue.
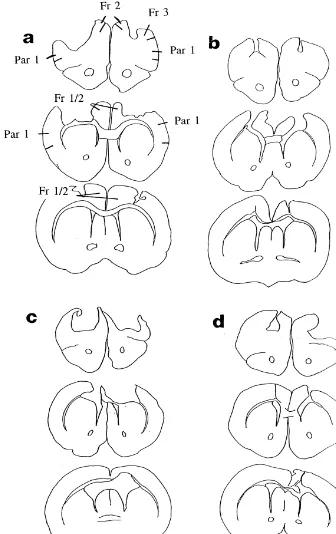
The lesions removed the intended targets in both the 2.5.4. Locomotor activity adult and infant rats but there were obvious differences in Activity was measured in a bank of 18-wire photocell the brains across the three lesion groups (Fig. 1). The cages using a procedure described by Whishaw et al. [32]. lesion extent in the brains of rats with P1 lesions was more The individual cages were 40 cm long, 25 cm deep, and 18 variable than in the other two groups, especially in the cm high, with two parallel horizontal infrared beams 1 cm medial extent. Six of the 10 P1 rats had unilateral damage above the floor, 12 cm from each end of the cage, and to Zilles’ [30] area Cg1. Two of the seven P10 rats had perpendicular to the long axis of the cage. The beam similar damage but none of the adult operates did. The breaks, registered incrementally, by a computer, were corpus callosum and external capsule were markedly summed into 5-min time bins during the locomotor tests. shrunken in both of the young operated groups and the The animal activity score was the mean of the daily sum ventricles were clearly enlarged. Finally, the intact poste-over a 4-day test period. rior cortex was visibly thinner in the injured hemisphere in
the infant, but not the adult, lesion groups. 2.5.5. Morris water task
Spatial navigation was assessed in a swimming pool
3.1. Brain weights [22] and was based on a procedure devised by Kolb and
Whishaw [18]. Rats were trained to swim to a Plexiglas
Because the fixation procedure for Golgi-Cox embed-platform hidden 1.5 cm beneath the surface of water in a
ding and retrograde labeling are different, the brain circular pool (diameter, 150 cm; height 45 cm). Milk
weights are not comparable. We therefore report here only powder was dissolved in the water to render the platform
the data for brains fixed for Golgi-Cox, which was the invisible. The rats began their search from one of four
majority of the brains. Because brain weight is sexually locations at the perimeter of the pool; the order of starting
dimorphic (male brains are heavier), a two-way ANOVA locations was randomly assigned. A group of four trials
for sex and lesion was conducted. This showed a signifi-from each of the starting locations constituted a trial block.
cant main effect of sex, F(1,28)56.96, P50.014, lesion, Rats were given four trials per day for 10 consecutive days
F(3,28)519.67, P,0.0001, but not an interaction, with an intertrial interval of approximately 5 min. If on a
F(3,28)50.69, P50.565. particular trial a rat found the platform, it was permitted to
Follow-up one-way ANOVAs for males only found a remain on the platform for 10 s. A trial was terminated if a
significant lesion group effect, F(3,9)511.77, P50.002. rat failed to find the platform after 90 s. At the end of a
Both the P1 and P10 males had significantly lighter brains trial, the rat was returned to a holding cage, and
approxi-compared to control and adult lesioned animals which did mately 5 min elapsed before beginning the next trial. The
not differ (see Table 1). There was also a significant effect latency to find the platform was timed by an experimenter
of lesion group for the females, F(3,19)514.41, P,
standing by the pool’s edge. The route traversed by each
0.0001. All of the lesion groups had significantly lighter rat was traced using pencil and paper by a second observer.
brains than the female control group. The P1 group was the An error was scored if the rat’s path deviated from a 20 cm
lightest and differed from both the P10 and adult animals. wide channel going directly from the start point to the
platform. The hidden platform was kept in a constant
location for all 10 trial blocks. 3.2. Cortical thickness
Fig. 1. Serial drawings of Golgi-Cox stained-coronal sections through the brain of representative rats with bilateral lesions of the motor cortex as adults (A), on postnatal day 10 (B), or postnatal day 1 (C and D). There was more variance in the P1 operates, which is illustrated in the range between the large (C) and small (D) examples.
extent of the brain although the effect was somewhat as a significant interaction, F(12,108)55.44, P,0.0001. bigger in the P1 brains. Follow-up one-way ANOVAs by plane revealed significant A two-way, repeated measures ANOVA with lesion (P values,0.001) effects of the lesion group at all the group and plane as factors showed significant main effects planes except plane 4: plane 1, F(3,27)517.9; plane 2, of the lesion group, F(3,27)520.74, P,0.0001, and the F(3,27)514.6; plane 3, F(3,27)58.6; plane 4, F(3,27)5
Table 1
a
Summary of brain weights by lesion group
b
Group Sex
Male Female
d
Control 2.1960.02 2.0760.04
c,d c,d
P10 lesion 1.8460.08 1.8460.03
c,d c,d,e
P1 lesion 1.8160.04 1.6060.07
c
Adult lesion 2.0860.05 1.9060.07
a
Note: numbers refer to means6S.E.M. of brain weights in g.
b
Sample size for each group is as follows: control, males n54, females n511; P10, males n52, females n52; P1, males n52, females n55; adult, males n55, females n55.
c
Differs significantly from the corresponding control group, P,0.05.
d
Differs significantly from the corresponding adult lesion group, P,0.05.
e
Differs significantly from the corresponding postnatal day 10 group, P,0.05.
3.3. Dendritic arborization
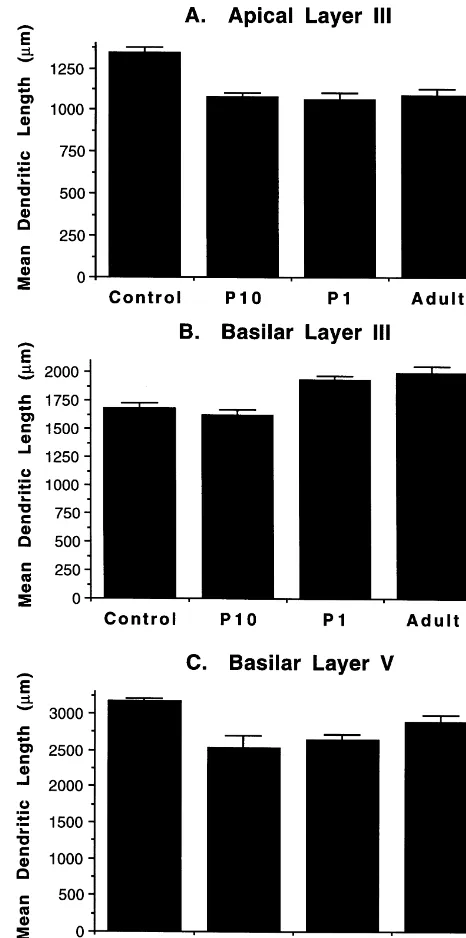
The effects of the lesions varied by the measure of dendritic arborization (see Fig. 3). For the apical fields of layer III, all lesion groups showed reduced dendritic length compared to the control group. In contrast, for the layer III basilar field there was a significant increase in dendritic length in the adult and P1 operate groups but no change in the P10 group. Curiously, however, for the basilar fields of layer V, all the lesioned groups showed reduced branching compared to the control animals. Thus, there was an effect of lesion on all measures but it was only the layer III basilar measure that dissociated the lesion groups from one another.
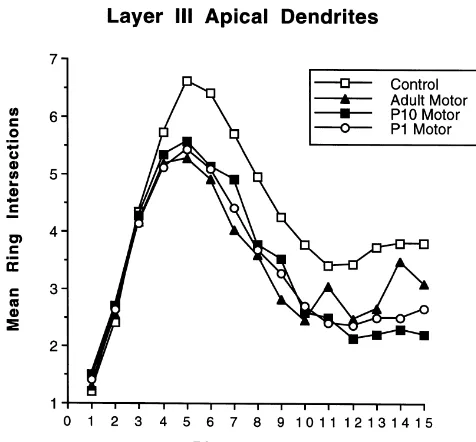
Repeated measures ANOVAs (group3intersection ring) were conducted for each of the cell measures. For the apical layer III measure there was a significant main effect of group, F(3,62)515.6, P,0.0001, and ring intersection,
F(15,930)597.8, P,0.0001, as well as of the interaction,
Fig. 3. Summary of total dendritic length for the apical and basilar dendritic trees of layer III and the basilar tree of layer V pyramidal neurons in Zilles’ area Par1.
F(45,930)52.2, P,0.0001. The interaction reflected the fact that the control group had more dendritic arbor distal to the cell body than did the other three groups (Fig. 4). For the basilar layer III measure there also was a signifi-cant main effect of group, F(3,62)57.5, P,0.001, and ring intersection, F(9,432)5435.5, P,0.0001, as well as of the interaction, F(27,432)51.7, P,0.01. This inter-action is reflected in the differential response of the adult and P1 operates that is shown in Fig. 3. The increased
Fig. 2. Summary of cortical thickness at five planes of section. Except for
dendritic arbor in those two groups was found in the more
the planes of lesion (1 and 2), rats with adult motor cortex lesions had
distal segments. Finally, for the basilar layer V measure
cortex of normal thickness whereas rats with P10 or P1 lesions had
spine density on the terminal tips, F(3,52)55.56, P5
0.002, but not for spines on the oblique branches,
F(3,52)52.5, P50.07. Post hoc tests showed that lesions at both P1 and in adulthood resulted in increased spine density on the terminal and oblique branches compared to the control and P10 animals.
3.5. Retrograde tracing
In order for a dye injection to be considered successful, three conditions were required: (a) labeled cells were present in the cortex; (b) the site of dye injection in the spinal cord was located histologically, and (c) the dye injection was found to be largely unilateral. In total, nine injections met these criteria (two control, three P10, two P1, two adult).
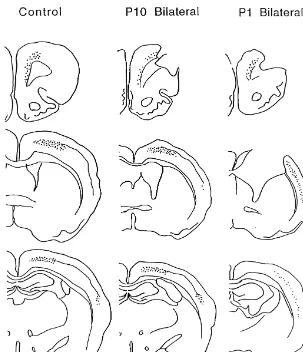
The control rats had cells labeled in layer V of three cortical locations contralateral to the injections: the forelimb representations in the motor cortex; the anterior cingulate region; and Zilles’ [30] parietal area 2 (Fig. 5).
Fig. 4. Summary of Sholl ring intersections on the apical dendrites of
In some rats there was also label ipsilateral to the injection,
layer III pyramidal cells at different distances from the cell body (rings
were 20mm apart). There is no lesion effect near the cell body but all particularly in the forelimb area, although this label was
lesion groups show a reduction in dendritic extent at the more distal rings. light compared to the contralateral side. Rats with lesions
in adulthood or on day 10 had essentially identical patterns of labeling, although there was obviously no label in the damaged area. There was little ipsilateral label visible. 10.9, P,0.0001, and ring intersection, F(15,930)52086.7, Thus, the total labeled area was reduced in these animals.
P,0.0001, as well as of the interaction, F(45,930)58.5, In contrast, the rats with P1 lesions had an expanded area
P,0.0001. Once again, the interaction reflected a decrease of labeling that included most of the parietal cortex and in the distal dendritic arbor in the lesion groups relative to little of the remaining motor cortex. The extent of expan-the control group, much as shown in Fig. 4 for expan-the layer III sion of labeling was proportional to the lesion extent: the
cells. larger the lesion, the larger the field of corticospinal
projections. The lesion shown in Fig. 5 is actually the 3.4. Spine density largest lesion and this animal had the most extensive area of corticospinal projections. The labeled cells were not Spine density was measured only on the layer V basilar only more diffusely located in the P1 rats, but the labeled branches. Compared to the control and P10 animals there cells also occupied a more restricted band in layer V, as was an increase in spine density on the terminal tip for the illustrated in Fig. 6.
both the P1 and adult lesioned animals (see Table 2). One-way ANOVAs showed an effect of lesion group for
4. Behavioral results
4.1. Reaching task
Table 2
Summary of dendritic spine density on basilar branches in layer V of area
a
Par1 Bilateral motor cortex lesions at any age had an adverse
b
Group Terminal Oblique effect on the animals’ ability to reach for food in the free choice condition. A summary of the reaching performance
Control 9.360.17 8.960.20
with the preferred forelimb is shown in Fig. 7.
P10 lesion 9.560.29 7.960.21
c d
P1 lesion 10.460.38 9.260.27 If an animal did not learn to reach, it was excluded from
c d
Adult lesion 10.260.17 9.360.19 the ANOVA. One out of 17 control animals, 0 of 7
a
Note: numbers represent mean6S.E.M. for the spine density at the postnatal day 10, 5 of 11 postnatal day 1, and 6 of 10 adult
terminal tip and on an oblique branch. lesioned animals did not reach using either forelimb, even
b
Sample size for each group is as follows: control, n513; P10, n55; P1, with daily training for 4 months. The mean hit percent for n55; adult n510.
c the successfully reaching animals was as follows: control,
Differs significantly from the control group, P,0.05.
d 68%; P10, 38%; P1, 24%; and, adult lesion, 24%. A
Differs significantly from the animals lesioned at postnatal day 10,
Fig. 5. Illustrations of the pattern of retrograde labeling in the cortex of rats receiving unilateral injections of True Blue in the spinal cord. The pattern of label is similar in the control and P10 rats (as well as the adult lesion rats that are not illustrated) but there is a marked expansion of the field of cortical projection neurons in the P1 group. Each dot represents a retrogradely labeled neuron.
animals showed a significant effect of the lesions, errors while traversing the beam (see Fig. 8); male rats
F(3,28)530.7, P,0.0001, with the post hoc tests revealing with adult lesions were also impaired.
significantly lower hit percents for all the lesioned animals A two-way ANOVA on the total number of slips compared to the control animals and a difference between revealed a significant main effect of lesion group, the P10 and the adult and P1 groups. F(3,35)58.3, P50.0003, and sex, F(1,35)54.9, P50.034, An alternative way to assess the effects of the lesions on but no interaction, F(3,35)51.6, P50.20. A follow-up reaching is to include all the animals in the data set and to one-way ANOVA showed no significant overall effect of assign a hit percent of 0% to those who failed to reach the lesion group for females, F(3,20)52.0, P50.142, but criterion. The new mean hit percent for each of the groups the post hoc test showed significantly more slips by the P1 is as follows: control, 63%; P10, 38% (no change), P1, lesion group compared to the controls (see Fig. 8). For the 13%, and adult lesion, 10%. males, both the P1 and adult lesion groups had sig-nificantly more slips than both the control and P10 animals, F(3,15)57.1, P50.004.
4.2. Beam walking
When the rats were initially placed upon the beam they 4.3. Tongue extension made many placing errors but within a few trials they ran
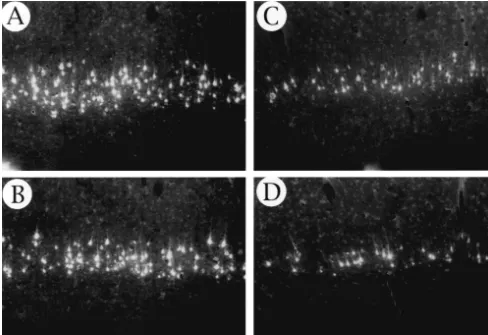
Fig. 6. Photomicrograph (2503) showing examples of the layer V retrogradely labeled neurons from two control (A, B) and two P1 lesion (C, D) rats. The layer of projection cells is distinctly narrower in the P1 brains.
lesions were impaired at tongue extension compared to One-way ANOVAs revealed a significant difference control animals. The P1 animals were also impaired in based on lesion group for both the average tongue exten-comparison to the P10 rats. sion measure, F(3,39)58.1, P50.0003, and the longest tongue extension measure, F(3,39)55.9, P50.002. The pattern of results were similar for the two measures in that
Fig. 7. Summary of reaching performance. All motor cortex lesion
Table 3
a
Summary of tongue extension and locomotor activity
b
Note: numbers refer the mean6S.E.M. The unit of measure for tongue extension is the distance in mm, and for locomotor activity it is the total number of beam crossings.
b
Sample size for each group: control n517; postnatal day 10 lesion, n56; postnatal day 1 lesion, n510; adult lesion, n510.
c
Differs significantly from the control group, P,0.05.
d
Differs significantly from the postnatal day 10 lesion group, P,0.05.
e
Differs significantly from the adult lesion group, P,0.05.
both the P1 and adult animals did worse than the controls and the P10 animals (see Table 3).
4.4. Locomotor activity
Bilateral lesions at postnatal day 1 significantly in-creased the locomotor activity in comparison to all of the other groups (see Table 3). The ANOVA showed a significant effect for lesion group, F(3,39)55.8, P50.002.
4.5. Morris water task
The control rats in this study performed much like those described in detail elsewhere [27]. When initially placed in the milk tank, the normal control rats swam over a wide area until they accidentally bumped into the hidden platform. Performance improved rapidly on successive trials until it reached asymptote around 5 s by trial block 5 (20 trials).
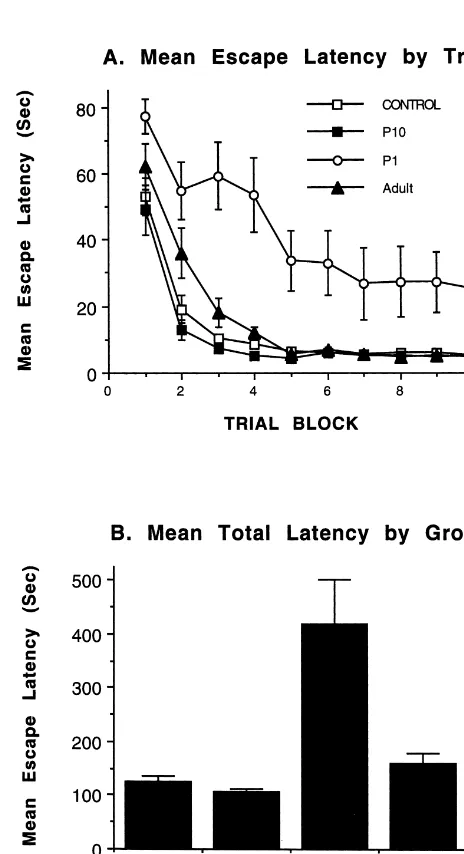
Rats with bilateral motor cortex lesions on postnatal day 1 showed a marked impairment at the task over the 10 trial blocks compared to all other groups (see Fig. 9). Rats with adult lesions showed some initial impairment on the latency measure and an impairment on the total number of errors. There was no obvious motor impairment in swim-ming behavior, nor in swimswim-ming speed, although the latter was not explicitly measured. In any event, there is little reason to suspect that the deficit in water task learning was due to a motor difficulty. Rather, the error measure indicates that in contrast to the control animals, the P1 animals did not learn to swim directly to the platform. Inspection of the swim paths indicated that they learned a looping strategy whereby they swam parallel to the tank wall with a trajectory that insured that they would eventu-ally hit the platform. The mean errors (6S.E.) were as follows: control, 5.160.5; adult lesion, 8.161.0; P10 lesion, 4.260.9; and, P1 lesion, 18.764.
A two-factor, repeated measures (trial) ANOVA re- Fig. 9. Summary of the Morris water task performance. The top graph vealed a significant main effect for lesion group, F(3,39)5 illustrates the escape latency across the 10 trial blocks. The bottom graph
F(9,27)582.7, P,0.0001, and a significant interaction, a selective deficit on skilled reaching, and this deficit is not
F(27,351)52.72, P,0.0001 using mean escape latency per as severe as that of the younger or older animals (current trial. The interaction is primarily the result of the atypical study).
learning curve of the P1 animals. As a follow-up, one-way The privileged outcome after cortical injury on postnatal ANOVAs were conducted at each trial block. The P1 group day 10 versus the extremely poor outcome after similar had significantly longer latency than all of the other groups lesions on postnatal day 1 is consistent with similar from trial block 2 on (see Fig. 9) and never did learn the findings after damage to the medial frontal cortex, poste-task. Post hoc tests on the mean total latency confirmed rior parietal cortex, occipital cortex, and cingulate cortex at this effect: P1 animals had longer latencies than all of the these two ages (for a review, see Ref. [11]). In each of other groups. these cases animals with P10 lesions have smaller brains A two-factor, repeated measures ANOVA on the mean and thinner remaining neocortex, yet they show consider-number of errors revealed a similar pattern as the latency able recovery of function and do not show the devastating measure with significant main effects of lesion group, sequelae of the lesions on P1. For example, in the current
field of rats with unilateral cortex lesions (e.g., Refs. Acknowledgements [5,33]). It is generally thought that such anomalous
connections reflect a change in the selective elimination of This research was supported by an Natural Science and exuberant axon projections [24] (see O’Leary [23] for a Engineering Council of Canada grants to B.K. and I.Q.W. review). Thus, the anomalous corticospinal projections are and a research grant-in-aid from Okanagan University conceptually similar to the anomalous projections of College to J.C. The authors thank Robbin Gibb, Jennifer colossal neurons in cats with natural [25] or surgically- Hewson and Allan Ouellette for their technical help. induced strabismus (e.g., Ref. [1]), or in experiments in
which there are surgical manipulations of thalamocortical input during development (e.g., Refs. [4,33]).
References The previous studies showing anomalous motor
projec-tions had suggested that this expanded corticospinal
pro-[1] N.E. Berman, B.R. Payne, Alterations in connections of the corpus
jection field was responsible for enhanced recovery of callosum following convergent and divergent strabismus, Brain Res. motor behaviors after unilateral perinatal motor cortex 274 (1983) 201–212.
lesions but this is not likely in the current study. In fact, in [2] A.J. Castro, Ipsilateral corticospinal projections after large lesions of the cerebral hemisphere in neonatal rats, Exp. Neurol. 46 (1975)
spite of an increase in corticospinal projection fields in the
1–8.
P1 rats, there was not only no recovery of function on the
[3] A.J. Castro, Limb preference after lesions of the cerebral hemisphere
motor tasks but there was also a large impairment on a in adult and neonatal rats, Physiol. Behav. 18 (1977) 605–608. cognitive task. This latter outcome implies that the [4] F. Chang, J.G. Steedman, R.D. Lund, The lamination and connec-anomalous corticospinal projection field may have been tivity of embryonic cerebral cortex transplanted into newborn rat
cortex, J. Comp. Neurol. 244 (1986) 401–411.
disruptive to the operations of the usual functions of the
[5] C.J. D’Amato, S.P. Hicks, Normal development and post-traumatic
invaded regions, which is what Teuber [28] referred to as
plasticity of corticospinal neurons in rats, Exp. Neurol. 60 (1978)
crowding. One prediction from this hypothesis is that there 557–569.
should be an anomalously located motor map located in [6] R. Gibb, B. Kolb, A method for Golgi-Cox staining of Vibratome the posterior cortex in the region of the expanded cor- cut tissue, J. Neurosci. Methods 79 (1998) 1–4.
[7] S.P. Hicks, C.J. D’Amato, Motor-sensory cortex–corticospinal
sys-ticospinal projections and we have recently found this to
tem and developing locomotion and placing in rats, Am. J. Anat.
be the case [9]. There is, of course, one other explanation
143 (1975) 1–42.
for the worsened outcome after P1 lesions and that is that
[8] G. Kartje-Tillotson, E.J. Neafsey, A.J. Castro, Electrophysiological
these animals may have had larger, or even different, analysis of motor cortical plasticity after cortical lesions in newborn lesions than the P10 animals. It seems likely that some of rat, Brain Res. 332 (1986) 103–111.
the P1 animals did, in fact, have larger lesions than the P10 [9] J.A. Kleim, R.C. Ryder, A. Witt-Lajeunesse, P.M. VandenBerg, B. Kolb, Emergence of movement representations within adult parietal
animals. For example, 60% of the P1 rats had unilateral
cortex following neonatal frontal cortex damage, submitted for
damage to the anterior cingulate region whereas only 30%
publication.
of the P10 rats did. However, even when these animals are [10] B. Kolb, Recovery from early cortical damage in rats. I. Differential excluded from the analysis the difference between the behavioral and anatomical effects of frontal lesions at different ages
outcome of the P1 and P10 lesions is maintained. Further- of neural maturation, Behav. Brain Res. 25 (1987) 205–220. [11] B. Kolb, Brain Plasticity and Behavior, Lawrence Erlbaum,
more, the cingulate damage was always unilateral and
Mahwah, NJ, 1995.
unilateral anterior cingulate lesions produce virtually no
[12] B. Kolb, J. Cioe, D. Muirhead, Cerebral morphology and functional
difference on the Morris water maze performance, even sparing after prenatal frontal cortex lesions in rats, Behav. Brain when they are performed on the day of birth [21]. It thus Res. 91 (1998) 143–155.
seems unlikely that the spatial learning deficit can be [13] B. Kolb, S. Cote, A. Ribeiro-da-Silva, A.C. Cuello, NGF stimulates recovery of function and dendritic growth after unilateral motor
ascribed to the cingulate damage. We note too, that the
cortex lesions in rats, Neuroscience 76 (1977) 1139–1151.
brain weights of the P1 and P10 operates were comparable,
[14] B. Kolb, R. Gibb, Environmental enrichment and cortical injury:
suggesting that the lesions were not wildly discrepant in behavioral and anatomical consequences of frontal cortex lesions in size. We cannot be certain that exactly the same neurons rats, Cereb. Cortex 1 (1991) 189–198.
were removed at the two ages, however, because neural [15] B. Kolb, R. Gibb, Sparing of function after neonatal frontal lesions correlates with increased cortical dendritic branching: a possible
migration is not complete at P1 so we may have either
mechanism for the Kennard effect, Behav. Brain Res. 43 (1991)
removed or hindered the migrational route of neurons
51–56.
destined for cortical regions beyond the motor cortex. [16] B. Kolb, R. Gibb, D. van der Kooy, Cortical structure and In conclusion, the results of the present study suggest connectivity after neonatal frontal cortex lesions in rats, Brain Res.
that although there are wide ranging anatomical changes 645 (1994) 85–97.
[17] B. Kolb, C. Holmes, Neonatal motor cortex lesions in the rat:
following motor cortex injury at all ages, rats with P10
absence of sparing of motor behaviors and impaired spatial learning
lesions appeared to show better behavioral recovery. The
concurrent with abnormal cerebral morphogenesis, Behav. Neurosci.
puzzle posed by the current study, however, is just what 97 (1983) 697–709.
the changes in brain morphology might be that support this [18] B. Kolb, I.Q. Whishaw, Dissociation of the contributions of the
the rat: an experimental review, Can. J. Psychol. 37 (1983) 211– kittens, II. Visual system tests, and proposing a ‘critical period’ for
232. lesion effects, Behav. Brain Res. 57 (1993) 79–92.
[19] B. Kolb, I.Q. Whishaw, Neonatal frontal lesions in the rat: sparing of [30] I.Q. Whishaw, The decorticate rat, in: B. Kolb, R. Tees (Eds.), The learned but not species-typical behavior in the presence of reduced Cerebral Cortex of the Rat, The MIT Press, London, 1990, pp. brain weight and cortical thickness, J. Comp. Physiol. Psychol. 95 239–267.
(1981) 863–879. [31] I.Q. Whishaw, F. Haun, B. Kolb, Analysis of behavior in laboratory [20] B. Kolb, I.Q. Whishaw, Plasticity in the neocortex: mechanisms rodents, in: U. Windhorst, H. Johansson (Eds.), Modern Techniques
underlying recovery from early brain damage, Prog. Neurobiol. 32 in Neuroscience Research, Springer-Verlag, New York, 1999. (1989) 235–276. [32] I.Q. Whishaw, D. Fiorino, G. Mittleman, E. Casteneda, Do forebrain [21] B. Kolb, J. Zaborowski, I.Q. Whishaw, Recovery from early cortical structures compete for behavioural expression? Evidence from damage in rats: 5. Unilateral lesions have different behavioral and amphetamine-induced behavior, microdialysis, and caudate-accum-anatomical effects than bilateral lesions, Psychobiology 17 (1989) bens lesions in medial frontal cortex damaged rats, Brain Res. 576
363–369. (1992) 1–11.
[22] R.G.M. Morris, Spatial localization does not require the presence of [33] I.Q. Whishaw, B. Kolb, Sparing of skilled forelimb reaching and local cues, Learn. Motivat. 12 (1981) 239–260. corticospinal projections after neonatal motor cortex removal or [23] D.D. O’Leary, Development of connectional diversity and specificity hemidecortication in the rat: support for the Kennard Doctrine, Brain
in the mammalian brain by the pruning of collateral projections, Res. 451 (1988) 97–114.
Curr. Opin. Neurosci. 2 (1992) 70–77. [34] I.Q. Whishaw, B. Kolb, Tongue protrusion mediated by spared [24] D.D. O’Leary, B.B. Stanfield, Selective elimination of axons extend- anterior ventrolateral neocortex in neonatally decorticate rats: Be-ed by developing cortical neurons is dependent on regional locale: havioural support for the neurogenetic hypothesis, Behav. Brain experiments utilizing fetal cortical transplants, J. Neurosci. 9 (1989) Res. 32 (1989) 101–113.
607–617. [35] I.Q. Whishaw, B. Kolb, R.J. Sutherland, J. Becker, Cortical control [25] C.J. Shatz, Anatomy of interhemispheric connections in the visual of claw cutting in the rat, Behav. Neurosci. 97 (1983) 370–380.
system of Boston Siamese and ordinary cats, J. Comp. Neurol. 173 [36] I.Q. Whishaw, R.B. O’Connor, S.B. Dunnett, The contributions of (1977) 497–518. the motor cortex, nigrostriatal dopamine and caudate-putamen to [26] D.A. Sholl, The Organization of the Cerebral Cortex, Methuen, skilled forelimb use in the rat, Brain 109 (1986) 805–843.
London, 1956. [37] I.Q. Whishaw, S.M. Pellis, B.P. Gorny, V.C. Pellis, The impairments [27] R.J. Sutherland, I.Q. Whishaw, B. Kolb, A behavioural analysis of in reaching and the movements of compensation in rats with motor spatial localization following electrolytic, kainate-, or colchicine- cortex lesions: an endpoint, videorecording, and movement notation induced damage to the hippocampal formation in the rat, Behav. analysis, Behav. Brain Res. 42 (1991) 77–91.
Brain Res. 7 (1983) 133–153. [38] G.S. Withers, W.T. Greenough, Reaching training selectively alters [28] H.-L. Teuber, Recovery of function after brain injury in man, in: dendritic branching in subpopulations of layer II–III pyramids in rat Outcome of Severe Damage to the Central Nervous System (CIBA motor-somatosensory forelimb cortex, Neuropsychologia 27 (1989) Foundation Symposium), Elsevier, Amsterdam, 1975. 61–69.