A NOVEL QUALITY CONTROL PROCEDURE FOR THE EVALUATION OF
LASER SCANNING DATA SEGMENTATION
Z. Lari a, K. Al-Durgham a, A. Habib b
a
Dept. of Geomatics Engineering, University of Calgary, 2500 University Drive NW, Calgary, Canada T2N1N4 (zlari, kmaldurg)@ucalgary.ca
b
Lyles School of Civil Engineering, Purdue University, 550 Stadium Mall Drive, West Lafayette, IN 47907 [email protected]
Commission I, WG III/3
KEY WORDS: Laser scanning, Quality control, Segmentation, Planar features, Linear/Cylindrical features
ABSTRACT:
Over the past few years, laser scanning systems have been acknowledged as the leading tools for the collection of high density 3D point cloud over physical surfaces for many different applications. However, no interpretation and scene classification is performed during the acquisition of these datasets. Consequently, the collected data must be processed to extract the required information. The segmentation procedure is usually considered as the fundamental step in information extraction from laser scanning data. So far, various approaches have been developed for the segmentation of 3D laser scanning data. However, none of them is exempted from possible anomalies due to disregarding the internal characteristics of laser scanning data, improper selection of the segmentation thresholds, or other problems during the segmentation procedure. Therefore, quality control procedures are required to evaluate the segmentation outcome and report the frequency of instances of expected problems. A few quality control techniques have been proposed for the evaluation of laser scanning segmentation. These approaches usually require reference data and user intervention for the assessment of segmentation results. In order to resolve these problems, a new quality control procedure is introduced in this paper. This procedure makes hypotheses regarding potential problems that might take place in the segmentation process, detects instances of such problems, quantifies the frequency of these problems, and suggests possible actions to remedy them. The feasibility of the proposed approach is verified through quantitative evaluation of planar and linear/cylindrical segmentation outcome from two recently-developed parameter-domain and spatial-domain segmentation techniques.
1. INTRODUCTION
Laser scanning systems have been commonly employed in a wide variety of applications such as digital building model generation, industrial site modelling, cultural heritage documentation, and other civilian and military needs. Usually, laser scans are acquired over complex scenes that might contain buildings, roads, trees, light poles, and many human-made and natural objects. The raw point cloud does not provide any semantic information about the type of the scanned features (i.e., planar, linear, or cylindrical features). Therefore, it should undergo a segmentation process to extract the required information for the aforementioned applications. The segmentation procedure aims at extracting features of interest from the laser scanning data and reducing the scene complexity by disassembling it into meaningful categories. Thus far, various segmentation methods with different target functions and processing procedures have been introduced and utilized. In general, any segmentation process is expected to have some artefacts due to the variations in the internal characteristics of laser scanning data (point density and noise level) and the strict/relaxed selection of segmentation thresholds. In other words, no segmentation approach is exempted from possible anomalies. Therefore, quality control procedures are required to evaluate the performance of the laser scanning data segmentation approaches.
To date, few research attempts have been conducted to introduce quality control measures for the evaluation of segmentation results. The most commonly used metrics for quality control of segmentation and object extraction outcomes are correctness and completeness measures which are estimated
based on confusion or error matrix (Heipke et al., 1997). This confusion matrix is established while comparing the segmentation results with reference (ground truth) data. A good segmentation outcome should have both high completeness and correctness measures (Rutzinger et al., 2009). This quality control procedure is able to quantitatively evaluate the segmentation outcome. However, it cannot be applied in the absence of reference data. Moreover, this approach does not consider different types of problems that might affect the segmentation outcome (i.e., it does not investigate why a specific feature has not been accurately segmented). Finally, this approach does not suggest possible actions for resolving the segmentation problems. There has also been another research work which has categorized the possible problems in the segmentation results into un-incorporated points, over-segmentation, and under-segmentation problems (Belton, 2008). In this approach, the instances of the classified problems are firstly identified by visual inspection of the segmentation outcome. The causes of the classified segmentation problems are then investigated and possible solutions for the alleviation of these problems are proposed. This approach suffers from following drawbacks: 1) the instances of the segmentation problems cannot be identified without user intervention, and 2) it does not provide quantitative measures that indicate the frequency of such problems. In order to overcome the limitations of the aforementioned approaches, a new quality control procedure is introduced in this paper.
This paper starts with the introduction of the proposed quality control procedure for the evaluation of laser scanning data segmentation. The performance of the proposed approach is then assessed through qualitative and quantitative evaluation of The International Archives of the Photogrammetry, Remote Sensing and Spatial Information Sciences, Volume XL-1, 2014
ISPRS Technical Commission I Symposium, 17 – 20 November 2014, Denver, Colorado, USA
This contribution has been peer-reviewed.
experimental results using real datasets. Finally, concluding remarks and recommendations for future research work are presented.
2. METHODOLOGY
In this section, the proposed quality control procedure for the evaluation of laser scanning data segmentation is introduced. This quality control procedure makes hypotheses about different scenarios/problems that might happen in planar and linear/cylindrical features’ segmentation, develops procedures for detecting instances of these problems, and suggests possible actions to solve these problems without the need for having reference data. For each of the identified problems, a quantitative measure is established that gives an indication about the frequency of such a problem.
As a tool to evaluate the quality of the segmented features (planar and linear/cylindrical), the surface roughness factor is estimated as the Root Mean Square Error (RMSE) of the normal distances between the points within a segmented feature and plane/line/cylinder’s surface through the entire cluster’s points, and n is the number of the points in the segmented cluster. In the following subsections, the problems affecting the quality of planar and linear/cylindrical features’ segmentation are introduced, the frequency of instances of such problems is quantified, and possible actions for resolving these problems are proposed.
2.1 Non-Segmented Points
The non-segmented points are defined as those belonging to planar or linear/cylindrical features and could not be clustered during the segmentation procedure. These points might belong to small planar or linear/cylindrical regions whose points’ count is less than the pre-specified number of points that is included in the smallest detectable cluster. This problem might also happen when these points are erroneously missed due to improper selection of the segmentation thresholds or other problems in the segmentation process (e.g., attribute estimation or cluster detection procedures). Each non-segmented point can be included in its neighboring planar or linear/cylindrical segment, if its normal distance to the best-fitted plane or line/cylinder’s surface through the points of that segment is not more than a pre-specified threshold. This threshold is determined based on the surface roughness factor of the neighboring segmented planar or linear/cylindrical feature. The frequency of this problem within segmentation results is then derived as in segmented planar or linear/cylindrical points that have been incorporated in existing segmented regions. A smaller value of QC-measureNSP indicates that a fewer instances of such a problem have occurred within the segmentation outcome, and higher quality results have been derived.
2.2 Over-Segmentation
The over-segmentation problem occurs when a planar or linear/cylindrical feature is segmented into several planar or
linear/cylindrical segments. This problem might happen due to using strict segmentation thresholds or problems in attribute computation or cluster detection procedures. To identify instances of over-segmentation problem, the similarity between surface normals to neighboring planar segments and directional parameters of neighboring linear/cylindrical features are firstly investigated. If the surface normals to neighboring planar features or directional parameters of neighboring linear/cylindrical features are deemed to be similar, the neighboring features are merged together as a single planar or liner/cylindrical feature. The surface roughness factor of the merged feature is then estimated and compared to the surface roughness factors of their constituent features. If the surface roughness factor of the merged surface significantly varies from the surface roughness factor of the original segments, the merged feature is rejected and the original features will be restored. Once all the neighboring segments are checked for over-segmentation, the frequency of this problem is estimated according to Equation (3).
(3)
Where, nS is the total number of initially segmented clusters and mOS is the number of segments that can be incorporated into other clusters as a result of the proposed quality control procedure. A smaller value of QC-measureOS indicates that a fewer instances of such a problem have occurred within the segmentation outcome, and higher quality results have been derived.
2.3 Under-Segmentation
The under-segmentation problem occurs when having different features segmented into one cluster. This problem might happen due to using relaxed segmentation thresholds and improper seed region selection in spatial-domain segmentation approaches or problems in attribute computation or cluster detection procedures in parameter-domain segmentation approaches. In order to detect instances of the under-segmentation problem, the average surface roughness factors (ASRF) for all segmented planar or linear/cylindrical features are firstly estimated according to Equation (4).
∑ ∑
(4)
Where ni is the number of points in the ith segment and ∑ is the total number of segmented points. For each segmented planar or linear/cylindrical feature, if its surface roughness factor is more than a pre-defined threshold (e.g., 2-3 times of the average surface roughness factor of all derived segments in the same category), that segment is suspected to be under-segmented. For the suspected under-segmented planar or linear/cylindrical regions, the segmentation process is repeated while changing the processing thresholds to check if they can be segmented into multiple clusters. Once this test is performed for all suspected clusters, the frequency of this problem is quantified according to Equation (5).
(5)
Where nS is the total number of initially segmented clusters and mUS is the total number of clusters that were split into several clusters as a result of the proposed quality control procedure. A smaller value of QC-measureUS indicates that a fewer instances of such a problem have occurred within the segmentation outcome, and higher quality results have been derived.
The International Archives of the Photogrammetry, Remote Sensing and Spatial Information Sciences, Volume XL-1, 2014 ISPRS Technical Commission I Symposium, 17 – 20 November 2014, Denver, Colorado, USA
This contribution has been peer-reviewed.
3. EXPERIMENTAL RESULTS
In this section, the performance of the proposed quality control procedure is evaluated using segmentation outcomes from two recently-developed parameter-domain (Lari and Habib, 2014) and spatial-domain (Al-Durgham, 2014; Al-Durgham and Habib, 2014) segmentation approaches. These segmentation procedures select the proper parameterization model for planar and linear/cylindrical features based on the PCA procedure. These approaches also consider the noise level as well as local point density variations within the laser scanning data. In order to verify the feasibility of the proposed quality control procedure for the assessment of planar and linear/cylindrical features segmentation, experiments using real airborne and static terrestrial laser scanning datasets are conducted. The airborne laser scanning dataset has been acquired over the University of Calgary campus area using an Optech ALTM 3100 laser scanner. The static terrestrial laser scanning dataset has been captured in an electrical substation using a FARO Focus3D terrestrial laser scanner.
These datasets are processed using the aforementioned parameter-domain and spatial-domain segmentation approaches for the segmentation of planar and linear/cylindrical features. Figures 1.a and 1.b show the planar features segmentation results for the airborne laser scanning dataset using the parameter-domain and spatial domain segmentation approaches, respectively. Figure 1.c shows the planar feature segmentation results for this dataset using the spatial-domain approach after the quality control procedure. One should note that the outcome of the parameter-domain segmentation approach after performing the quality control procedure is identical to figure 1.c.
(a)
(b)
(c)
Figure 1. Planar features segmentation outcome for an airborne laser scanning data using (a) parameter-domain approach before
the QC procedure, (b) spatial-domain approach before the QC procedure, and (c) spatial-domain approach after the QC
procedure
Qualitative evaluation of the derived segmentation results through visual inspection of Figures 1.a and 1.b shows that
some cases of the over-segmentation problem occurred in the segmentation results (on the rooftops and ground surface in the parameter-domain and spatial-domain segmentation results). Quantitative evaluation of the segmentation results is then performed by estimating the frequency of instances of the hypothesized problems. Table 1 summarizes the quality control measures of the achieved planar feature segmentation results for the airborne laser scanning dataset using the investigated segmentation approaches.
QC measures Parameter-
domain approach
Spatial- domain approach
Non-segmented
points 8% 14%
Over-segmentation 21% 17%
Under-segmentation 0.3% 1%
Table 1. Derived quality control measures for the parameter-domain and spatial-parameter-domain segmentation results of the airborne
laser scanning dataset
Analysis of the derived quality control measures shows that fewer instances of the non-segmented points occurred during the parameter-domain segmentation. On the other hand, the comparison of the derived quality control measures for the over-segmentation problem shows that fewer instances of this problem were detected in the spatial-domain segmentation results. The frequency of the under-segmentation problem was very similar in both of the segmentation approaches.
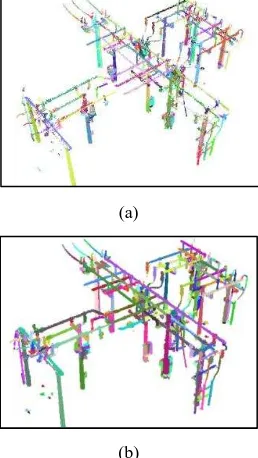
Figures 2.a and 2.b show the linear/cylindrical feature segmentation results for the static terrestrial laser scanning dataset using the parameter-domain and spatial-domain approaches, respectively. Qualitative evaluation of the derived segmentation results, through visual inspection of Figures 2.a and 2.b, verifies that the spatial-domain approach is able to extract more complete linear/cylindrical features due to its ability to consider the entire point cloud during the segmentation procedure. However, for the parameter-domain segmentation approach, only the points that were classified as belonging to the linear/cylindrical neighborhoods are considered.
(a)
(b)
The International Archives of the Photogrammetry, Remote Sensing and Spatial Information Sciences, Volume XL-1, 2014 ISPRS Technical Commission I Symposium, 17 – 20 November 2014, Denver, Colorado, USA
This contribution has been peer-reviewed.
Figure 2. Linear/cylindrical feature segmentation outcome for the static terrestrial laser scanning data (electrical substation): (a) parameter-domain segmentation and (b) spatial-domain
segmentation
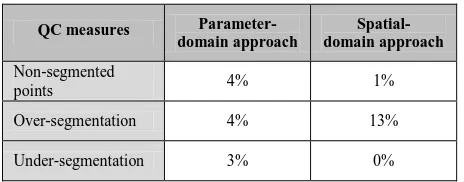
Quantitative evaluation of the segmentation results is then performed by estimating the frequency of instances of hypothesized problems during the segmentation procedure. Table 2 summarizes the quality control measures of the derived segmentation results for the static terrestrial laser scanning dataset using the aforementioned segmentation approaches.
QC measures Parameter-
domain approach
Spatial- domain approach
Non-segmented
points 4% 1%
Over-segmentation 4% 13%
Under-segmentation 3% 0%
Table 2. Derived quality control measures for the parameter-domain and spatial-parameter-domain segmentation results of the static
terrestrial laser scanning dataset
Analysis of these quality control measures indicates that fewer instances of the points which belong to the linear/cylindrical features were missed during the spatial-domain segmentation procedure. This investigation also showed that fewer instances of the over-segmentation problem were detected in the parameter-domain segmentation results, which probably occurred due to underestimation of the utilized normal distance thresholds for growing some of the linear/cylindrical features. On the other hand, the frequency of the under-segmentation problem was higher in the parameter-domain segmentation results, which may have happened due to problems either in the attributes computation or cluster detection procedures.
4. CONCLUSIONS AND RECOMMENDATIONS FOR FUTURE RESEARCH WORK
In this paper, a new quality control procedure for the evaluation of the laser scanning data segmentation was introduced. This quality control procedure addresses different issues/problems that might affect the quality of the segmentation outcome, identifies their occurrences in the segmentation results, and suggests alternatives for resolving these problems. Moreover, this approach derives quantitative measures that indicate the frequency of different problems in the laser scanning data segmentation. One should note that the proposed quality control procedure is implemented without the need for having reference data.
The feasibility of the proposed quality control procedure was verified through quantitative evaluation of spatial-domain and parameter-domain segmentation results. Comparison of the derived quality control measures showed that fewer laser scanning points which belong to planar features were missed using the utilized parameter-domain segmentation approach. However, the outcome from this approach (for planar features) is more prone to the over-segmentation problem when compared to the spatial-domain segmentation results. On the other hand, the linear/cylindrical segmentation results from spatial-domain approach shows more instances of over-segmentation problem and fewer instances of non-segmented points. The frequency of under-segmentation problem is almost the same for both of the investigated segmentation techniques.
Future research work will be focused on the expansion of the introduced quality control procedure by considering other issues that might affect the laser scanning data segmentation outcome (e.g., invaded and invading segments).
ACKNOWLEDGEMENTS
The authors would like to thank TECTERRA and the Discovery Grant from the Natural Sciences and Engineering Research Council of Canada (NSERC) for the financial support of this research work.
REFERENCES
Al-Durgham, K., 2014. Geometric Features Extraction and Automated Registration of Static Laser Scans Using Linear Features (Thesis). University of Calgary.
Al-Durgham, K., and Habib, A., 2014. Association-Matrix-Based Sample Consensus Approach for Automated Registration of Terrestrial Laser Scans using Linear Features. Photogrammetric Engineering and Remote Sensing Journal, Vol. 80, No. 10, pp. 23 – 33.
Belton, D., 2008. Classification and segmentation of 3D terrestrial laser scanner point clouds (PhD thesis). Department of Spatial Sciences, Curtin University of Technology, Perth, Australia.
Heipke, C., Mayer, H., Wiedemann, C., Jamet, O., 1997. Evaluation of automatic road extraction, in: The International Archives of the Photogrammetry, Remote Sensing and Spatial Information Sciences, Part 3-4W2. pp. 47–56.
Lari, Z., Habib, A., 2014. An adaptive approach for the segmentation and extraction of planar and linear/cylindrical features from laser scanning data. ISPRS Journal of Photogrammetry and Remote Sensing 93, 192–212.
Rutzinger, M., Rottensteiner, F., Pfeifer, N., 2009. A comparison of evaluation techniques for building extraction from airborne laser scanning. IEEE Journal of Selected Topics in Applied Earth Observations and Remote Sensing 2, 11–20.
The International Archives of the Photogrammetry, Remote Sensing and Spatial Information Sciences, Volume XL-1, 2014 ISPRS Technical Commission I Symposium, 17 – 20 November 2014, Denver, Colorado, USA
This contribution has been peer-reviewed.