CLIMATOLOGY OF THIN CIRRUS CLOUDS AT GADANKI (13.5
0N,79.2
0E) USING
GROUND BASED LIDAR AND SATELLITE BASED MEASUREMENTS
G. S. Motty a,* , G. S. Jayeshlal a , Malladi Satyanarayana a
a Department of Optoelectronics, University of Kerala, Kariavattom, Trivandrum-695 581, Kerala, [email protected]
KEY WORDS: Remote sensing, Atmosphere, Lidar, Cirrus clouds, Optical depth, Depolarization ratio, Lidar ratio.
ABSTRACT:
High altitude cirrus clouds play a significant role in the radiative balance of Earth atmosphere system. Information on cirrus occurrences and their optical properties is essential for climate modeling studies. The influence of high altitude thin cirru s clouds on the climate is important due to their optical and thermodynamic properties. In order to quantify their effect on atmosphere, the vertical structure and optical properties of these thin cirrus clouds are to be characterized. The Lidar technique has become a unique tool for detecting and characterizing cirrus clouds for their optical properties. Ground based LIDAR system offers an excellent way to obtain characteristic values on the cirrus formations, although the microphysical and optical properties of thin cirrus clouds can also obtained on global scale by the observations from Earth-orbiting Satellites .The ground-based lidar observations could provide more intensive measurements on continuous basis, compared to satellite observations. Utilising observations from both, the statistical characteristics, physical and optical properties of thin cirrus clouds can be retrieved more precisely. The present study is based on the ground based lidar measurements using the pulsed monostatic LIDAR system at the National Atmospheric Research Laboratory [NARL], Gadanki (13.50 N, 79.20 E), Andhra Pradesh, India. The data obtained in the altitude range of 8-20 km are used for this study. Cirrus observations made using CALIPSO and MODIS satellites are compared with the ground based lidar data for systematic statistical study of cirrus climatology. Optically thin cirrus clouds (τ<0.3) observed during 2009 are selected and their microphysical and geometrical properties are studied. The microphysical properties such as optical depth, lidar ratio and depolarisation ratio for cirrus clouds were obtained. It is observed that the variability in optical depth depends on the composition and thickness of the clouds. The relationships between various quantities were also processed. The study shows that the thin cirrus generally was present in higher altitudes and the optical properties show correlation with the height and the temperature.
1.Introduction
Cirrus clouds are one of the most important and yet uncertain components in weather and climate studies as they cover about
30 % of the Earth’s surface (Liou, 1986). Cirrus clouds mainly consist of ice particles and are often optically thin. The ice particles show various non spherical shapes (Lynch, 2002).They affect the radiation budget of the Earth– atmosphere system through two opposite phenomena. Ice crystals scatter and reflect incoming solar radiation back to space, leading to a cooling of the system, which is known as the albedo effect; inversely, they absorb and partly re-emit terrestrial infrared radiation, leading to a warming of the system, which is known as the greenhouse effect (Stephens, 1990; Chen, 2000). Optically thin cirrus clouds usually cause positive radiative forcing at the top of the atmosphere, whereas optically thick cirrus clouds produce cooling (Fu and Liou, 1993). The basic microphysical conditions, in addition to their dissimilar temperatures and altitudes in the troposphere, have fundamental implications in terms of radiative transfer .So in order to quantify the effect of thin cirrus clouds on the atmosphere, the vertical structure including parameters such as cloud top and bottom heights, cloud layer thickness, and associated optical and radiative properties are to be characterized.
The Lidar technique has become a quantitative tool for detecting and characterizing cirrus clouds and its various
properties. Ground based LIDAR system offers an excellent way to obtain characteristic values on cirrus formations. The microphysical and optical properties of cirrus clouds were obtained by the lidar observations from the Earth-orbiting Cloud Aerosol Lidar with Orthogonal Polarization (CALIOP) instrument on board the Cloud Aerosol Lidar and Infrared Pathfinder Satellite Observations (CALIPSO) satellite (Wang , 2011). The Moderate Resolution Imaging Spectroradiometer (MODIS), instrument on the Terra and Aqua Spacecraft is also used for the global observations of cirrus clouds. According to the previous lidar studies (Sassen and Cho, 1992) cirrus clouds are classified as, typical optical depth of τ < 0.03 for sub
-visible cirrus, 0.03 < τ < 0.3 for thin cirrus, and 0.3 < τ < 3.0
for dense clouds. The objective of this work is to find out the thin cirrus cloud statistics and its properties over the tropical station Gadanki (13.50 N, 79.20 E), India, using ground based and satellite based lidar observations during the year 2009.
2. DATA SOURCES
A pulsed monostatic LIDAR system was set up at the National Atmospheric Research Laboratory [NARL], Gadanki (13.50 N, 79.20 E), Andhra Pradesh, India in collaboration with Communication Research Laboratory Japan for the study of atmospheric aerosols and thermal structure of stratosphere and mesosphere in the year 1998. The lidar transmitter employs a Nd:YAG laser which emits the laser radiation (frequency doubled) at the 532nm wavelength with an energy of 550mJ per pulse (pulse-width, 7 ns and repetition rate, 20 Hz).The The International Archives of the Photogrammetry, Remote Sensing and Spatial Information Sciences, Volume XL-8, 2014
ISPRS Technical Commission VIII Symposium, 09 – 12 December 2014, Hyderabad, India
This contribution has been peer-reviewed.
laser beam is expanded using a 10x beam expander, which makes the beam divergence < 0.1 m rad. The receiver telescope is a 350-mm-diameter Schmidt–Cassegrain-type telescope with a FOV of 1 m rad. The data from Mie receiver which operates in the range of 8-20 km is used for this study. Cloud-Aerosol Lidar and Infrared Pathfinder Satellite Observations (CALIPSO) is a joint NASA-CNES satellite mission designed to provide insight in understanding of the role of aerosols and clouds in the climate system. CALIPSO provides information on the vertical distribution of aerosols and clouds as well as on their optical properties over the globe with high spatial resolution, since June 2006. For the present study Satellite based LIDAR observations from CALIOP on board the CALIPSO satellite data are used. For this study the data of product version 3 is obtained for a grid (50 N - 200 N; 600 E - 850 E).This data consist of layer data with horizontal resolution of 5km and a vertical resolution of 300m.
The Moderate resolution Imaging Spectroradiometer (MODIS) is the primary imager on the Earth Observing Systems Terra platform. The Terra satellite is in a sun-synchronous near polar orbit of 705 km and views the entire surface of the earth every one to two days. The MODIS data are generally processed into different levels from level 1 (radiances or brightness temperature), level 2 (derived geographical data products) and level 3, which is daily, eight-day, and monthly mean products generated globally at a 1°-1° latitude-longitude grid resolution. For the present study the data of product is obtained for a grid (75.60 W – 16.9130 N; 840 E – 10.9120 S).MODIS is the first satellite instrument with capability of the 1.375-m channel for cirrus cloud study because of strong water vapor absorption at this wavelength, and little upwelling radiance from low clouds or the surface which could reach the satellite. Here for cirrus detection MOD08_L3, level 3 Terra platform cloud data products are used. It is a level 3 MODIS girded atmosphere monthly product. The MODIS Cloud Product combines infrared and visible techniques to determine cirrus fraction. Atmospheric average cloud fraction is used in this study. However, combined studies with ground-based lidar together with satellite observations will allow full exploitation of the data for a detailed description of the temporal and spatial distribution and evolution on a global scale.
3. RESULTS AND OBSERVATIONS tropics. No cirrus thin clouds were observed for the months of August and September.
Figure 1-(a) the monthly variation of average cloud fraction over the observed region, (b) occurrence frequency according to
the variation of geometrical thickness
Figure 1(a) shows the statistics of average cloud fraction during the observation period over the station using MODIS observations and fig1 (b) shows the variation of percentage of occurrence of cirrus clouds of different geometrical thickness in the years 2009 and it can be seen that about 60% of the cirrus clouds formed are thin with geometrical thickness varying from 1to2 km. As only 15 days are available during the observation period, they are considered as individual cases. No seasonal behaviour can be attributed with this limited data. The satellite observations were also compared on similar days. Analysis and results are described below.
3.1. Macrophysical characteristics
The vertical distribution of cloud is essential for climate studies because of its impact on the radiative forcing of the atmosphere. The average height of the tropopause at the station is observed to be 16km. The tropopause height was calculated with radiosonde data obtained simultaneously along with the lidar observation at the station.
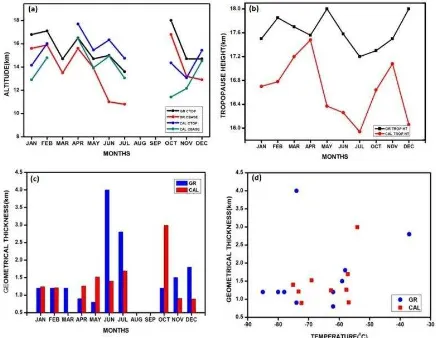
Figure 2-(a) the monthly variation of cloud base and top heights, (b) tropopause height, (c) geometrical thickness and
(d) it’s variation with mid cloud temperature
Figure2 (a) shows the monthly variation of the cloud base and cloud top and fig(b) the tropopause height for the two lidar systems. It is observed that the top height of cirrus clouds has high values in the month of February and October. The highest value of cirrus top height is observed in October. It can be seen that the cirrus clouds have higher values of base height in the months of February, April, and October during the observation period, with the highest value of base height observed in
thin cirrus (τc < 0.03) is mostly close to the tropopause height
and is in agreement with previously reported results (Dowling and Radke, 1990; Prabhakara, 1988, 1993; Winker and Trepte, 1998).
The International Archives of the Photogrammetry, Remote Sensing and Spatial Information Sciences, Volume XL-8, 2014 ISPRS Technical Commission VIII Symposium, 09 – 12 December 2014, Hyderabad, India
This contribution has been peer-reviewed.
Figure2(c) shows the monthly variation of the cloud geometrical thickness and fig 2(d) gives the variation with temperature. Cirrus clouds are generally observed in the altitude range from 8.4 to 14 km, with mid-cloud temperature
ranging from −700 C to −280
C. Out of the 15 nights of observation the cloud thickness varied from 0.8 to 4 km. Almost 80 % of the observation time, the cirrus occurrence height is in the range of 12to 17 km, and the temperature of the
cloud is around −370
C to -850 C. The mixing processes of the air in the atmosphere affect the thickness of the cloud and sometimes its decay also (Platt, 1989).
In order to have a direct comparison of the occurrence heights of cirrus clouds obtained by Caliop with the observations by the ground based lidar system, the data taken for the study was filtered for thin cirrus clouds only. The cloud base altitude in Fig.1 shows that most of the cloud observed was in the region between 11 to16 km. The frequency of high altitude clouds is high during the monsoon periods of June to October. The ground based station is close to the Bay of Bengal. The cloud height enhancement is also seen in the period December to February. This may be due to the convention activities like double Inter Tropical Convergence Zone (ITCZ) (Meenu, 2007) and Brewer Dobson circulation prevailing in that period. The observed cirrus height and distribution observed during the period are generally in agreement with the previous data reported earlier for different geographical locations Wang et al., (2002).
3.2. Optical properties
Figure 3(a) shows the monthly variation of optical depth of the observed thin cirrus clouds. Optical depth is a crucial parameter concerning the radiation and scattering process of the cloud. The observed variability in optical depth depends on the composition and thickness of the cloud. It is observed that optical depth increases with the thickness of the cloud. Figure 3(b) shows that lower temperature clouds (T > -700C) are mostly thin clouds optical depth τ<0.3. Since the average tropopause temperature is approximately -790C, cirrus clouds in that region are generally optically thin (Nee, 1998).
Figure 3-(a) the variation of optical depth against geometrical thickness and (b) temperature
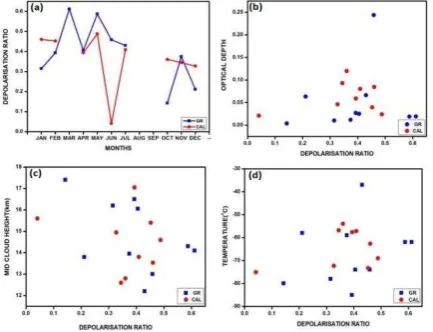
Theoretically, the depolarization of the spherical droplets should be zero. In the cases of water clouds with an ice crystal precipitation, the non-zero values of depolarization ratio can be explained by the presence of ice. Because the water cloud is precipitating ice, there has to be some ice mixed with water in it. Figure 4(a) represents the monthly evolution of depolarization ratio of cirrus cloud observed in the year 2009.The depolarization has relatively high values during the summer period. The relationship between depolarization ratio and optical depth is shown in figure4 (b). Most of the thin cirrus clouds have relatively high depolarization values. Figure 4(c) shows the height dependence of depolarization ratio. The
scattered depolarization values show an increasing tendency in the height region between 12 and 16km and above that there is a decreasing tendency. Most of the thin cirrus clouds having depolarization values 0.3 and 0.4 are situated in the region of temperature range from 70 to -50 0C and as shown in figure 4(d).
Figure 4-(a) the monthly variation of depolarization ratio and its variations against (b) optical depth,(c) mid cloud height and
(d) mid cloud temperature
Figure 5(a) shows the monthly variation of lidar ratio during the observational period. Here the single scattering effects only are considered. It is noted that the lidar ratio of thin cirrus was scattered in the 14-28 sr range in most of the cases. Figure 5(b) shows a scatter plot depicting the variation in cirrus optical depth and lidar ratio. Also it is found that the lidar ratio has the peak value when optical depth values are less than 0.05.
Figure 5-(a) the monthly variation of lidar ratio and its variations against (b) optical depth
4. CONCLUSION
The variation of the properties of cirrus clouds during 2009 over the tropical station Gadanki (13.50N, 79.20E), Andhra Pradesh, India was studied using ground based and satellite based measuring techniques. The monthly evolution of the optical properties, their relationships and their dependence with height and temperature were also investigated.
REFERENCES
Liou, K.N., 1986. Influence of cirrus clouds on weather and climate processes: a global perspective, Mon. Weather Rev, 114, pp.1167–1199.
Lynch, D.K., 2002. Cirrus: history and definitions. In: Lynch, D.K., Sassen, K., Starr, D.O., Stephens, G. (Eds.), Oxford University Press, New York, pp. 3–10.
The International Archives of the Photogrammetry, Remote Sensing and Spatial Information Sciences, Volume XL-8, 2014 ISPRS Technical Commission VIII Symposium, 09 – 12 December 2014, Hyderabad, India
This contribution has been peer-reviewed.
Stephens, G.L., Tsay, S.C., Stackhouse, P.W., Flatau, P.J., 1990. The relevance of the microphysical and radiative properties of cirrus clouds to climate and climatic feedbacks, J. Atmos. Sci, 47, pp.1742–1753.
Chen, T., Rossow,W.B., Zhang, Y., 2000. Radiative effects of cloud-type variations, J. Clim, 13, pp.264–286.
Fu, Q., Liou, K.N., 1993. Parameterization of the radiative properties of cirrus clouds, J. Atmos. Sci,50, pp.2008–2025.
Sassen.K., and Cho,B.S.,1992. Sub visual thin cirrus lidar data set for satellite verification and climatological research, J. Appl. Meteorol, 31, pp.1275.
Sassen, K., and Campbell,J.R., 2001. A mid latitude cirrus cloud climatology from the Facility for Atmospheric Remote Sensing. Part I: Macrophysical and synoptic properties, J. Atmos. Sci., 58, pp. 481–496.
Krishnakumar V, Reji K. Dhaman, Jayeshlal G S, Motty G S, Malladi Satyanarayana, Mahadevan Pillai V P, Raghunath K, Venkata Ratnam M, Ramakrishna Rao D, Sudhakar P and Radhakrishnan S R,2014. Lidar Investigations on the Optical and Dynamical Properties of the Cirrus Clouds in the UTLS Region at a Tropical Station Gadanki, India (13.5°N, 79.2°E), J. Appl. Remote Sens, 8 (1) 083659.
David,R , Dowling, L F Radke,L.F. ,1990. A summary of the physical properties of cirrus cloud, Journal of Applied Meteorology.29, pp.970.
Prabhakara, C., Fraser.R.S., Dalu,G., Wu,M.C., Curan,R.J., and Styles,T. .,1988. Thin cirrus clouds; Seasonal distribution over oceans deduced from Nimbus-4 IRIS, J. Appl. Meteorol., 27, PP. 379-399.
Winker D.M., Trepte,C.R., 1998. Laminar cirrus observed near the tropical tropopause by LITE, Geophys.,Research Letters,25,pp.3351-3354.
Platt, C.M.R., Spinhirne,J.D. and Hart,W.D., 1989. Optical and microphysical properties of a cold cirrus cloud: Evidence for regions of small ice particles, Geophys. Res., 94, pp.11151-11164.
Meenu,S.,Rajeev,K.,Parameswaren,K., Suresh Raju,C.,2007. Charecteristics of double Inter tropical Convergence zone over the tropical Indian Ocean J. Geophys. Res.,112 D11106.
Wang, Z. and Sassen, K.,2002. Cirrus cloud microphysical property retrieval using lidar and radar measurements. Part II: Midlatitude cirrus microphysical and radiative properties, J. Atmos. Sci. 59, pp.2291–2302.
Nee, J. B., Len,C.N., Chen,W.N., and Lin,C.I.,1998. Lidar observation of the cirrus cloud in the tropopause at Chung-Li (258N, 1218E). J. Atmos. Sci. 55, pp.2249–2257.
The International Archives of the Photogrammetry, Remote Sensing and Spatial Information Sciences, Volume XL-8, 2014 ISPRS Technical Commission VIII Symposium, 09 – 12 December 2014, Hyderabad, India
This contribution has been peer-reviewed.