CHARACTERIZING MULTI-DIMENSIONALITY OF URBAN SPRAWL IN JAMNAGAR,
INDIA USING MULTI-DATE REMOTE SENSING DATA
Gaurav Jaina,*, Shashikant Sharmaa, Anjana Vyasb, A. S. Rajawata
a
Space Applications Centre, Indian Space Research Organisation, Ahmedabad, India - (gvj, sasharma, asrajawat)@sac.isro.gov.in b
Faculty of Technology, CEPT University, Ahmedabad, India - [email protected]
Technical Commission VIII
KEY WORDS: Urban Sprawl, Sprawl Metrics, GIS, Multi-date Remote Sensing, Leapfrog development
ABSTRACT:
This study attempts to measure and characterize urban sprawl using its multiple dimensions in the Jamnagar city, India. The study utilized the multi-date satellite images acquired by CORONA, IRS 1D PAN & LISS-3, IRS P6 LISS-4 and Resourcesat-2 LISS-4 sensors. The extent of urban growth in the study area was mapped at 1:25,000 scale for the years 1965, 2000, 2005 and 2011. The growth of urban areas was further categorized into infill growth, expansion and leapfrog development. The city witnessed an annual growth of 1.60% per annum during the period 2000-2011 whereas the population growth during the same period was observed at less than 1.0% per annum. The new development in the city during 2000-2005 time period comprised of 22% as infill development, 60% as extension of the peripheral urbanized areas, and 18% as leapfrogged development. However, during 2005-2011 timeframe the proportion of leapfrog development increased to 28% whereas due to decrease in availability of developable area within the city, the infill developments declined to 9%. The urban sprawl in Jamnagar city was further characterized on the basis of five dimensions of sprawl viz. population density, continuity, clustering, concentration and centrality by integrating the population data with sprawl for year 2001 and 2011. The study characterised the growth of Jamnagar as low density and low concentration outwardly expansion.
* Corresponding author.
1. INTRODUCTION
Urban sprawl has become a major concern for cities in developing countries such as India, where urban growth has far outpaced the planning interventions. The urban population of India, which currently accounts for 31.16% of the total population, is expected to reach 40% by 2030 (MGI 2010). The past decade alone witnessed the unprecedented growth in number of census towns from 5161 in 2001 to 7935 in 2011. The term ‘Urban sprawl’ generally refers to the low density development beyond the borders of a city.“Sprawling”, which means the spreading of urban area towards rural area surrounding it, is characterized by the scattered, unplanned and haphazard developments, often resulting into loss of open rural areas, single function settlements, automobile dependent societies, and inefficient land utilisation. Urban sprawl may be attributed to several factors, but the dominant amongst those are the excessive crowding of the cities, increase in land value, and inability of land to perform its functions, leading to immigration of the urban population and the functions to the suburbs. Measurement of sprawl therefore assumes greater significance not only towards revival of the unplanned and haphazard outgrowths, but also for improving the efficiency of land use, which has its repercussions on the health and well-being of urban population (Moghadam and Helbich 2013). Space-based earth observation systems serve as a primary source of information for monitoring urban growth and measuring the extent of sprawl in cities due to its broad spatial coverage, repetitive and unobstructed updating capability, and self-consistent measurements of physical properties (Miller and Small 2003).
Multi-date remote sensing data has been widely used for mapping and monitoring of urban growth. While these studies
The measurement of sprawl and its quantification using sprawl metrics can be used for characterising the urban sprawl. Harold et al (2003), however cautions that the absolute values of landscape metrics depend upon spatial resolution, and the extent of the study area. Furthermore the correlation across multiple measures of sprawl (Sudhira et al 2004) is not desirable in estimation of composite urban sprawl index. The computation of urban sprawl metrics is further restricted by the availability of socio-economic and other ancillary data, which in Indian cities is largely limited to Census of India. This study intends to characterise the urban sprawl in Jamnagar city of Gujarat with a view to understand the dynamics of urban development in large Indian cities and the pattern of their growth. The study measures the growth of built up area and the type of new development in Jamnagar city at 1:25,000 scale using multi-date remote sensing data. Furthermore, by integrating sprawl with population data from Census of India, five dimensions of sprawl, namely density, continuity, concentration, clustering and centrality are computed for the years 2001 and 2011.
The paper is organized in to six sections. Section 1 introduces the concept of sprawl metrics along with few case studies of application of the metrics. Section 2 provides a brief account of the study area and its location. The data used for the study are listed in section 3. The methodology and equations used for the classification of new development and derivation of various dimensions of sprawl are given in section 4. The results of the sprawl metrics over Jamnagar city including characterisation of its growth are discussed in Section 5, which is followed section 6 concluding the major findings of the study and the possibility of application of the study in urban planning.
2. STUDY AREA
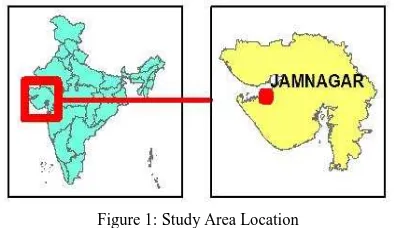
Jamnagar is the coastal city located south of the Gulf of Kutch in the Gujarat state of India as shown in Figure 1. The city with population of 529,308 is the fifth largest city of Gujarat. Jamnagar, which was earlier known for the manufacturing of brass items, is now globally recognised for its Oil Refineries, notably the one owned by Reliance Industries Ltd. The city, with its 19 municipal wards is spread over 34.10 km2area. It is governed by Jamnagar Municipal Corporation. Jamnagar Area Development Authority (JADA) is primarily responsible for the preparation of development plan for Jamnagar Urban Agglomeration area, which in addition to Jamnagar Municipal Corporation also includes 26 villages of Jamnagar Taluka, thereby covering an area of 285 km2.
Figure 1: Study Area Location
The study area includes Jamnagar Municipal Corporation and other urban settlements of Jamnagar Urban Agglomeration including Navagam Ghed (Municipality), Bedi (Census Town), and Vibhapar (Out Growth) along with 17 adjoining village settlements where urban areas can potentially sprawl. The total
geographical area of the study area is 339.47 km2 with population of 667,852 (Census of India, 2011).
Figure 2: Study Area
3. DATA USED
The study utilized multi-date images primarily acquired by the Indian Remote Sensing Satellites. The Aft image of the high resolution stereo images acquired by CORONA satellite was also used for mapping urban extent for the year 1965. The details of the satellites, sensor, spatial resolution and date of acquisition of the images are provided in Table 1. Primary Census Abstract published by the Census of India corresponding to year 1961 to 2011 was referred to obtain the demographic data. Village boundaries as mapped under the project Natural Resources Information System were obtained from the National (Natural) Resources Database (NRDB), through the National Natural Resources Management System (NNRMS) Portal (ISRO 2014).
Table 1: Data Used
Sr. No.
Satellite Sensor Spatial Res. (m)
Date of Acquisition 1 Resourcesat-2 LISS-4 5.8 06/12/2011
2 IRS P6 LISS-4 5.8 02/03/2005
3 IRS 1D PAN 5.8 14/02/2000
4 IRS 1D LISS-3 23.0 01/03/1999
4 CORONA Aft 4.5 13/10/1965
4. METHODOLOGY
were not developed in the year 2005. The same procedure was repeated for mapping built-up area in year 2000 and 1965. This procedure avoided creation of sliver polygons during change analysis as well as potential errors due to miss-registration of multi-date images.
The built-up area of 2000, 2005 and 2011 were used to classify the new development during 2000-2005 and 2005-2011 period. The Urban Landscape Analysis Tool (ULAT) developed by the Center for Land use Education and Research (CLEAR) of the University of Connecticut was used to classify the new development as infill, leapfrog or extension. The land cover of the study area was classified into four classes viz. urban area, water body, other areas, and no data, for year 2000, 2005, and 2011. The land cover was converted into raster dataset of 25.0 meter pixels size and provided as input to the ULAT tool. The ULAT tool computes the newly developed areas during each time period and classified it into infill, extension, and leap-frog development. The infill development is the development on the urbanised open land within the city. The new development that are in the fringe open land are marked as extension areas, whereas the newly developed areas that are outside the rural open land are classified as leapfrog developments.
The demographic data of all villages and urban areas in study area was obtained from the Census of India. The built-up area and population data was integrated in GIS environment to estimate net population density in each of the administrative unit using the equation (1).
i
persons per ha; Piand Uiare the population and built-up area in
ithadministrative unit.
The study area was sub-divided into two grids, the main grid of 1000 m × 1000 m, referred as M grid, and the smaller grid of 500 m × 500 m, referred as S grid which is of the quarter-size of M grid. The built-up area, administrative boundaries with population, and grid were integrated in GIS environment and population in each grid was computed using equation (2).
i
where, Tmis the population of m th
grid; Um,iis the built-up area
of administrative unit i in the mth grid; and Di is the net
population density of administrative unit i.
The grid-wise population is used to compute five dimensions of sprawl as given by Galster et al (2001). Development density is estimated as ratio of total population to the developable land area within the study area as given by equation (3).
u
where, Tuand Auare the total population and total developable
land area within the study area respectively. The continuity measures the degree to which the developable land has been built upon at urban densities in an unbroken fashion. The urban density in India is defined as 400 persons per km2. Thus the continuity is given as percentage of smaller grids which are developed at higher than urban density as given by equation (4).
S
Concentration measures the degree to which the development is located disproportionately in few areas as against being uniformly distributed. It is measured as the proportion of grids with very high density. The coefficient of variation of density as given by equation (5) is also used as measure of concentration.
M
development is tightly bunched so as to minimize the amount of land in each grid. The areas with low level of clustering tend to be uniformly spread all over the grid, and are thus considered as sprawls. The clustering index is estimated using equation (6).
developments are located close to the Central Business District (CBD). The CBD is of the city was identified as the oldest part of the city where most of the trade and commerce activities take place. The centrality dimension is computed using equation (7).
where F(k,m) is the distance of mthgrid from CBD. The lower
values of all these dimensions indicate the sprawl with regard to that particular dimension.
5. RESULTS AND DISCUSSION
The analysis of growth of Jamnagar city, quantification of the type of new development in the city and measurement of the dimensions of sprawl are discussed in the following sections.
5.1 Urban Growth
spread over an area of 2004.36 ha in 1965 has sprawled to 4596.08 ha area by 2011. The city witnessed an annual growth of 1.60% per annum during the period 2000-2011 whereas the population growth during the decade increased by less than 1.0% per annum.
Figure 3: Urban Sprawl (1965-2011) in Jamnagar
The growth trajectory of population of Jamnagar Municipal Corporation (including outgrowths) and the study area, and the built-up area in study region is shown in Figure 4. The city witnessed population growth of 45% during 1991 to 2001 period primarily due to the installation of oil refinery by Reliance Industries during late 1990's. While there was a marginal decline in the construction activity in Jamnagar city during the 2000-2005 period, it gained momentum at the later part of the decade. The data at 1:25,000 scale was not available during the period from 1965 to 2000, and thus the actual growth trajectory during that period is also not known.
Figure 4: Population and Urban Growth in Jamnagar
5.2 New Development
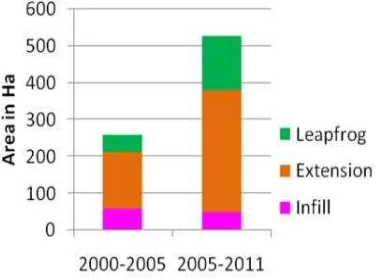
The new development of the study area during the 2000-2005 and 2005-2011 timeframe was categorized into infill growth, expansion and leapfrog development as shown in Figure 5. It
was observed that new development of 259.38 ha during 2000-2005 comprised 22% as infill developments, 60% as expansion at the peripheral urbanized areas, while 18% as leapfrogged developments beyond the city limits. Interestingly, during 2005-2011 period, the proportion of new development in form of leapfrogging increased to 28% whereas with the decrease in availability of developable area within the city, the infill developments declined to 9%. The outwardly expansion at peripheral open spaces of the city however continued at 63%. The new developments in the study area during 2005-2011 correspond to the extension of existing developments around Dared village, consequent to the industrial activities in GIDC Phase-2 along the National Highway and the Jamnagar Bypass.
Figure 5: Spatial Distribution of New Development
As shown in Figure 6, the infill development of the city is stagnant at around 58.25 ha during 2000-2005 and 48.13 ha during 2005-2011 time periods, but the growth in leapfrog development is three times of what it was in the previous period while the extension of the city at periphery has also doubled in terms of absolute area.
Figure 6: Proportion of Type of New Development
5.3 Dimensions of Sprawl
(pph) in year 2001 to 23.15 pph in 2011. The decline in density is a clear indicator of sprawl in the study area. The expectation of density of grids in the study area however increased marginally from 20.91 pph in 2001 to 22.6 pph in year 2011. It was further observed that in 2001, 19.72% of the grids had density above the urban densities of 400 persons per km2(or 4 pph). This increased to 24.35% in year 2011, thus showing that urbanisation is on rise in the region. This measure however contradicts the proposition of leapfrog development which would have resulted into decline in the proportion of grids with urban densities of less than 4 pph. Galster et al (2001) however considers the grids as developed grids if it has more than 10 housing units per one-half-mile-square grid, which is equivalent to 0.8 pph. The proportion of grids with density less than the developed area density of 0.8 pph increased from 22.7% in 2001 to 28.3% in 2011. The continuity of development has therefore increased between the years 2001 to 2011.
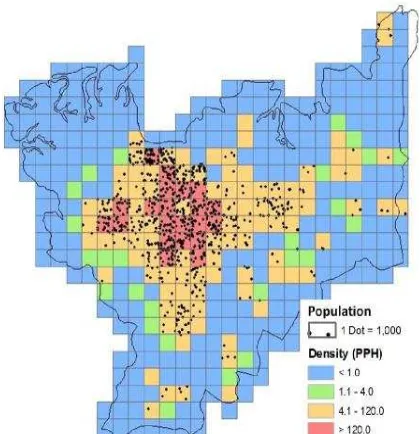
Figure 7: Gridded Population Distribution and Density (2011)
The concentration of population is indicated by the proportion of grids with very high population density. The high-population density grids are identified as the grids with population density more than the sum of mean grid-density and two times its standard deviation. Thus for Jamnagar, the grids with population density above 120 pph were considered as very high density grids. The study area had 6.28 % grids with very high population density in year 2001 which increased marginally to 6.81 % by 2011. The covariance index in population density as computed by equation (5) however declined to 1.88 in year 2011 from 2.14 in 2001. This shows decline in population concentration.
The clustering index during the year 2001 and 2011 as computed by equation (6) were 0.43 to 0.41 respectively, shown very little variation. The centrality index, as computed from using equation (7), however showed significant decline from 5.05 in year 2001 to 4.82 in year 2011, further confirming the outwardly expansion of the city. The sprawl in Jamnagar city can be characterised by the low density and low concentration outwardly expansion of urban footprint. The observations are in line with the increase in proportion of leapfrogged development in the growth of city.
6. CONCLUSION
This study demonstrated the approach for measurement and characterization of urban sprawl using its multiple dimensions in the Jamnagar city. The remote sensing data provided repetitive and consistent measurements at 1:25,000 scale of the urban extent for the years 1965, 2000, 2005 and 2011. The study observed that the city witnessed an annual growth of 1.60% per annum during the period 2000-2011 whereas the population growth during the same period was observed at below 1 % p.a. The new development in the city during 2000-2005 time period comprised of 22% as infill development, 60% as expansion at the peripheral urbanized areas, and 18% as leapfrogged development. However, during 2005-2011 period the proportion of leapfrog development increased to 28% whereas with the decrease in availability of developable area within the city, the infill developments declined to 9%. This continuous and uncontrolled increase in leapfrog development is a warning to expedite the pace of implementation of development plans in order to prevent the loss of rural open spaces, high costs of infrastructure development and extension, and fragmented urban structure. The development plan of the city should therefore address the need to increase densities in the city, encourage greater degree of concentration of population, and discourage developments away from the city.
ACKNOWLEDGEMENTS
The authors would like to thank Shri A.S. Kiran Kumar, Director– Space Applications Centre, for all the support and guidance during the course of this study. We would also like to express our sincere gratitude to Dr. P. K. Pal, Dr. Manab Chakraborty and Mr. Tapan Misra for their valuable inputs. We also acknowledge the support of Ms. Jui Vohra, Ms. Shaily Gandhi and Mr. Abhinav Shukla.
REFERENCES
Angel, S., Parent, J., Civco, D., 2007. Urban sprawl metrics: an analysis of global urban expansion using GIS. ASPRS 2007 Annual Conference, Tampa, Florida May 7-11, 2007.
Ewing, R., Pendall, R., and Chen, D., 2002. Measuring Sprawl and its Impacts, Smart Growth America, Washington D.C.
Galster, G., Hanson, R., Ratcliffe, M. R., Wolman, H., Coleman, S., and Freihage. J., 2001. Wrestling sprawl to the ground: Defining and measuring an elusive concept. Housing Policy Debate, 12, pp 681-717.
Herold, M., Goldstein, N. C., and Clarke, K. C., 2003. The spatiotemporal form of urban growth: measurement, analysis and modelling. Remote Sensing of Environment, 86, pp. 286-302.
Indian Space Research Organisation (ISRO), 2014. National Natural Resources Management System (NNRMS) Portal, www.nnrms.gov.in.
MGI. 2010. India's urban awakening: Building inclusive cities, sustaining economic growth. McKinsey Global Institute.
Miller, R. B., and Small C., 2003. Cities from space: potential applications of remote sensing in urban environmental research and policy. Environmental Science & Policy, 6, pp. 129–137.
Moghadam, H. S. and Helbich, M., 2013. Spatiotemporal urbanization processes in the megacity of Mumbai, India: A
Markov chains-cellular automata urban growth model. Applied Geography, 40, pp. 140-149.