ORIENTATION MODELING FOR AMATEUR CAMERAS BY MATCHING IMAGE
LINE FEATURES AND BUILDING VECTOR DATA
C. H. Hung a, W. C. Chang b, *, L. C. Chen c
a
Dept. of Civil Engineering , National Central University, Taiwan - [email protected] b Dept. of Civil Engineering , National Central University, Taiwan - [email protected] c
Center for Space and Remote Sensing Research, National Central University, Taiwan - [email protected]
Commission III, WG III/1
KEY WORDS: Direct Georeferencing, Feature Line Matching, Line Control, Orientation Modeling, Orientation Parameters
ABSTRACT:
With the popularity of geospatial applications, database updating is getting important due to the environmental changes over time. Imagery provides a lower cost and efficient way to update the database. Three dimensional objects can be measured by space intersection using conjugate image points and orientation parameters of cameras. However, precise orientation parameters of light amateur cameras are not always available due to their costliness and heaviness of precision GPS and IMU. To automatize data updating, the correspondence of object vector data and image may be built to improve the accuracy of direct georeferencing. This study contains four major parts, (1) back-projection of object vector data, (2) extraction of image feature lines, (3) object-image feature line matching, and (4) line-based orientation modeling. In order to construct the correspondence of features between an image and a building model, the building vector features were back-projected onto the image using the initial camera orientation from GPS and IMU. Image line features were extracted from the imagery. Afterwards, the matching procedure was done by assessing the similarity between the extracted image features and the back-projected ones. Then, the fourth part utilized line features in orientation modeling. The line-based orientation modeling was performed by the integration of line parametric equations into collinearity condition equations. The experiment data included images with 0.06 m resolution acquired by Canon EOS Mark 5D II camera on a Microdrones MD4-1000 UAV. Experimental results indicate that 2.1 pixel accuracy may be reached, which is equivalent to 0.12 m in the object space.
* Corresponding author
1. INTRODUCTION
With the popularity of geospatial applications, 3D GIS database has become an indispensable information infrastructure worldwide. Thus, the updating of the database is getting important due to the environmental changes over time. Imagery provides a lower cost and efficient way to update the database. Three dimensional objects can be measured by space intersection using conjugate image points and orientation parameters of cameras. GPS and IMU may provide camera orientation for direct georeferencing. However, precise orientation parameters of light amateur cameras are not always available due to their costliness and heaviness of precision direct georeferencing systems. On the other hand, it is observed that the unchanged objects in 3D GIS database can be used as control data to improve the accuracies of georeferencing.
The control entities are used to obtain the orientation parameters in orientation modeling. The control information may be categorized as point-based control (Wolf and Dewitt, 2000), line-based control (Habib et al., 2003a) and combined control (Teo and Chen, 2010; Zang et al., 2008). Point features take advantage of geometrical invariability, but it might yield ambiguities in object-image point correspondence due to lacking of interrelated information among points. On the other hand, line features provide topological information for orientation modeling. To automatize data updating, the correspondence of object vector data and image may be built
and used as control to improve the accuracy of direct georeferencing.
In this study, we established a procedure of image orientation modeling by feature line matching. The proposed scheme integrated line parametric equations and collinearity equations in the orientation determination. We also compared point-based and line-based equations. In addition, image orientation determination with image-object line matching was performed. The experiment data included images with 0.06 m resolution acquired by Canon EOS Mark 5D II camera on a Microdrones MD4-1000 UAV.
2. MEHODOLOGIES
The purpose of this study is to determinate orientation of amateur camera, and focus on the matching image line features and building vector data. This study contains four major parts, (1) back-projection of object vector data, (2) extraction of image feature lines, (3) object-image feature line matching, and (4) line-based orientation modeling.
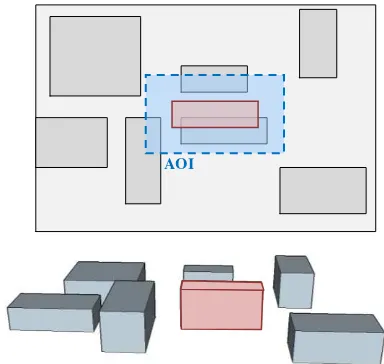
2.1 Back-projection of Object Vector Data
In order to construct the correspondence of features between an image and a building model, the building vector features were back-projected onto the image using the initial camera orientation from GPS and IMU. Considering the error of GPS
The International Archives of the Photogrammetry, Remote Sensing and Spatial Information Sciences, Volume XLI-B3, 2016 XXIII ISPRS Congress, 12–19 July 2016, Prague, Czech Republic
This contribution has been peer-reviewed.
and IMU, we select a buffer zone around the back-projected features for the matching AOI.
2.2 Extraction of Image Feature Lines
In this part, Canny operator (Canny, 1986) and Hough transform (Hough, 1959) are selected for image line feature extraction. In order to reduce the numbers of extracted features and image-object correspondence possibility, we extract features from the image inside the matching AOI selected in the previous step.
2.3 Object-image Feature Line Matching
The feature matching procedure is done by similarity assessment and geometric check. Similarity assessment picks the features similar to the back-projected ones as candidate features. Geometric check select the best match features from candidate ones. Therefore, both rectangles and line segments can use for similarity assessment. In the case of rectangle features, which are composed by extracted line features, we assess the similarity between those composed rectangles and the back-projected features to pick candidate rectangles which are similar to back-projected ones. The similarity assessment analyzed and compared the size and the shape of features. On the other hand, the similarity of line features utilized the directions of lines. Afterwards, each of the candidate features was examined geometrically by employing the orientation modeling to select the best match.
2.4 Line-based Orientation Modeling
To utilize line controls for orientation modeling, we integrate line parametric equations into the collinearity condition equations. Each expressed image line is expressed in line parametric equations. Line parametric equations, shown in Equation 1, use a start point, direction vector and scales to characterize the points on an image line.
(1)
where xi, yi = a point on an image line x0, y0 = a start point of the image line Sx, Sy = direction vectors of the image line ti = scale vector of the point
The basic collinearity condition equations describe the situation of a camera perspective center, an image point and its correspondence object point which are on a line. To utilize lines for orientation modeling, we integrate line parametric equations into the basic collinearity condition equations. The integration equations are shown in Equation 2. Figure 2 shows the geometry of line-based orientation modeling.
(2)
where f = focal length
m11~m33 = rotation matrixes Xi, Yi, Zi = an object point
XC, YC, ZC = position of perspective center
Noted that the proposed method employed line control, the correspondences of end points of a line are not needed. To expedite the procedure, we use one building and lower resolution image to pull-in the orientation parameters first, so that the range of matching AOI in the next iteration can be narrowed, the number of combinations for feature matching is also decreased.
3. EXPERIMENTS
The experiment comprised two parts, (1) orientation modeling by line matching and (2) comparison of point and line control. The first part shows the results of entire procedure. The second part compared orientation modeling using different control entities without considering feature matching effect.
3.1 Orientation Modeling by Line Matching
This experiment pull-in the orientation by one building at first, then used more features as control to get the results.
Image Line Object Line Camera Perspective Center
AOI
Figure 1. Building model back-projection
Figure 2. Line-based orientation modeling
The International Archives of the Photogrammetry, Remote Sensing and Spatial Information Sciences, Volume XLI-B3, 2016 XXIII ISPRS Congress, 12–19 July 2016, Prague, Czech Republic
This contribution has been peer-reviewed.
3.1.1 Experiment Data: The image with 0.06 m ground resolution was acquired by Canon EOS Mark 5D II camera on a Microdrones MD4-1000 UAV. The image size was 5616 x 3744 pixels. There were 17 control lines and 29 independent check points in this experiment. The experiment data included an UAV image with build vector data. Figure 3 shows the distribution of control features. The accuracies of building vector data were about 0.10 m.
━ Control lines □ Check points Figure 3. Distribution of control features
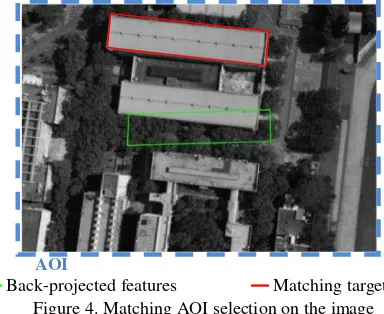
3.1.2 Experiment Results: To quick pull-in the initial image orientation, we reduced the image resolution and used one significant building for orientation modeling at first. Figure 4 shows the matching AOI on the 1/8 resolution image for quick pull-in. The pre-knowledge of the accuracy of initial UAV orientation was equivalent to 750 pixels in the image space. Consider to the error of initial orientation, a 1000 pixel buffer zone for 80% confidence interval was selected in this stage. The lower resolution image kept features which were more significant so that the number of correspondence possibility could be reduced even within a larger AOI.
AOI
━ Back-projected features ━ Matching target Figure 4. Matching AOI selection on the image
After preliminary pull-in, the back-projected features could be close to the correspondence features on the image. Therefore, we could reduce the buffer zone size for matching AOI and the number of extracted features was also reduced. In that case, the lines which cannot compose rectangles can be used for line matching within a smaller AOI. The accuracy was improved to 90~110 pixels, hence the buffer zone size of AOI could be downsized to 150 pixels. Figure 5 shows the positions of control lines back-projected on the full resolution image using the orientation after pull-in.
━ Back-projected features ━ Matching target Figure 5. Back-projected features after pull-in
We used one rectangle to pull-in the orientation on 1/8 resolution image. The RMSE were 100.4 pixels and 25.8 pixels in x and y direction. Afterwards, we back-projected the 17 object line features on the full resolution image, the results were 1.4 and 2.1 pixel. Table 1 shows the results of this experiment.
Preliminary Pull-in
Modeling Results
Image Resolution 1/8 Full
Number of Control Features
1 Rectangle
(4 Lines) 17 Lines
RMSEx 100.4 1.4
RMSEy 25.8 2.1
Units: pixels (full resolution)
Table 1. Experiment results
3.2 Comparison of Point and Line Control
To validate the geometric fidelity, orientation modeling using point control and line control were compared without considering feature matching effect. The image-object correspondence was manually measured in this part.
3.2.1 Experiment Data: The image and building vector data were same to the previous experiment. The image resolution was 0.06 m. The accuracies of building vector data were about 0.10 m. There were 8 control points, 15 control lines and 29 independent check points in this experiment.
△ Control points ━ Control lines □ Check points Figure 6. Distribution of control features
The International Archives of the Photogrammetry, Remote Sensing and Spatial Information Sciences, Volume XLI-B3, 2016 XXIII ISPRS Congress, 12–19 July 2016, Prague, Czech Republic
This contribution has been peer-reviewed.
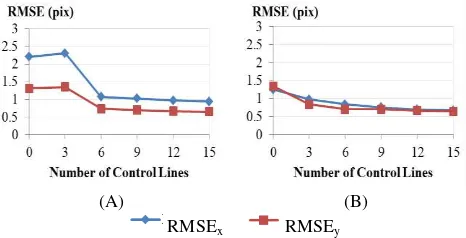
3.2.2 Experiment Results: The cases using point control only and line control only are shown in Figure 7. Figure 7(A) used 3~8 ground control points(GCPs) for orientation modeling, the RMSE of check points were about 1.3 pixel in both x and y direction. Figure 7(B) shows the results using 3~15 control lines. In spite of the RMSE were over 3 pixels using 3 control lines, the RMSE reached 0.5 and 0.7 pixel with 15 control lines.
(A) (B)
RMSEx RMSEy
Figure 7. Error statistics: (A) point control (B) line control
In the previous cases, we found that enough number of control lines could provide accurate results. Afterwards, we tested the cases of using additional line controls into point-base orientation modeling. Figure 8(A) shows the results of 3 GCPs with additional 3~15 control lines and (B) shows the cases of 6 GCPs. From Figure 8 we found those additional control lines improved the results of point-based orientation modeling.
(A) (B)
RMSEx RMSEy
Figure 8. Results of line control with (A) 3 GCPs (B) 6 GCPs
4. CONCLUSIONS
In this study, we proposed a scheme to obtain orientation parameters by matching image line features and building vector data. The initial UAV orientation provided an initial value for pull-in so that the size of AOI buffer zone could be declined. A narrow buffer zone decreased the number of possibility correspondence. The comparison of point and line control showed line controls can perform accurate results and improve the accuracy of point-based orientation modeling. The higher accuracy results may be expected, provided that the more precise building models become available.
ACKNOWLEDGEMENTS
This investigation was partially supported by the Ministry of Science and Technology of Taiwan under Projects No. MOST104-2119-M-008-023t.
REFERENCES
Canny, J., 1986. A Computational Approach to Edge Detection, IEEE Transactions on Pattern Analysis and Machine Intelligence, Vol. PAMI-8, pp. 679-698.
Habib, A., Lin, H. T. and M. Morgan, 2003a. Autonomous space resection using point- and line-based representation of free-form control linear features. The Photogrammetric Record, 18(103), pp. 244-258.
Hough, P. V. C., 1959. Machine Analysis of Bubble Chamber Pictures. Proc. Int. Conf. High Energy Accelerators and Instrumentation.
Teo, T. and Chen, L., 2010. Registration of 3-D models and a 2-D image using point and line features. International Archives of Photogrammetry and Remote Sensing, Vol. XXXVIII, pp. 251-256.
Wolf, P. R. and Dewitt, B. A., 2000. Elements of Photogrammetry: with Applications in GIS.
Zhang, Z., Zhang, Y., Zhang, J., and Zhang, H., 2008. Photogrammetric modeling of linear features with generalized point photogrammetry. Photogrammetry Engineering & Remote Sensing, 74(9), pp. 1119-1127.
The International Archives of the Photogrammetry, Remote Sensing and Spatial Information Sciences, Volume XLI-B3, 2016 XXIII ISPRS Congress, 12–19 July 2016, Prague, Czech Republic
This contribution has been peer-reviewed.