QUALITATIVE SCREENING METHOD FOR IMPACT ASSESSMENT OF UNCERTAIN
BUILDING GEOMETRY ON THERMAL ENERGY DEMAND PREDICTIONS
P. Wate a, b, V. Coors a, D. Robinson b, M. Iglesias c
a Centre for Geodesy and Applied Informatics, Stuttgart University of Applied Sciences, 70174 Stuttgart, Germany - (parag.wate, [email protected])
b Department of Architecture and Built Environment, University of Nottingham, NG7 2RD Nottingham, United Kingdom - [email protected]
c School of Mathematical Sciences, University of Nottingham, NG7 2RD Nottingham, United Kingdom - [email protected]
Commission VI, WG VI/4
KEY WORDS: Morris method, Qualitative ranking, Energy Demand, CityGML
ABSTRACT:
Virtual 3D models of cities are now being extensively employed for the estimation of thermal energy demand at varying spatial and temporal scales. Efforts in preparing and management of the datasets required for the simulations have reached an advanced stage. Thus allowing to perform city scale simulations using simplified thermal energy balance models. However, the uncertainty inherent in datasets and the reliability of their data sources are often not given due consideration. Such consideration to the uncertainty problem would need a paradigm shift in simulation practices from a single value assignment to uncertainty characterization followed by assessment of qualitative and quantitative impact on the simulation results. The proposed study establishes a mechanism to handle the uncertainty arising from the building geometry reconstruction process and its possible consequences on the thermal energy demand calculations.
1. INTRODUCTION
1.1 Background
Ambitious decarbonisation targets set in the urban energy field impose concerned stakeholders to promote utilization of energy efficient and low carbon technologies. Simulation studies particularly on predictions of the energy demand in buildings have guided planning, management and implementation of these technologies. The conclusions derived have their own implications on the ways with which the low emission targets can be being achieved by selection of different strategies. Therefore, while planning and decision making on the urban energy relevant investments and sustainability, a value-added investigation on the current urban energy simulation practices in the context of involved uncertainties and their possible impacts on the energy-related decision making has been found to be crucial.
Energy flows in buildings satisfy energy service requirements - majority of them for space heating and cooling service. Several simulation studies have demonstrated the application of virtual 3D city models for the space heating demand estimations (Bahu et al. 2013) (Kaden and Kolbe 2013) (Eicker et al. 2012) (Carrión, Lorenz, and Kolbe 2010) (Strzalka et al. 2010). These studies involved typical data acquisition tasks for the simulation models and are progressing towards the establishment of efficient data management strategies. But, it is fact that the urban energy data management system provides a marginal expression about the uncertain and imprecision element inherent in the data. Moreover, the data preprocessing tasks also contribute to the uncertainty.
1.2 Motivation
Depending upon the data availability and the type of simulation model used, the range of required input data would vary largely from the coarse to fine granularities on both spatial and temporal scales. In general, the relevant information required pertains to the building geometry, construction and household compositions, and meteorology. In order to understand the uncertainty inherent in the input data, it is essential to know how a particular dataset is acquired, processed and assigned to the respective simulation input data parameter. For the scope of proposed study, we are only concerned about the uncertainty problem discussion related to building geometry.
Building models are reconstructed from different data sources such as cadastre maps, high resolution aerial images (Suveg and Vosselman 2004), airborne LiDAR (Verma et. al. 2006) and terrestrial laser scanning point clouds (El Meouche et al. 2013). For the reconstruction at urban scale, the building model is extracted automatically from the airborne LiDAR point clouds using model- and data-driven approaches ranging from basic (Maas and Vosselman 1999) to contemporary ones described in Haala and Kada (2010), Huang et. al. (2013). The aim of automatic reconstruction is to provide an error-free and water-tight 3D building geometry for different applications (Biljecki, Stoter, et al. 2015), including energy simulation. In reconstruction process, the acquired point cloud data undergoes transformation in three major steps: segmentation of building points, roof feature extraction and modeling, affecting the final quality of building models (Oude Elberink and Vosselman 2011). Thus the reconstructed building geometry may deviate from reality in terms of position, orientation, dimensions and the amount of details represented. Consequently, the simulation applications based on the geometry related data can have discrepancy in their predictions. Hence, the need for rigorous consideration of the uncertainty arising from the building
modeling process has been identified, which could eventually Error and uncertainty are often used interchangeably to measure the amount of discrepancy between a spatial data representation of reality and the reality itself. Gottsegen et. al. (1999) points out the minute difference between the two – error is a measure of absolute deviation from ground truth or true value while uncertainty as a measure of relative discrepancy due to lack of perfect knowledge about the phenomenon. Fisher (1999) proposed a conceptual model of uncertainty by categorising its nature and sources. He assumed uncertainty as broader term than error in describing the quality of spatial datasets.
The impact of input data quality on the outputs of GIS based models has been analysed using analytical (Taylor 1982) and numerical methods (Hammersley and Handscomb 1964). The studies reviewed in error or uncertainty propagation literature, differ in how the output discrepancy is computed i.e. namely in terms of variance (Lilburne and Tarantola 2009) and RMSE (Biljecki et al. 2015). We found variance based uncertainty and sensitivity analysis studies as more fundamental in addressing of the uncertainty issues faced in the assessment of building performance.
2.1 Spatial uncertainty in energy simulation studies
Uncertain building geometry problem in energy simulation studies has been given a limited consideration. Our focus is on the studies concerning the energy estimations of the buildings, as intent is to handle the impact of uncertainty arising from the building geometry reconstruction methods and modeling schemes. The presented review captures the different mechanisms with which the uncertainty in geometry had been identified and characterized for its use in respective sensitivity analysis studies.
Mechri et. al. (2010) have applied a quantitative method to identify the influential design variables affecting energy performance of office building design case under different climate conditions in Italy. The design configurations for an office floor were expressed in terms of orientation, compactness and glazing ratio variations, where glazing ratio dominated the energy performance. Hygh et al. (2012) considered a variation in building aspect ratio1 for cardinal direction orientations. The resultant eight scenarios for the office building were simulated along with other construction material property settings in four US climate zones. Silva and Ghisi (2014a; 2014b) proposed an uncertainty analysis methodology to account for the impact of level of building modeling, physical properties and also occupant related behaviour on the energy performance. The approach was limited to only 15 uncertain building models generated by simplifying internal zones and external façade geometry where uncertainty was reported with respect to the uncertain model rather than the basic geometry parameters. A more detailed study on the design variable setting of building form introduced horizontal (aspect ratio) and vertical proportion
1 Length to width ratio.
(stacking2) variations (Hemsath and Bandhosseini 2015). The different situations combining three aspect ratios, stacking (four shoe-box forms), orientation and roof types (flat, mono-pitched and gabled) were evaluated for understanding their impact on the energy performance of residential building where stacking was the most influential factor and roof type the least.
Although the demonstrated studies were comprehensive in comparing energy performances under the different building configurations, but they can be further improved by giving justifications behind the conduct of building geometry impact evaluation on the energy use. First, the degree of variation in architectural parameters was found to be quite wide which might seem less realistic when foreseen in the context of urban development plan. Second, equiprobable variations in the default range were assigned to the variables without considering the constraints of local weather conditions, trend in general morphological characteristics, etc. on the building architecture design. The way in which these constraints are considered in fact would vary from a designer to designer and are possibly the main cause of improbable variations. Third, as a consequence, the inherent variation or uncertainty in the variables had not been pragmatically characterised. Considering the ubiquitous use of virtual 3D city models for the simulations at varying spatial scales, the approaches presented in literature are found to be restrictive in identifying the sources of uncertainty and the corresponding assessment of possible impacts on the simulation results.
The objective of proposed study is to identify the most influential building geometry parameters affecting the thermal energy demand predictions. Thereby, propagating the amount of uncertainty present in them and then qualitatively ranking their impact on the annual energy demand.
3. PROPOSED METHODOLOGY
Models of building thermal energy demand predictions range from simplified energy balance equations to the detailed ones involving and solving of complex thermodynamic interactions between the building surface and mass components. Depending upon the model used, the nature of impact assessment study would vary. In proposed study, we are considering the simplified thermal energy balance model as a “systemic” black -box and then applying the qualitative measure for uncertain geometry impact analysis.
Uncertainty and sensitivity analysis (U&SA) techniques offer pragmatic treatment to the uncertainty in model predictions by providing understanding of model behaviour. The model input-output relationship can be investigated to reveal the additivity, linearity and monotonicity of the model. Uncertainty analysis quantifies the amount of uncertainty in the model output due to the uncertainties in its inputs. While, on other hand, sensitivity analysis provides measures to decompose the total uncertainty in the model output into the respective sources of uncertainty in model inputs. U&SA techniques can be classified into: (1) Qualitative measures are screening or ranking methods to identify the most influential inputs affecting the model results and (2) Quantitative measures to know by how much the given uncertain input is important than the other amongst their rankings. The comprehensive review and mathematical formulations of these measures are given in Saltelli et al. (2004;
2 Aspect ratio and volume of building form is kept constant by varying footprint area and height.
2008). We are proposing a three step methodology involving uncertainty identification, characterization and qualitative screening.
3.1 Uncertainty Identification
With the increase in point density of airborne laser scanning (ALS) datasets, the share of point clouds as a data source to the 3D reconstruction techniques has increased. Although techniques have become more accurate and robust, general problems still exist in data acquisition and modeling stages, discussed in Oude Elberink (2008). Height and planimetric discrepancies in ALS data acquisition occur due to data gaps, strip offsets and sensor noise. Modeling approaches add another layer of discrepancy during the process of building detection and roof feature extraction. Table 1 specifies possible sources of uncertainty in building parameters according to the sub-steps involved in reconstruction.
Table 1. Uncertainty sources in building parameters
Parameter Source
Vertex X Building segmentation and roof outline detection Vertex Y
Length Width
Orientation Ridge line extraction Eaves Height Roof step-edges extraction Ridge Height Intersection of roof planes
3.2 Uncertainty Characterization
Uncertainty characterization is a procedure of assigning a mathematical structure to the sources of uncertainty in order to describe the state of uncertain knowledge (Roy and Oberkampf 2011). The mathematical structure consists of probability distribution represented by random variables. The statistical parameters (mean μ and standard deviation ) of the distributions determine shape and value ranges of the structure. The amount of uncertainty can be expressed as either variance3 or entropy4 measures. Accounting for all the possible sources of uncertainty stated above, we assume normal distribution with a maximum deviation of 0.25 meter for planimetric vertex position and building dimensions (length, width and height), and a deviation of 2.5 decimal degrees in building orientation5 (Baltrusch and Fröhlke 2016).
3.3 Qualitative Screening
Qualitative measure consists of experiment design and the screening method. Experiment design is a sampling procedure to select the small number of points from marginal input distributions in such a way that they faithfully represent the whole input space. The model is executed at these evenly distributed sample points. Then, the screening method is employed to identify the most influential inputs or the groups containing influential inputs. In screening methods, the indicators about the influence of input xi on model output y are input on output, interaction effect determines the higher order influence involving interactions of xi with other inputs due to model non-linearity and non-additivity. The improved screening methods provide indicator to detect the model monotonicity. Here, the applicability of Morris design and screening method to our uncertainty problem is explored.
3.3.1 Morris design and method
Morris design is a type of One-At-Time (OAT6) design, where changes in input values are represented by the finite levels within an interval. The local measure of incremental ratios or elementary effect is computed at each of these levels accounting for the whole input space. The measures are averaged out to give the single effect independent of the selection of sample point. Morris (1991) proposed two sensitivity measures based on the elementary effect to determine whether the effect of xi on y is negligible, linear and additive or nonlinear and non-additive. Elementary effect and measures are defined as: k independent inputs xi, i = 1, 2…k define k-dimensional input space discretized into a p-level grid . For a given input xi, the elementary effect is defined as:
EEi =
The mean µi and standard deviation i estimates of distribution Fi represent sensitivity measures. While mean µi measures the overall influence of input on the output, i measures the collective effects of input due to non-linearity and/or interactions with other inputs. In simplest design, a computation of single elementary effect requires two sample points i.e. economy of design = ½, so for r EEs per k inputs result in 2rk model executions. The economy of design can be improved by building r random trajectories i.e. computing r EEs per k inputs from (k+1) sample points where each trajectory provides k EEs, one per input. So with efficient Morris design, the total simulation runs required are r (k+ 1) with the economy of design = k/ (k+ 1). Figure 1 illustrates a trajectory for k=2, p=4 and =2/3. Here, trajectory r=1, (k+1) = 3 sample points and model runs = 3 at X(1) [1/3,1] , X(2) [1,1] and X(3) [1,1/3]. For the case of non-uniform distributions, input is sampled in the quantiles space [0, 1] of the distributions and then actual values are obtained using the inverse function method.
6 OAT is a local method where model output is computed by changing the value of only one input between the consecutive pair of simulation runs.
The Morris method in current form is prone to type II errors7 - failing to identify the influential input. When underlying model exhibit a considerable non-monotonous response, the mean µi would measure negligible overall influence due to cancelling effects of the opposite polarity elements. Alternatively, Morris suggested to study both µi and i measures simultaneously with a graphical representation in (µ,) plane. Although the µi would measure negligible, but i measure would certainly capture the variability in elementary effects. However, this approach has been found to be impractical in case of large models having multiple outputs.
Campolongo et. al. (2007) defined improved Morris measure µi* as the mean estimate of distribution Gi of absolute values of the elementary effect |EEi|. µi* measure is suitable for the models with several uncertain inputs and multiple outputs. This improved model independent measure is robust against type II errors providing realistic ranking of inputs. Efficient Morris design based generation of trajectories is susceptible to non-uniform representation of input space due to small fixed number of random trajectories. This leads to the biased estimates of the sensitive measures when inputs involved are highly uncertain. Campolongo proposed selection of r trajectories from the set of random number of trajectories in a way that they are optimally dispersed in input space. High number of different trajectories M are generated using efficient Morris design discussed earlier. The optimal r trajectories are selected from M by maximising geometric distances between them. According to the experiments conducted in literature, selection of p = 4, = 2/3 and r = 10 has been considered as optimum for highly dispersed representation of the input space. The measures are given as:
hypothesis Ha: Input is influential. Type II error occurs when one accepts a null hypothesis when it is actually not true.sampling design, the input sample points are obtained from the previously characterized distributions.
For the case of flat roof-type geometry, factors8 = 6, r = 10, p = 4 and = 2/3, the total of 70 representative sample points are obtained from the 6-dimensional input space. The simplified thermal model is executed at these points and the annual thermal energy demand (kWh/m2) values are obtained. Then, the Morris measures (i, i*,i) are computed and (i*,i) plots are plotted for the screening analysis.
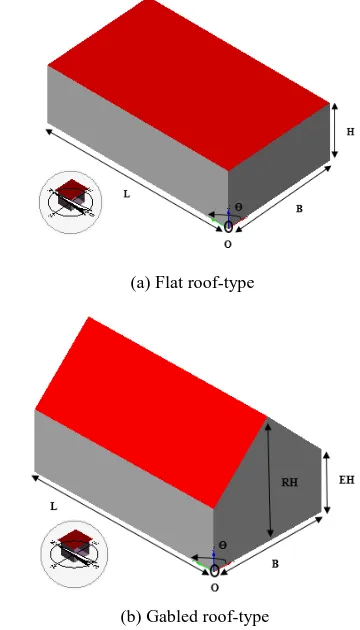
4. UNCERTAIN GEOMETRY ALGORITHM the analysis of building geometries having flat and gabled type roof geometry (Figure 2). In order to calculate the energy demand values, we have used the typical meteorological data of our case study city Geneva, Switzerland.
(a) Flat roof-type
(b) Gabled roof-type
Figure 2. Test cases for uncertain geometry generation
4.1 Uncertain Geometry Generation
We assume that the available 3D building model reconstructed from the different data sources represents only one possible instance or sample of reality. If the reconstruction procedure is altered slightly, then there could result different representation of building than that obtained using previous procedure. So, we generate uncertain samples of building geometry in order to
8 Since for flat roof-type eaves and ridge heights are equal. X
Figure 1. Illustration of trajectory in input space when k = 2
simulate the uncertainty arising from different sources: acquisition, modeling, simplification, generalisation, etc. We obtain uncertain samples by varying the basic geometry parameters in their uncertainty ranges mentioned in previous section 3.1 and 3.2. At the moment, the current variant of our technique is simple although less sophisticated than the generative statistical approach proposed by Huang et. al. (2013).
Steps 1 & 2 below are the preprocessing steps to extract geometry parameters from the given building geometry. Step 3 generates parameter samples using Morris design. Step 4 is an iterative step that constructs uncertain geometry instances from the parameter samples.
For flat roof-type building geometry, let vertices V R3, polygons P = {p =
(
vi)
mi1} such that vi V, v1 = vm & m 3.Step 1: Extract,
Ground polygons PG P where tilt of polygon normal is equal to 180 and roof polygons PR P where normal tilt = 0. Then, obtain ground and roof vertices (vgi and vri) from the respective polygons.
Step 2: Calculate,
Ground polygon length LG = max (||vi - vi+1||, ||vi-1 - vi||) and width WG = min (||vi - vi+1||, ||vi-1 - vi||), where vi V.
Building height BH = |vgi.z – vri.z| i.e. the difference between z-coordinates of roof and ground vertices.
Length orientation OGL = (90 - ), where is the slope of LG and width orientation OGW = 90 + OGL in order to preserve the orthogonality of edges in polygon geometry.
Step 3:
Generate samples of quantile using Morris design with settings - factors = 6, trajectories = 10, levels p = 4 and = 2/3.
Obtain sample values for the parameters from their distributions using the inverse function method.
Step 4: Repeat for number of samples.
Consists of sequential sub-steps as illustrated in Figure 3 below: - Assign ground reference vertex from the sample.
- Obtain first next ground vertex using line equation defined by length LG, orientation OGL as slope, and ground reference vertex.
- Obtain second next ground vertex using line equation defined by width WG, orientation OGW as slope, and first ground vertex. - Obtain final ground vertex using line equation defined by length LG, orientation OGL as slope, and second ground vertex. - Elevate these ground vertices by sampled building height BH in order to obtain respective roof vertices.
Obtain uncertain geometry sample (Figure 4) using these set of vertices forming ground, roof and wall polygons of the building.
Figure 3. Step sequence for flat roof type geometry
Figure 4. Uncertain geometry instance deviating from highlighted reconstructed geometry
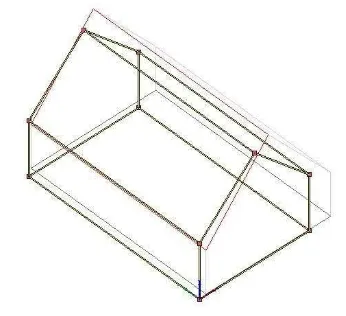
For gabled roof-type geometry, similar Morris design steps are established with one added factor of ridge height. Following Figure 5 depicts these steps. This leads to the creation of uncertain gabled roof-type building geometry samples as shown below (Figure 6).
Figure 5. Step sequence for gabled roof type geometry
Figure 6. Uncertain geometry instance deviating from highlighted reconstructed geometry
4.2 Simplified thermal model: Input-Output description
We are testing our first steps in uncertainty analysis methodology with the simplified simulation model based on German DIN 18599-2 standard9. Although with standard based model it could be possible to understand the model input-output relationship by directly studying equations, but we aim to extend our approach for physics based models involving deterministic and stochastic phenomenon where such relationship would become complex to comprehend. Thus we propose quite generic “simulation model” as a black-box approach which could be adapted for the models of varying complexity.
9 (DIN V 18599 2007)
The standard specifies energy balance equations involving heat losses QHL and gains QHG through the building envelope. Net energy demand QH is the summation of terms multiplied by the gain and loss utilization factors which are functions of building heat storage capacity. The net energy demand (kWh/m2) is expressed as:
QH = QHL - G*QHG, (5)
QHL = QTR + QVE = f (TR, , AS) + f (aR, , , VE), (6)
QHG = QINT + QSOL = f (OD, MG, GLE) + f (I, , FF, VF, AS), (7)
where, G = gain utilization factor, QTR = transmission losses, QVE = ventilation losses, QSOL = solar heat gains, QINT = internal gains, TR = heat transfer coefficient, represents internal set-point and external temperatures, AS = envelope surface areas, aR = airflow rate, = heat capacity of air, VE = air volume, OD = occupant density, MG = metabolic gains, GLE represents lighting and equipment gains, I = solar irradiance, = glazing ratio and FF, VF represent building form and view factors.
The geometrical inputs to model are envelope surface areas, volume, form and view factors which are varying according to the initial uncertain samples of building geometry. The observed variable output is an annual energy demand.
5. IMPLEMENTATION
The concept is implemented in SimStadt10 platform as an independent workflow. SimStadt allows creation of workflows consisting of the workflow steps where each workflow step performs certain defined task and passes its results to the next consecutive workflow steps. The steps perform the tasks of importing building geometry dataset11, preprocessing and model execution. Morris design and screening measures (i, i*,i) are computed using “sensitivity” package in R software12. We have introduced our algorithm as “Uncertain Geometry Creation” workflow step between import and preprocessing steps and thereby configured a new “Uncertain Geometry Impact Analysis” workflow in SimStadt.
6. RESULTS AND DISCUSSION
Morris measures (i, i*,i) are used to understand the model behaviour as well as to compute the qualitative ranking of influential geometrical parameters. Sanchez et al. (2012) introduced an indicator (i/i) to detect the underlying model behaviour. For a given input factor i:
(i) Linear (0 i/i 0.1): deviations of elementary effect are so small that all the effects are very close to their mean or constant depicting linear response w.r.t factor i.
(ii) Monotonic (0.1 i/*i 0.5 & i = i*): most of the effects have same sign (+ve/-ve) leading to monotonically increasing or decreasing effect of factor on the model output.
(iii) Almost monotonic (0.5 i/*i 1 & ii*): although there are high deviations in effects, but most of them are either highly +ve or –ve.
10 http://www.simstadt.eu/en/index.html
11 OGC CityGML standard is used to represent building geometry in LoD2.
12 https://www.r-project.org/
(iv) Non-linear, Non-monotonic & Non-additive (i/*i 1 & i
i*): the elementary effects deviate highly from the mean effect having non-linear and/or interactive effect on the model output.
For qualitative ranking of the parameters, i* measures the influence and i accounts for the effect of interactions between the input parameters on the model output. (i*,i) and ranking graphs are plotted. (See Table 2 & Table 3; Figure 7, Figure 8, Figure 9 & Figure 10.)
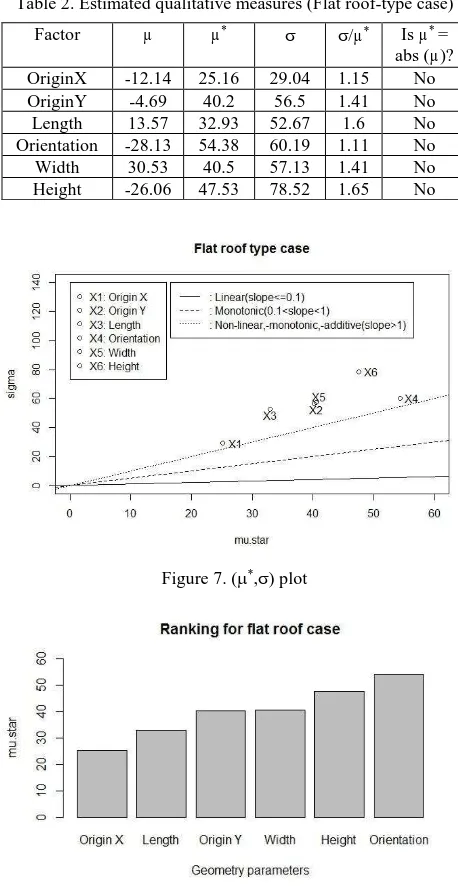
For flat roof type case, the model exhibits highly non-linear, non-monotonous and non-additive behaviour indicated by consistent high values of i/i*. The results state that the building orientation and height are the most influential parameters affecting the annual heating demand values. It is also observed that the building height and orientation have higher interaction effect on the model output.
Table 2. Estimated qualitative measures (Flat roof-type case)
Factor µ µ* /µ* Is µ* = abs (µ)? OriginX -12.14 25.16 29.04 1.15 No OriginY -4.69 40.2 56.5 1.41 No Length 13.57 32.93 52.67 1.6 No Orientation -28.13 54.38 60.19 1.11 No Width 30.53 40.5 57.13 1.41 No Height -26.06 47.53 78.52 1.65 No
Figure 7. (*,) plot
Figure 8. Ranking of influential parameters
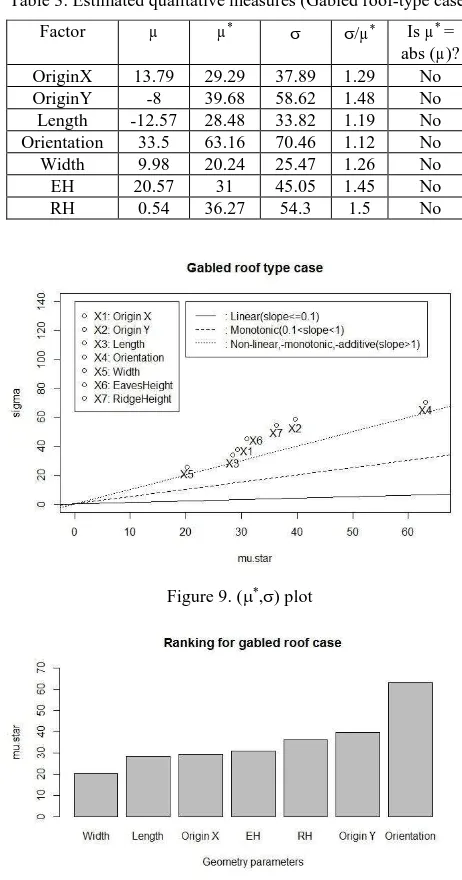
Similar results are observed for gabled roof-type case. Here, also the input parameters have highly linear,
monotonous and non-additive impact on the model response (i/i*1) with approximately same sequence for the individual and interaction effects.
Table 3. Estimated qualitative measures (Gabled roof-type case)
Factor µ µ* /µ* Is µ* = abs (µ)? OriginX 13.79 29.29 37.89 1.29 No OriginY -8 39.68 58.62 1.48 No Length -12.57 28.48 33.82 1.19 No Orientation 33.5 63.16 70.46 1.12 No Width 9.98 20.24 25.47 1.26 No
EH 20.57 31 45.05 1.45 No
RH 0.54 36.27 54.3 1.5 No
Figure 9. (*,) plot
Figure 10. Ranking of influential parameters
From the building modeling literature, it can be understood that the orientation and height parameters are more accurate to extract than others. Because usually they are obtained from the intersection of roof planes derived from the large number of LiDAR point measurements. However in case of annual energy demand predictions they are found to be the most influential ones, essentially indicating that even a small amount uncertainty present in them can cause substantial variation in energy predictions. In other words, a large proportion of uncertainty energy demand predictions can be reduced by employing near accurate techniques for roof plane and ridge line extraction.
7. CONCLUSION AND FUTURE WORKS
The work has introduced the mechanism to account for the uncertainty arising from building modeling and assessed its impact on the energy demand calculations. The methodology
has proposed probabilistic simulation practice for the inclusion of building geometry data uncertainties. The study has also attempted to address the impact of uncertain geometry problem by establishing a qualitative screening method. Considering the context of study (e.g. simulation model used, type of input varied), the building orientation and height were assessed as the most influential parameters affecting the energy demand calculations.
As a next step, a more refined mechanism for uncertainty characterization will be investigated by evaluating the nature of uncertainties arising from their extraction procedures and also possible dependencies between the parameters. The analysis will be further strengthened by computing confidence interval around sensitivity indices and as well as by evaluating the reliability of their ranking. The methodology will be further extended to quantify the uncertainties arising from deterministic and stochastic phenomena involved in prediction of energy performance of buildings in their urban context. A comparative study of simulation results will be conducted while considering the different modelled levels of building geometry abstraction. The comparison could be used to answer the question of how detailed the geometry should be acquired in order to obtain sufficiently reliable simulation results.
ACKNOWLEDGEMENT
We would like to thank the anonymous reviewers for their helpful comments. We gratefully acknowledge the European Commission for providing financial support during the conduct of research under the FP7-PEOPLE-2013 Marie Curie Initial Training Network “CI-NERGY” project with Grant Agreement Number 606851. We would also like to thank the SimStadt development team for providing access to software platform.
REFERENCES
Bahu, J.-M., A. Koch, E. Kremers, and S. M. Murshed. 2013. Towards a 3D Spatial Urban Energy Modelling Approach. In: ISPRS Annals of Photogrammetry, Remote Sensing and Spatial Information Sciences, Istanbul, Turkey, Vol. II-2/W1, pp. 33– 41.
Baltrusch, S., and S. Fröhlke. 2016. Das Amtliche 3D-Gebäudemodell Für Mecklenburg- Vorpommern. In: GeoForum MV 2016 - Geoinformation Im Alltag – Nutzen Und Neue Anforderungen, Rostock, Germany, pp. 13–21.
Biljecki, F., G. B.M. Heuvelink, H. Ledoux, and J. Stoter. 2015. Propagation of Positional Error in 3D GIS: Estimation of the Solar Irradiation of Building Roofs. International Journal of Geographical Information Science, 29 (12), pp. 2269–2294.
Biljecki, F., J. Stoter, H. Ledoux, S. Zlatanova, and A. Çöltekin. 2015. Applications of 3D City Models: State of the Art Review. In: ISPRS International Journal of Geo-Information, 4 (4), pp. 2842–2289.
Campolongo, F., J. Cariboni, and A. Saltelli. 2007. An Effective Screening Design for Sensitivity Analysis of Large Models. Environmental Modelling & Software 22 (10), pp. 1509–1518.
Carrión, D., A. Lorenz, and T. H. Kolbe. 2010. Estimation of the Energetic Rehabilitation State of Buildings for the City of Berlin Using a 3D City Model Represented in CityGML. In: International Archives of Photogrammetry, Remote Sensing and Spatial Information Sciences 38, pp. 31–35.
DIN V 18599. 2007. Energy Efficiency of Buildings — Calculation of the Energy Needs, Delivered Energy and Primary Energy for Heating, Cooling, Ventilation, Domestic Hot Water and Lighting — Part 2: Energy Needs for Heating and Cooling of Building Zones.
Eicker, U., R. Nouvel, C. Schulte, J. Schumacher, and V. Coors. 2012. 3D-Stadtmodelle Für Die Wärmebedarfberechnung. In: Regional IBPSA Conference Proceedings, Berlin.
El Meouche, R., M. Rezoug, I. Hijazi, and D. Maes. 2013. Automatic Reconstruction of 3D Building Models from Terrestrial Laser Scanner Data. In: ISPRS Annals of Photogrammetry, Remote Sensing and Spatial Information Sciences, Vol. II-4/W1, pp. 7–12.
Fisher, P. F. 1999. Models of Uncertainty in Spatial Data. In: Geographical Information Systems, 1, pp. 191–205.
Gottsegen, J., D.R. Montello, and M.F. Goodchild. 1999. A Comprehensive Model of Uncertainty in Spatial Data. Spatial Accuracy Assessment: Land Information Uncertainty in Natural Resources, pp. 175–81.
Guptill, S.C., and J.L. Morrison. 1995. Elements of Spatial Data Quality. 1st Edition. Elsevier.
Haala, N., and M. Kada. 2010. An Update on Automatic 3D Building Reconstruction. ISPRS Journal of Photogrammetry and Remote Sensing 65 (6), pp. 570–580.
Hammersley, J. M., and D.C. Handscomb. 1964. Monte Carlo Methods. London: Methuen.
Hemsath, T.L., and K.A. Bandhosseini. 2015. Sensitivity Analysis Evaluating Basic Building Geometry’s Effect on Energy Use. Renewable Energy 76 (April), pp. 526–538.
Huang, H., C. Brenner, and M. Sester. 2013. A Generative Statistical Approach to Automatic 3D Building Roof Reconstruction from Laser Scanning Data. ISPRS Journal of Photogrammetry and Remote Sensing 79, pp. 29–43.
Hygh, J.S., J.F. DeCarolis, D.B. Hill, and S.R. Ranjithan. 2012. Multivariate Regression as an Energy Assessment Tool in Early Building Design. Building and Environment 57 (November), pp. 165–175.
Kaden, R., and T. H. Kolbe. 2013. City-Wide Total Energy Demand Estimation of Buildings Using Semantic 3d City Models and Statistical Data. In: ISPRS Annals of Photogrammetry, Remote Sensing and Spatial Information Sciences 1 (1), pp. 163–171.
Lilburne, L., and S. Tarantola. 2009. Sensitivity Analysis of Spatial Models. International Journal of Geographical Information Science 23 (2), pp. 151–168.
Maas, H., and G. Vosselman. 1999. Two Algorithms for Extracting Building Models from Raw Laser Altimetry Data. ISPRS Journal of Photogrammetry & Remote Sensing 54, pp. 153–163.
Mechri, H.E., A. Capozzoli, and V. Corrado. 2010. USE of the ANOVA Approach for Sensitive Building Energy Design. Applied Energy 87 (10), pp. 3073–3083.
Morris, M.D. 1991. Factorial Sampling Plans for Preliminary Computational Experiments. American Statistical Association 33 (2), pp. 161–174.
Oude Elberink, S. 2008. Problems in Automated Building Reconstruction Based on Dense Airborne Laser Scanning Data. In: International Archives of Photogrammetry, Remote Sensing and Spatial Information Science, Vol. 37.
Oude Elberink, S., and G. Vosselman. 2011. Quality Analysis on 3D Building Models Reconstructed from Airborne Laser Scanning Data. ISPRS Journal of Photogrammetry and Remote Sensing 66 (2), pp. 157–165.
Roy, C., and W. Oberkampf. 2011. A Comprehensive Framework for Verification, Validation, and Uncertainty Quantification in Scientific Computing. Computer Methods in Applied Mechanics and Engineering 200 (25-28), pp. 2131– 2144.
Saltelli, A, M. Ratto, T. Andres, F. Campolongo, J. Cariboni, D. Gatelli, M. Saisana, and S. Tarantola. 2008. Global Sensitivity Analysis: The Primer. Chichester, Wiley.
Saltelli, A., S. Tarantola, F. Campolongo, and M. Ratto. 2004. Sensitivity Analysis in Practice: A Guide to Assessing Scientific Models. Wiley.
Sanchez, D.G., B. Lacarrière, M. Musy, and B. Bourges. 2012. Application of Sensitivity Analysis in Building Energy Simulations: Combining First-and Second-Order Elementary Effects Methods. Energy and Buildings 68, pp. 741–750.
Silva, A.S., and E. Ghisi. 2014a. Uncertainty Analysis of the Computer Model in Building Performance Simulation. Energy and Buildings 76 (June), pp. 258–269.
Silva, A.S., and E. Ghisi. 2014b. Uncertainty Analysis of User Behaviour and Physical Parameters in Residential Building Performance Simulation. Energy and Buildings 76 (June), pp. 381–391.
Strzalka, A., U. Eicker, V. Coors, and J. Schumacher. 2010. Modeling Energy Demand for Heating at City Scale. In: SimBuild–Fourth National Conference, New York, USA, pp. 358–364.
Suveg, I., and G. Vosselman. 2004. Reconstruction of 3D Building Models from Aerial Images and Maps. ISPRS Journal of Photogrammetry and Remote Sensing 58 (3-4), pp. 202–224.
Taylor, J. R. 1982. An Introduction to Error Analysis: The Study of Uncertainties in Physical Measurements. Sausalito, California, University Science Books.
Verma, V., R. Kumar, and S. Hsu. 2006. 3D Building Detection and Modeling from Aerial LIDAR Data. In: 2006 IEEE Computer Society Conference on Computer Vision and Pattern Recognition (CVPR’06), 2, pp. 2213–2220.