THE STUDY OF INSURANCE PREMIUM RATE GIS MAPPING CONSIDERING THE
STORM AND FLOOD HAZARD RISKS
J. S. Lee a*, I. S. Lee a
a
Spatial Information Research Institute, Korean Land And Geospatial Information Corporation, (jaslee, les05)@lx.or.kr
Commission VI, WG VI/4
KEY WORDS: Storm and Flood, Insurance, Map, GIS, Insurance Rate
ABSTRACT:
Recently, the number of natural disaster occurrence is increasing because of abnormal changes of weather in Korea. In Korea the storm and flood insurance system is in effect to prevent these natural disasters. The national storm and flood insurance Premium rate is very low and the risk of adverse selection resides because of choosing by who lives in high risk area. To solve these problems, the storm and flood insurance rate map are required. In this study, the prototype of storm and flood insurance premium rate map of the Ulsan, Korea was made and the method of GIS analysis for the insurance premium rate calculating and the procedure of the Ulsan storm and flood insurance rate map were researched.
* Corresponding author
INTRODUCTION
Currently, Korea government has strongly recommended the storm and flood insurance system to reduce the damage caused by natural disasters. The storm and flood insurance operated by private insurance company are supervised by Minister of Public Safety and Security. It is the advanced disaster management system which is able to protect the public’s interests through the unexpected natural disaster assisting some part of the insurance premium by the central or local government.
The main purpose of the present investigation is to build the premium rate map for storm and flood insurance. The service model and analysis dataset is river flood, wind hazard, snow hazard risk of Ulsan City, Korea
2. PREMIUM RATE MAPPING CONSIDERING THE STORM AND FLOOD HAZARD RISKS
In Korea, the existing storm and flood hazard premium map has only one representative insurance rate per each administration region. It does not reflect the real hazard risk. So the adverse selection and unfair premium rate problems are could be occurred. To reflect the real risk hazard, the storm and hazard risk GIS modelling and mapping is needed.
In this Study, the river and inland flood risk, wind hazard, snow hazard risks are calculated for the hazard risks. And with the GIS grid calculation, the total risk map and insurance premium rate map is made.
Figure 1 shows the total process of theses GIS calculation. The water hazard uses the combination of river and inland flood water risk. Water hazard take the larger value between river and inland flood risk.
Figure 1. Storm and Flood Mapping Process of Ulsan, Korea
The International Archives of the Photogrammetry, Remote Sensing and Spatial Information Sciences, Volume XLI-B8, 2016 XXIII ISPRS Congress, 12–19 July 2016, Prague, Czech Republic
This contribution has been peer-reviewed.
The risk factor was set limit to flood, wind and snow hazard. The each risk factor weight was referred to Korea disaster annual report as shown in Table 1.
DISASTER Flood Storm Snow Total
Weight
Factor 33.4% 51.8% 14.8% 100%
Table 1. The Weight Factor of Hazard Element
The total degree of hazard calculated from the existing risk dataset. The risk data is calculated in 10m resolution which is subjected to DEM (Digital Elevation Model) resolution. So the final risk and map resolution is 10m.
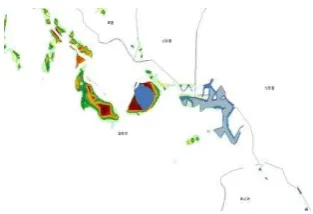
In this study, the used data set is described below Figure 2. In totality the outer water hazard is calculated from 102 Ulsan Rivers. Figure 3 show the overlapped river and inland flood hazard. In this case we used the bigger value for water hazard factor.
Figure 2. The Calculated Risk Hazard Element
Figure 3. River and Inland Flood Mixing Zone
Table 2 show the river and inland flood hazard risk weight.
flooding
depth(m) Grade Phase
0-0.5 1 safe
0.5-1.0 2 danger
1.0-20 3 very danger
Table 2. The River and Inland Flood Hazard risk
The figure 4 shows the result of these final flood classifications of Ulsan.
Figure 4. River and Inland Flood Hazard 3 Grade Reclassification Map
The storm hazard risk is classified with 3 levels as follows. In the Provision of Korean Building Code of Ulsan, the 35m/s is the basic wind standard of design speed for house.
Wind Speed(m/s) Grade Phase
0-35.0 1 safe
35-41.5 2 danger
41.5-48 3 very danger
Table 3. The Storm Hazard Risk Grade
The figure 5 shows the result of these wind hazard classification.
Figure 5. Wind Hazard 3 Grade Reclassification Map
The snow hazard risk is classified with 3 levels as follows. In the Provision of Korean Building Code of Ulsan, the 23cm is the basic snow depth standard for house construction design.
Snow Depth(cm) Grade Phase
0-23 1 safe
23-25.5 2 danger
25.5-28 3 very danger
Table 4. The Snow Hazard Risk Grade
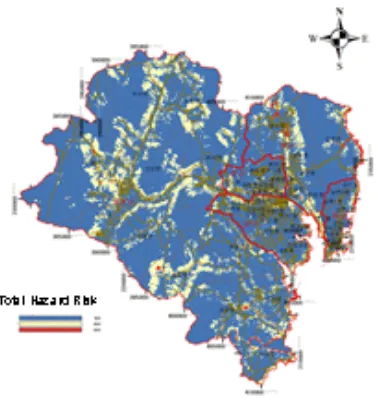
The final hazard map is as follows. Figure 6 shows the final hazard risk is classified into three classes.
The International Archives of the Photogrammetry, Remote Sensing and Spatial Information Sciences, Volume XLI-B8, 2016 XXIII ISPRS Congress, 12–19 July 2016, Prague, Czech Republic
This contribution has been peer-reviewed.
Figure 6. Ulsan Total Hazard Map
Figure 7 shows the detail administrative district Ulsan hazard map. This data will be used in each insurance company GIS map system. Because the final data is GIS GRID and shape file, which is not easy to handle, so the google earth KMZ file is also made for public use which anyone can handle. With KMZ file, user can identify any insurance rate in google earth.
Figure 8. The Storm and Insurance google earth KMZ map of Ulsan, Korea
Figure 7. Ulsan Hazard Map of Each Area
The International Archives of the Photogrammetry, Remote Sensing and Spatial Information Sciences, Volume XLI-B8, 2016 XXIII ISPRS Congress, 12–19 July 2016, Prague, Czech Republic
This contribution has been peer-reviewed.
3. CONCLUSION
In this study, the method of the premium rate map and hazard risk map was researched. The weight factor of hazard is derived from Korea Annual Disaster Report. And suggest the method of Insurance Premium Rate Mapping Considering the Storm and Flood Hazard Risks. The suggested premium rate reflects the characteristic of current single rate in operation,
With opening the premium rate KMZ file to public, anyone can find premium rate of his area of interest in 3D.
For future study the object GIS DB for multiple and single dwelling house and greenhouse is needed for probability of damage analysis. Through this, the real damage cost will be used for calculating the probability of damage.
ACKNOWLEDGEMENTS
This research was supported by a grant [MPSS-NH-2013-62] through the Natural Hazard Mitigation Research Group funded by Ministry of Public Safety and Security of Korean Government.
REFERENCES
FIRM (http://www.fema.gov/floodplain-management/flood-insurance-rate-map-firm) accessed 5 June 2013
GAO(United States Government Accountability Office), Flood
Insurance (FEMA’S Rate-Setting Process Warrants Attention), Report to the Ranking Member, Committee on Banking, Housing, and Urban Affairs, U.S. Senate, 2008
National Geographic Information Institute the standard diagram of map, 1995
National Emergency Management Agency, 2003~2012 Annual Hazard report, 2005~2013
National Emergency Management Agency, The Study of Individual Insurance Premium Rate Mapping Considering the Storm and Flood Hazard Risks, 2013
National Emergency Management Agency, The Risk Calculating of Strong Wind and Heavy Snow, 2009
National Emergency Management Agency, The Standard for Hazard Map, 2012
Van Alphen, J. and Passchier, R., Atlas of Flood Maps,
examples from 19 European countries, USA and Japan , Ministry of Transport, Public Works and Water Management, The Hague, Netherlands, pp.164, pp.163~178, 2007
The International Archives of the Photogrammetry, Remote Sensing and Spatial Information Sciences, Volume XLI-B8, 2016 XXIII ISPRS Congress, 12–19 July 2016, Prague, Czech Republic
This contribution has been peer-reviewed.