THERMAL REMOTE SENSING WITH UAV-BASED WORKFLOWS
Ruedi Boesch
Swiss Federal Institute for Forest, Snow and Landscape Research WSL, Birmensdorf, Switzerland, [email protected]
KEY WORDS: Forest, Vegetation, Thermal camera, Tie points, Camera calibration
ABSTRACT:
Climate change will have a significant influence on vegetation health and growth. Predictions of higher mean summer temperatures and prolonged summer draughts may pose a threat to agriculture areas and forest canopies. Rising canopy temperatures can be an indicator of plant stress because of the closure of stomata and a decrease in the transpiration rate.
Thermal cameras are available for decades, but still often used for single image analysis, only in oblique view manner or with visual evaluations of video sequences.
Therefore remote sensing using a thermal camera can be an important data source to understand transpiration processes.
Photogrammetric workflows allow to process thermal images similar to RGB data. But low spatial resolution of thermal cameras, significant optical distortion and typically low contrast require an adapted workflow. Temperature distribution in forest canopies is typically completely unknown and less distinct than for urban or industrial areas, where metal constructions and surfaces yield high contrast and sharp edge information.
The aim of this paper is to investigate the influence of interior camera orientation, tie point matching and ground control points on the resulting accuracy of bundle adjustment and dense cloud generation with a typically used photogrammetric workflow for UAV-based thermal imagery in natural environments.
1. INTRODUCTION
The predicted increase in frequency and intensity of droughts under a changing climate poses a threat to agriculture areas and forest canopies. Canopy foliage temperature is mainly dominated by the canopy geometry (shape, density, leaf size, etc.), radiation, air-temperature and transpiration (Martynenko et al., 2016; Reinert et al., 2012; Smigaj et al., 2015).
Leaf temperature measurement using thermal infrared (TIR) sensing is primarily used to study plant water relations, and specifically stomatal conductance, because a major determinant of leaf temperature is the rate of evaporation or transpiration from the leaf (Jones et al., 2009).
Canopy temperature can be an indicator of plant stress because of the closure of stomata and a decrease in the transpiration rate, which is the main process responsible for cooling plants. However, the leaf temperature is also sensitive to other variables, such as air temperature, relative humidity, wind speed, and incoming irradiance. On bright, warm days the canopy foliage temperature to air temperature difference is mainly the result of transpiration. By revisiting selected trees or forest sites under similar weather conditions (incoming radiative energy, wind) the temperature difference yields direct estimates of the relative changes in transpiration (Scherrer et al.,2011). Thermal imaging is therefore particularly well suited for field monitoring for temperature differences (Taghvaeian and Chavez, 2013; Zhang and Zhou, 2016).
Available thermal cameras contain typically uncooled sensors, coated with VOx (Vanadium Oxide), with low resolution and weak local contrast by design. Affordable sensor dimensions do not exceed 1 MPixel and pronounced geometric lens distortions are found even for industrial cameras.
2. DATA ACQUISITION
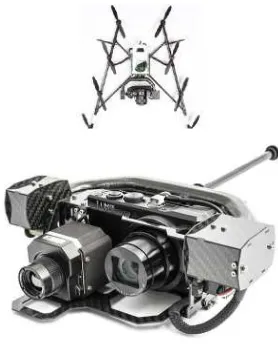
2.1. UAV Platform
Low-cost thermal cameras for UAV's are nowadays widely available, but spatial resolution is quite limited and thermal camera lenses show a significant radial distortion. In this experiments, a FLIR Tau 2 with 19 mm focal length, 640x512 pixels and a pixel size of 17µm has been used. The uncooled microbolometer detector is sensitive between 7.5 and 15 µm. Recent improvements (Nov 2016) of the contrast enhancement processing on the sensor level are promising for improved tie point matching.
2.2. Test Sites
Three different test sites have been investigated, each of them with a specific landscape type.
Pfynwald:
To study the performance of mature Scots pine (Pinus sylvestris) under chronic drought conditions, a controlled long-term and large-scale irrigation experiment has been set up. The experiment is located in the Pfynwald (Valais) in one of the driest inner-Alpine valleys of Switzerland. The test site is completely covered with birch, pines and oak trees.
Figure 2. Oblique view of Test site "Pfynwald" with 2 observation platforms.
2.2.1.Rietholzbach:
The Rietholzbach catchment is a small, hilly pre-alpine basin situated in the middle part of the basin of the Thur (Switzerland), a tributary to the Rhine. Within the catchment two tree groups are wired with temperature loggers.
Figure 3. Orthophoto of Test site "Rietholzbach" with ground control points (purple).
2.2.2.WSL Garten:
Mixture of forest, landscape, parking lots few buildings and open space.
Figure 4. Orthophoto of test site "WSL Garten" (24MP RGB-camera).
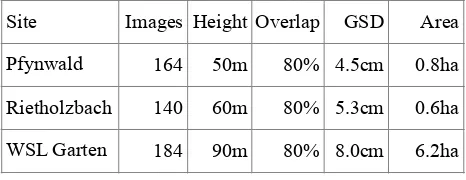
2.3. Flight Planning
Table 1: Flight plans (ha = 10'000 m2)
2.4. Weather Conditions
Pfynwald: late autumn, overcast, strong winds, 12 degrees. Rietholzbach: late spring, sunny day, calm, 23 degrees. WSL Garten: late spring, overcast but dry weather, calm, 22
degrees.
3. DATA PROCESSING
Photogrammetric workflows allow to process thermal images similar to RGB data. But low spatial resolution of thermal cameras, significant optical distortion and typically low contrast require an adapted workflow.
The aim of this paper is to investigate the influence of interior camera orientation, tie point matching and ground control points on the resulting accuracy of bundle adjustment and dense cloud generation with a typically used photogrammetric workflow for UAV-based thermal imagery in natural environments.
Agisoft Photoscan Pro v1.3 (PSP) has been used for all photogrammetric processing.
Site
Images Height Overlap
GSD
Area
Pfynwald
164
50m
80% 4.5cm
0.8ha
Rietholzbach
140
60m
80% 5.3cm
0.6ha
3.1. Geometric camera calibration
Due to the longer wavelengths, lenses of thermal cameras are made of Germanium which makes them extremely expensive. These lenses are optimized for radiometric resolution, thus geometric distortion are of less interest (Luhmann et al., 2010).
The combination of low resolution, low image contrast and a limited number of images requires an explicit camera calibration, in contrast to typical UAV campaigns with RGB cameras. For most modern RGB cameras, a typical UAV flight campaign acquires enough sharp and properly illuminated images and therefore the unknown camera calibration coefficients are estimated during the image alignment step,
always under the assumption enough tie points are found.
Figure 5. Calibration target, black and white with distortion vectors (84x112cm).
The workflow for the interior calibration of thermal cameras is well documented in the literature (Luhmann et al., 2010, Hartmann et al., 2012, Pech et al., 2013). Although most authors recommend to use an aluminum plate with coded targets or similar structures to get significant thermal reflection differences, it turned out that also printed paper is sufficient. In the current workflow, a poster-sized paper with a black-and-white checker-board pattern has been used outside as calibration target (Fig. 5). An OpenCV-based implementation of Brown's distortion models for frame cameras has been applied to calculate the corrected image center, radial and tangential distortion coefficients from 18 paper calibration targets.
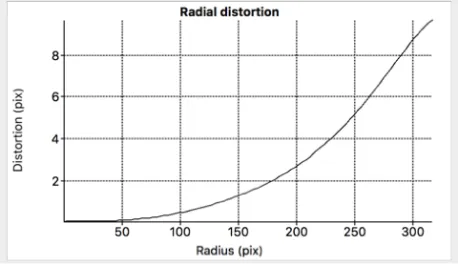
Figure 6. Radial distortion of camera calibration
The large target size allows to acquire images at a distance of several meters. With the defined focal length of 19 mm and the gimbal construction of the Asctec Falcon 8, the camera remains in the focus range with the large dimension of the calibration target.
As expected, the estimated radial distortion is growing rapidly towards the edge of the lens (Fig. 6).
3.2. Ground Control Points (GCP)
The number and distribution of ground control points have a direct influence on the resulting accuracy, but in forest areas the limited visibility of the points is often the dominating restriction and poses a major problem.
Figure 7. Ground control point with differential GNSS antenna at test site "Pfynwald".
To achieve a good visibility of ground control points in thermal images, they should have a low emissivity compared to the surrounding vegetation and other objects. In the presented experiments, corner-shaped aluminum plates (Fig. 7) have been used (30 cm side length).
On the test site "Pfynwald", 3 GCP targets could be placed on the observation platforms. The remaining 5 GCP targets had be positioned within the dense forest plots. Only 2 of them could be identified reliable in the interactive external orientation with in PSP processing.
Only 5 GCP of test site "Rietholzbach" (Fig. 3) are visible, the remaining targets could also not be identified in sufficient image pairs.
3.3. Tie Points
Figure 8. Thermal image at test site "Pfynwald" (blue: GCP target, red: human) with tie points (dots), temperature range: 2-11 °C (heat-map colors blue-cyan-green-yellow-red).
Tie points have been extracted with PSP with the step "Align Photos" in the PSP workflow. The found points at the test site "Pfynwald" are only found on the ground (yellow regions in Fig. 8), but not in the canopy region. The strong and gusty wind during the flight campaign, combined with unusually low temperatures result in an insufficient number and also unfavorable distribution of tie points.
Figure 9L: Thermal image pair at test site "Pfynwald" with valid tie point matches (2-11 °C).
Figure 9R: Thermal image pair at test site "Rietholzbach".
The image pair in Fig. 9L reveals the weak correspondence between both images (only 85 valid correspondence links).
Figure 10: Thermal image at test site "Rietholzbach" with tie points (dots), temperature range: (15-33 °C), blue,green: forest, red: drouthy grassland.
Processing of the test site "Pfynwald" demonstrates, that most image pairs with complete forest coverage (Fig. 11) show no correspondence at all. Only 20% of all images could be matched, therefore the creation of an area-complete dense cloud failed and no orthophoto could be generated.
Figure 11: Histogram of image with complete forest coverage at test site "Pfynwald" temperature range: (3.8-7.4 °C), blue-red: forest.
Figure 12: Thermal image at test site "WSL" with tie points (dots), temperature range: (10-29 °C), blue: deciduous forest, green: open space, orange: sheds.
Generally, all images at test site "Rietholzbach" (Fig. 9R, 10) and "WSL Garten" (Fig. 12) contain sufficient tie points, although in crown regions only isolated tie points are found. Both test sites achieve enough correspondence, so that building of the dense cloud succeeded and orthophotos could be successfully generated.
4. RESULTS
4.1. Orthophoto generation
Figure 12: Thermal orthophoto of test site "Rietholzbach".
PSP allows the direct orthophoto generation from single channel float images, either from converted TIFF-images or directly from FLIR raw images (extension: .ARA).
Orthophotos from thermal images show directly the temperature distribution within vegetation areas (Fig. 12 and 13). Although the temperature accuracy of the camera sensor is only ± 2 degrees, the calculated temperature map shows interesting gradients and peaks. For many applications precise absolute temperatures are not the most important information, but gradient maps can reveal unexpected or even unknown value patterns.
Figure 13: Thermal orthophoto of test site "WSL Garten".
4.2. Camera calibration
PSP allows to import an interior calibration file and optionally to freeze the imported camera calibration. Without freezing, the camera parameters are still adjusted during tie point matching ("Align Photos" in PSP-terminology) and bundle adjustment. In the current experiment, three different camera calibration variants have been compared.
The first variant "self", no interior calibration has been calculated, PSP estimates camera parameters only from all found tie points, given focal length and sensor pixel size.
The second variant "internal+self" uses the calculated interior calibration, but allows PSP to adjust this seed values for camera calibration during further processing.
The third variant "internal only" uses only the calculated interior calibration and PSP is therefore not allowed to modify the imported camera calibration.
For all three variants, the same arrangement of ground control points (23 projections with 5 GCPs, 2 cm reference measuring accuracy) has been used to avoid any side effect from exterior orientation.
Table 2: Camera calibration results for test site "WSL Garten"
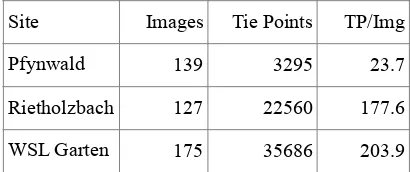
Table 3: Tie point density for all test sites.
Calibration
F [µm] Cx[px] Cy[px]
K1
K2
self
21.17
+5.43 +38.88
0.34
0.29
internal+self
28.02
-4.59 -22.32
1.00 -10.67
internal only
19.70
-4.59 -22.32
0.64 -13.50
Site
Images
Tie Points
TP/Img
Pfynwald
139
3295
23.7
Rietholzbach
127
22560
177.6
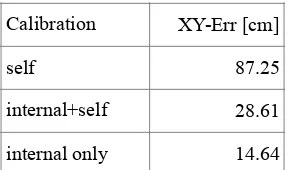
Table 4: RMS error estimates for all GCP's of test site "WSL Garten"
Initially all calibration variants started with a predefined focal length of 19 mm and sensor pixel size of 17 µm. The results of the camera calibration "self" and "internal+self" show a significant higher error of the GCP position estimates compared with "internal only" (Tab. 4).
Using internal calibration coefficients without freezing still doubles the error. Evaluating Table 2 reveals, that PSP only freezes the offsets of the principal point coordinates. Focal length and radial distortion coefficients are modified during image alignment and bundle adjustment.
The estimated focal length "self" of 21.17 mm is surprisingly better than 28.02 mm for "internal+self".
5. CONCLUSIONS AND OUTLOOK
Internal camera calibration for thermal images is required to reduce orientation errors during bundle adjustment. Using a poster-sized black-and-white checkerboard as calibration target allows to setup an appropriate camera calibration without need of special metal plates or other indoor equipment. Therefore the camera calibration can be processed easily within the time frame of the flight mission.
Nevertheless, several environmental conditions like wind and temperature conditions have a strong influence and are critical factors during an UAV flight campaign with a thermal camera. High overlap (>= 80% ) and many metal-coated ground control points are required for sufficient tie point matching in vegetation areas. But motion blur in the canopy region and low contrast at the sensor level make photogrammetric processing of thermal images still challenging and image matching for the whole project area still may fail.
In special cases may a later registration of generated orthophoto to an external registered dataset (e.g. LiDAR CHM) help to properly georeference thermal orthophotos (Smigaj et al., 2015), but often are datasets not acquired within an appropriate time period, too outdated or finding corresponding features in forest canopies of blurred images is impossible.
Contrast enhancement processing on the sensor level is also very important for tie point matching and future improved hard- and firmware may lead to even more feasible applications.
REFERENCES
Hackl, H., Baresel, J.P., Mistele, B., Hu, Y., & Schmidhalter, U. (2012). A Comparison of Plant Temperatures as Measured by Thermal Imaging and Infrared Thermometry. Journal of Agronomy and Crop Science, 198, 415-429.
Hartmann, W., Tilch, S., Eisenbeiss, H., & Schindler, K. (2012). Determination of the Uav Position by Automatic Processing of Thermal Images. XXII ISPRS Congress, Technical Commission VI, 39-B6, 111-116.
Kusnierek, K., & Korsaeth, A. (2014). Challenges in using an analog uncooled microbolometer thermal camera to measure crop temperature. International Journal of Agricultural and Biological Engineering, 7, 60-74.
Luhmann, T., Ohm, J., Piechel, J., & Roelfs, T. (2010). Geometric Calibration of Thermographic Cameras. Proceedings of the ISPRS Commission V Mid-Term Symposium Close Range Image Measurement Techniques, 38, 411-416.
Martynenko, A., Shotton, K., Astatkie, T., Petrash, G., Fowler, C., Neily, W., & Critchley, A.T. (2016). Thermal imaging of soybean response to drought stress: the effect of Ascophyllum nodosum seaweed extract. Springerplus, 5:1393.
Pech, K., Stelling, N., Karrasch, P., & Maas, H.G. (2013). Generation of Multitemporal Thermal Orthophotos from Uav Data. Proceedings UAV-G2013, 305-310.
Reinert, S., Bögelein, R., & Thomas, F.M. (2011). Use of thermal imaging to determine leaf conductance along a canopy gradient in European beech (Fagus sylvatica). Tree Physiology, 32, 294-302.
Scherrer, D., Bader, M.K.F., & Korner, C. (2011). Drought-sensitivity ranking of deciduous tree species based on thermal imaging of forest canopies. Agricultural and Forest
Meteorology, 151, 1632-1640.
Smigaj, M., Gaulton, R., Barr, S.L., & Suarez, J.C. (2015). Uav-Borne Thermal Imaging for Forest Health Monitoring: Detection of Disease-Induced Canopy Temperature Increase.
ISPRS Geospatial Week 2015, 40-3, 349-354.
Taghvaeian, S., & Chavez, J.L. (2013). Remote sensing for evaluating crop water stress at field scale using infra- red thermography: potential and limitations. In, 37th Annual American Geophysical Union Hydrology Days (pp. 73-83). Fort Collins, CO, USA.
Zhang, D.J., & Zhou, G.Q. (2016). Estimation of Soil Moisture from Optical and Thermal Remote Sensing: A Review. Sensors, 16(8), 29 p.