A SPATIO-SPECTRAL CAMERA FOR HIGH RESOLUTION HYPERSPECTRAL
IMAGING
S. Livens1, K. Pauly1, P. Baeck1 , J. Blommaert1, D. Nuyts1, J. Zender2, B. Delauré1 1 VITO; Flemish Institute for Technological Research, Mol, Belgium - (stefan.livens, klaas.pauly, pieter-jan.baeck, joris.blommaert, bavo.delaure)@vito.be
2 ESA; European Space Agency – ESTEC; European Space Research and Technology Centre, Noordwijk, Netherlands
Commission VI, WG VI/4
KEY WORDS: Hyperspectral imaging, spatio-spectral camera, stepwise line filters, band co-registration, RPAS, precision agriculture, horticulture, geology
ABSTRACT
Imaging with a conventional frame camera from a moving remotely piloted aircraft system (RPAS) is by design very inefficient. Less than 1% of the flying time is used for collecting light. This unused potential can be utilized by an innovative imaging concept, the spatio-spectral camera. The core of the camera is a frame sensor with a large number of hyperspectral filters arranged on the sensor in stepwise lines. It combines the advantages of frame cameras with those of pushbroom cameras. By acquiring images in rapid succession, such a camera can collect detailed hyperspectral information, while retaining the high spatial resolution offered by the sensor.
We have developed two versions of a spatio-spectral camera and used them in a variety of conditions. In this paper, we present a summary of three missions with the in-house developed COSI prototype camera (600 – 900 nm) in the domains of precision agriculture (fungus infection monitoring in experimental wheat plots), horticulture (crop status monitoring to evaluate irrigation management in strawberry fields) and geology (meteorite detection on a grassland field). Additionally, we describe the characteristics of the 2nd generation, commercially available ButterflEYE camera offering extended spectral range (475 – 925 nm), and we discuss future work.
1. INTRODUCTION
1.1 Frame imagers for RPAS
Rapid advancement in small remotely piloted aircraft systems (RPAS) and corresponding cameras has generated enormous growth in local earth observation imaging, opening many opportunities, e.g. in vegetation monitoring and precision agriculture. A multitude of commercially available camera systems allow imaging from both multi-rotor (for small areas at very high resolution) and fixed wing systems (for larger areas at somewhat coarser resolutions). In many cases, acquisitions are performed with frame imagers.
Imaging is performed using flight patterns with sufficient sideward overlap between adjacent flight-lines. The frame rate is chosen to provide sufficient forward overlap between successive images. In general, a minimum of 60% overlap is recommended, but platform behaviour and flying conditions may require larger overlaps. Accurate (real-time corrected or post-processed) GNSS data are not routinely or cheaply available on small platforms. Therefore, photogrammetric techniques, which also benefit from large overlaps, need to be used to create high quality ortho-mosaics.
1.2 Frame imaging efficiency
Frame cameras typically have (much) more than 1000 imager lines, so even with 80% forward overlap, the next image only needs to be captured after the platform has moved more than at least 200 times the ground sample distance (GSD). So, modest frame rates (e.g. 1 fps) are sufficient for slow platforms. However, to avoid excessive motion blur, the integration time of 1 frame image needs to be shorter than the time to move over 1 or at most 2 times the GSD. From this, a simple calculation
reveals that the imager is used very inefficiently: the camera is collecting light for less than 1% of the total flying time.
For cameras that support higher frame rates, much more information can be captured by performing acquisition in more rapid succession. Then, because of limited platform speed, subsequent images have a very high degree of overlap (99% or more). Thus the same area is imaged many times. This repeated sampling can allow to derive images with higher SNR and even improved spatial resolution through super-resolution techniques.
1.3 Spatio-spectral cameras
Figure 1. Spatio-spectral imaging
2. SPATIO-SPECTRAL IMAGING
2.1 Hyperspectral imaging principles for RPAS compared
Traditional hyperspectral pushbroom imagers observe a single line on the ground through a slit in the optical system and dispersing the light to project it at a 2-dimensional detector. All spectral bands are simultaneously recorded for every line of ground pixels and a scanning motion is required to cover the area of interest. Although such devices are already available for RPAS and have already been flown on fixed and rotary-wing platforms, these devices are relatively large and heavy due to the complex optics involved. Additionally, the construction of geometrically correct image products requires high accuracy and calibrated onboard GNSS-INS combined information, which drastically increases the cost of the device. Also, the inherent absolute accuracy limitation of around 5 cm in these directly georeferenced pushbroom sensor data makes it very hard to generate products from a freely moving RPAS platform at a resolution better than 5 cm without spatial distortions.
The use of highly overlapping 2D perspective image frames allows for photogrammetric approaches in aerial triangulation, camera calibration, dense point cloud extraction and hypercube orthorectification without the need for expensive direct georeferencing hardware. Several frame-based approaches can then be taken to include hyperspectral information in the imagery. In snapshot (mosaic) imagers, the sensor is divided into patches representing bands each with a specific spectral response. Hence, all bands are captured simultaneously for a given field of view, although each band covers a slightly different footprint on the ground, and spatial resolution of the hyperspectral bands is low (Aasen et al., 2016). In tuneable filter cameras, the whole field of view is captured at full resolution for a single band, with the different hyperspectral bands being captured in rapid succession. When mounted on a moving platform, the spectral bands represented by frame images of such an imager cover different ground locations (Jakob et al., 2017). Also, the moving parts in a tuneable filter camera can be vulnerable over time.
In a spatio-spectral imager, as is the case in the other frame-based hyperspectral imagers, the spectral information of a point is acquired at different times and under different angles, making it less suitable for dealing with moving objects (such as tall crops in windy conditions) or surfaces with strong BRDF effects. As spectral information is distributed over a series of images, accurate co-registration of images with very small angular disparities is necessary. Any residual errors in the
spatial processing will result in spectral artefacts (Aasen et al., 2016, Sima et al., 2016, Jakob et al., 2017). To resolve this, an in-house developed custom photogrammetric processing flow was established for the spatio-spectral cameras developed by VITO (see 2.3).
2.2 The COSI camera and Cubert S 199 ButterflEYE LS
The COSI camera was developed by VITO and covers the range of 600 to 900 nm in 72 spectral bands, each covering 8 pixel lines on a 2048 x 1088 pixels sensor with 5.5 µm pixel pitch. The stepwise line filters are deposited directly on the sensor surface (Tack et al., 2011), allowing for a very compact and light-weight camera design without moving parts (500 grams including embedded computer, data storage and optics).
In collaboration with VITO, Cubert gmbh developed and distributes the commercial S 199 ButterflEYE LS (figure 2) built around the same sensor but with extended spectral range, where a total of 192 spectral filters are deposited stepwise with 5 lines per spectral band, ensuring narrow sampling of the spectral range from 475 to 925 nm (figure 3). With this camera, using a 10.4 mm focal length lens resulting in a 57° cross-track viewing angle, images are captured at 2 cm raw pixel GSD and a 40 m swath from 37 m above ground level. For a nominal forward flight speed of 1.7 m/s, the maximal allowed integration time (limiting motion blur to 2 x GSD) is 11 ms. In practice, the sensor is optimally illuminated with a much shorter integration time (1.5 – 1.7 ms) regardless of the narrow bands and clouded conditions. So, motion blur is only an issue in very dark weather or with much faster flying speeds.
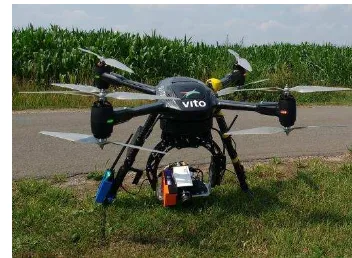
Figure 2. Cubert S 199 ButterflEYE LS mounted on the Aerialtronics Altura Zenith octocopter.
Figure 3. Raw image of a flowering potato field from the Cubert S 199 ButterflEYE LS spatio-spectral camera, showing the spectral band layout on the sensor. Some pixel lines between the
green and red bands have no spectral filters deposited on them and are overexposed. These lines are discarded in processing.
480 nm
570 nm
650 nm
740 nm
830 nm
For a given GSD, capturing all spectral bands at all locations means the platform speed should not exceed 5 x GSD divided by the maximum framerate sustained by the camera, which is 30 frames per second. For a GSD of 2 cm, the theoretical maximal flying speed becomes 3 m/s. However, in practice, the forward speed of an RPAS platform varies considerably, with (small) yaw angle fluctuations adding to even larger apparent variations. So, by limiting the flight speed to 2 x GSD divided by the framerate, resulting in a 60% forward overlap at the spectral band level, gaps in the spectral data are minimized. A further reduction in gaps can be obtained by planning a high sideward overlap of 80% in the flight lines, which helps in improving geometric accuracy as well. Even in the presence of some gaps at the band level (i.e. where spectral measurements are missing at some points for a given band), good spectra can still be derived because the total number of spectral bands is so high. This feature is very important: because the actual spectral sampling at the sensor level is dense (2 to 3 nm), complete spectra can be derived at all locations by subsampling of the spectral bands.
2.3 COSI and ButterflEYE data processing
The image processing workflow involves pre-processing, hyperspectral datacube generation and raster calculation and compositing. During pre-processing, the collected data are validated using quality checks on the raw images and the flight and camera metadata (including onboard GPS data for georeferencing). After that, the hyperspectral datacube generation is initiated. This process includes aerial triangulation, bundle block adjustment and outlier detection, camera calibration, dense point cloud extraction and surface generation algorithms. The use of ground control points is not required, although it can improve data scaling and georeferencing; the case studies below are all processed without the use of ground control points. Next, the hyperspectral bands are obtained by a true ortho projection of each band in the original images onto the digital surface model (DSM), resulting in a hyperspectral datacube (also called hypercube) where spectral layers are aligned at the pixel level. Details, challenges and an elaborate error analysis of the geometric processing are described by Sima et al. (2016). The resulting hypercube with pixel values expressed as digital numbers (DN) is then radiometrically corrected using a commercially available 36% grey reflectance tarp positioned as flat as possible within each flight area. After spectral interpolation and smoothing, a gap-free hypercube with orthomosaiced reflectance maps of 91 bands regularly sampled at 5 nm intervals, or 182 bands sampled at 2.5 nm intervals, ranging from 475 to 925 nm, can be obtained from the Cubert S 199 ButterflEYE LS. Confounding factors and details of the radiometric processing are elaborated on by Livens et al. (2016a, 2016b and 2017). Lastly, the desired spectral indices and false-color composites are derived from raster calculation and compositing of the hypercube.
3. IN PRACTICE
We have carried out a series of missions with the spatio-spectral COSI camera under different conditions and representing various real applications.
3.1 Strawberry monitoring (Delalieux et al., 2017)
In the growing season of 2015, the production, fruit classification and leaf water potential (among others) were
measured at regular time intervals on an experimental strawberry field with different irrigation treatments at PcFruit (Sint-Truiden, Belgium, figure 4). On the 25th of May and 12th of June 2015, RPAS flights with an Aerialtronics Altura Zenith octocopter equipped with the COSI system recorded about 15000 spectral images in the 600-900 nm spectral region, covering an area of 60 x 80 m at 1.4 cm GSD.
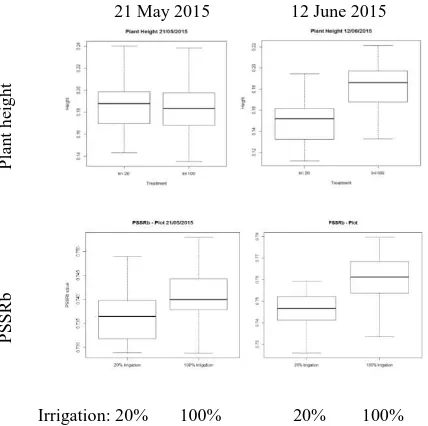
Polygons were drawn for each experimental plot and average height values were extracted at the plot level from the digital surface models (figure 4). Boxplots were created to display variation in treatment groups. Subsequently, plant health was monitored by analyzing the spectral data from the hypercube. In a first instance, the background was masked out by calculating the Normalized Difference Vegetation Index (NDVI). A
threshold was set on these index values, so that only ‘green’
pixels were retained for further analysis. The red edge inflection point (REIP, known as an early stress indicator), and a chlorophyll-b related index (PSSRb = R800 / R635) were derived at the plot level.
Ground measurements showed a 2.5 ton/ha higher production and 35-40% more big fruits in all treatments with 100% irrigation compared to the treatments with 20% irrigation. This was reflected in the COSI-based remote sensing results during the growth season.
Figure 4. (Left) An overview of the experimental strawberry field at PcFruit, St Truiden, Belgium, shown as false color composite from the COSI hypercube (R=801.7 nm, G=672.6 nm, B=604.0 nm). (Right) Digital Surface Model of the region of interest.
21 May 2015 12 June 2015
Figure 5. Boxplots showing the variation in average plant height and PSSRb per plot for each irrigation treatment on
two flight days.
A significant difference in DSM-derived plant height between irrigation treatments was detected on the 12th of June (figure 5, top row), by which time the plants had suffered from high temperatures and a prolonged drought period. As it is known that prior to growth inhibition, photosynthesis is influenced by water deficit, physiological changes due to drought should be detectable in the plots before the actual growth differences could be seen in the DSM from the 12th of June. Although contrary to expectations the REIP did not show any differences between the irrigation treatments, the PSSRb already showed a clear (but not yet statistically significant) trend towards higher chlorophyll concentrations in fully irrigated plots on the 25th of May. By the 12th of June, the difference in PSSRb between irrigation treatments was reinforced and was statistically significant (figure 5, bottom row).
3.2 Wheat monitoring (Baeck et al., 2016)
The winter wheat experiment consisted of 40 cultivars, randomized over 8 rows of 40 plots each with a size of 1.5 x 10 m. Half of the rows were treated with fungicides for a total of 3.85 L/ha. At different moments in time during the 2015 growing season, visual inspections have been executed to assess the degree of infection of the field plots to the following three diseases: yellow rust, brown rust and septoriosis. A shape file has been defined for each individual plot to execute the data analysis on, taking into account some margin to avoid boundary effects. In total, 4 RPAS flights with the COSI camera mounted on the Altura Zenith octocopter were executed at a ground sample distance of 4 cm during the 2015 growth season (table 1).
Out of the 40 varieties, the six varieties suffering respectively the lowest and the highest degree of infection by the three disease types (as observed during field inspections) were selected for spectral analysis. For clarity, the spectrum of only 800 – 850 nm for plots in the untreated zone, while the treated plots show a more equal reflectance in this region.
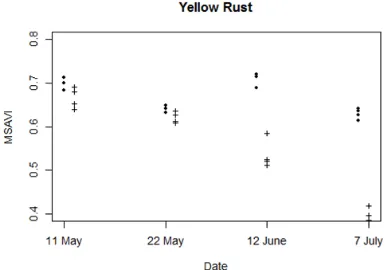
For the plots of the selected varieties, the Modified Soil Adjusted Vegetation Index (MSAVI) was also calculated in an attempt to minimize brightness-related soil effects by considering first order soil-vegetation interaction. It is defined by band and band 15 (670 nm) and band 41 (800 nm):
MSAVI = ∗ band + − √ ∗ band + 2− 8 band − band
Table 1. Details of COSI flight campaigns and disease observations for the wheat monitoring study.
Figure 6. Average reflectance spectra for the 12 selected plots for two of the four RPAS missions. The dashed lines are plots without fungicides treatment, the solid lines are plots with
fungicides treatment.
The value of this index ranges from -1 to 1 and represents vegetation greenness. During crop growth, an increase of the index is expected, while at the end of the growth season the index decreases. In case of disease, the efficiency of the photosynthesis and chlorophyll content diminishes, resulting in a lower MSAVI value. Throughout the growing season, differences between treated and non-treated zones became more pronounced, especially for yellow rust (figure 7).
Figure 7. MSAVI (Modified Soil Adjusted Vegetation Index) of yellow rust-infected plots. Dots are plots without fungicides
3.3 Meteorite detection (unpublished work)
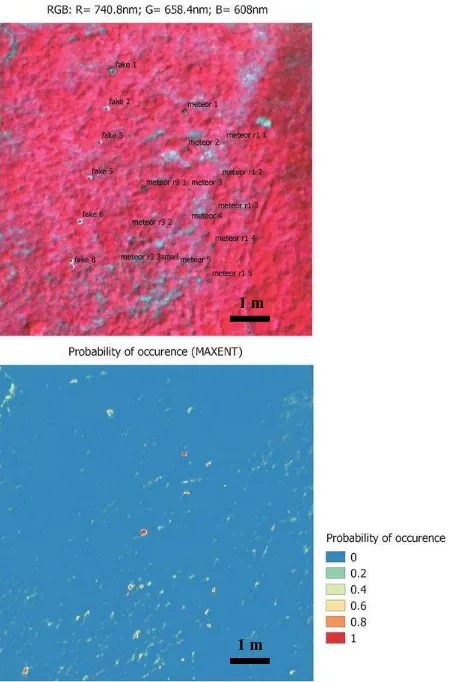
In August 2016, an experiment was set up to assess the potential of RPAS-borne very high resolution hyperspectral meteorite detection. A set of 13 meteorites and 8 ordinary rocks ranging in size from 2 to 20 cm were dispersed on a grassland field in Belgium (figure 8 and 10). Besides appearing darker to the naked eye compared to normal rocks, meteorites are characterized by a relatively flat spectrum in the visible and NIR, which should be apparent in hyperspectral imagery.
The COSI camera was mounted on the Altura Zenith octocopter and flown under blue sky conditions at 30 – 40 m above ground level, resulting in 1.5 – 2 cm GSD in raw imagery and up to 4 cm GSD in the hypercube. Given the size of the rock specimens relative to the ground sample distance, both meteorite and ordinary rock spectra suffered from adjacency affects in the hypercube, causing a vegetation-like pattern to influence the spectrum of the rocks (figure 9). An alternative method to traditional classification techniques as a basis for meteorite detection was tested by translating the hypercube into an index map that can then be thresholded, using the Maxent distribution modelling technique (Maximum Entropy; Phillips et al., 2017).
Figure 8. Collection of meteorites used in the detection experiment on grassland.
Figure 9. Mean and standard deviations of hyperspectral image-based reflectance spectra of the meteorites and ordinary
rocks used in the experimental field
Figure 10. False colour composite (top) showing meteorite and ordinary rock locations and Maxent probability map (bottom)
for the meteorite detection on grassland experiment.
In this approach, a set of training presence locations and (independent derivatives of) spectral layers is taken as input, and a probability map of meteorite occurrence is generated as output, taking sub-pixel and adjacency effects into account (Pauly et al., 2010). Overall, detection of meteorites and distinction of meteorites from ordinary rocks was possible for meteorites larger than 10 cm (figure 10).
4. DISCUSSION, CONCLUSION AND FUTURE WORK
The above case studies highlighted the importance of some of the characteristics of a spatio-spectral camera using stepwise line filters, such as the VITO-developed COSI camera and the Vito/Cubert-developed S 199 ButterflEYE LS camera, as opposed to alternative approaches in RPAS-based hyperspectral imaging. Most significantly, the availability of a very high spatial resolution allowed for the generation of a dense DSM showing plant growth differences related to irrigation status in strawberry fields, and enabled the delineation of small objects such as rock fragments in a grassland area. Traditionally, RPAS-based sub-5 cm resolution imagery for the generation of DSMs and detection of small objects is obtained from commercial or industrial RGB cameras. However, at the same time, the availability of a very high spectral resolution in spatio-spectral cameras allowed for the derivation of early stress indicators in the strawberries prior to visible growth inhibition, and the separation of meteorites from ordinary rock fragments, applications that are out of reach for RGB cameras.
1 m
Another approach to save on weight and costs in RPAS-based spectral surveys, while obtaining similar spatial resolutions as the ones reported in these case studies, is the use of multi-camera arrays to acquire multispectral imagery. Although this is a valid approach for general vegetation vigour monitoring and the generation of broadband vegetation indices such as the NDVI (Pauly, 2016), some spectral features such as the sharper increase in reflectance between 800 and 850 nm in infected wheat plots (as opposed to the more steady reflectance behaviour in this NIR region in fungicide-treated plots), would be missed by using multispectral imagery. Moreover, while RPAS-based multispectral cameras may have spectral bands available with central wavelengths that at first sight seem close enough to generate narrowband spectral indices such as the PSSRb and MSAVI reported in the case studies above, the slight difference in central wavelengths and FWHM characteristics from those reported in the literature may be enough to significantly confound the results (Bastons and Ferguson, 2016). In that respect, hyperspectral bands from a spatio-spectral camera leave a much wider choice to match reported indices as closely as possible.
Future work will focus on the influence of ground control points, improved initial GPS positions and overlap in increasing the camera calibration accuracy, and therefore the spatial artefacts in reconstructed spectra, for different terrain scenarios (extent and flatness). Next, as a spatio-spectral camera by design allows flexible use scenarios, different flight options will be investigated. For instance, by selecting a low flying speed, the maximal number of spectral samples are taken, leading to maximal spectral detail, but with limited coverage per flight. With a higher speed, the coverage can be increased. Spectral subsampling is then performed, which still allows to extract full spectra at pixel level, albeit with a coarser spectral resolution. Finally, a dedicated applied study will be set up to reveal the differences and complementary characteristics of several multispectral and hyperspectral RPAS-based image acquisition techniques.
ACKNOWLEDGEMENTS
We would like to thank IMEC for their support on the calibration of the camera system. Gert Strackx is acknowledged for his outstanding support in camera development. We would also like to thank RPAS pilot Tom Verstappen and flight regulations manager Kristin Vreys for their engagement in safe and successful data acquisition. Koen Van Eyck kindly allowed ButterflEYE LS flight tests over his potato fields in the framework of the Water JPI ERA-NET Cofund WaterWorks2015 project POTENTIAL. PcFruit npo provided technical support and input and allowed flights over the strawberry fields. Part of the COSI camera development was funded by the EC FP7 Airbeam security project. The meteorite project was supported by ESA's Meteor Research Group (MRG) as part of ESA's Science Support Office.
REFERENCES
Aasen, H., Burkart, A., Bolten, A., Bareth, G., 2015. Generating 3D hyperspectral information with lightweight UAV snapshot cameras for vegetation monitoring: from camera calibration to quality assurance. ISPRS Journal of Photogrammetry and Remote Sensing 108, pp. 245–259.
Baeck, P., Blommaert, J., Delalieux, S., Delauré, B., Livens, S., Nuyts, D., Sima, A., Jacquemin, G., Goffart, J.P., 2016. High resolution vegetation mapping with a novel compact hyperspectral camera system. In: Proceedings of the 13th International Conference on Precision Agriculture, St. Louis
MO, USA. Available online at
https://www.ispag.org/proceedings.
Bastons, L.M., Ferguson, R.B., 2016. Active and passive crop canopy sensors as tools for nitrogen management in corn. In:
Proceedings of the 13th International Conference on Precision Agriculture, St. Louis MO, USA. Available online at https://www.ispag.org/proceedings.
Delalieux, S., Delauré, B., Boonen, M., Sima, A., Baeck, P., 2017. High resolution strawberry field monitoring using the compact hyperspectral imaging solution COSI. Advances in Animal Biosciences 8(2), pp. 156-161.
Livens, S., Blommaert, J., Nuyts, D., Sima, A., Baeck, P., Delauré, B., 2016a. Radiometric Calibration of the COSI hyperspectral RPAS camera. In: Proceedings of WHISPERS
Los Angeles, USA.
Livens, S., Delalieux, S., Blommaert, J., Baeck, P., Sima, A., Delauré, B., Boonen, M., 2016b. Evaluation Of The Cosicam Hyperspectral Camera With Agricultural Monitoring Experiments. In: Proceedings of the EARSeL Symposium, Bonn, Germany.
Livens, S., Delauré, B., Baeck, P., Blommaert, J., Delalieux, S., Sima, A., Michels, R., 2017. From Experiments to Dependable Hyperspectral Data Products with the ButterflEYE LS Camera. In: Proceedings of the 10th EARSeL SIG Imaging Spectroscopy Workshop, Zurich, Switzerland.
Pauly, K., 2016. Towards calibrated vegetation indices from UAS-derived orthomosaics. In: Proceedings of the 13th International Conference on Precision Agriculture, St. Louis
MO, USA. Available online at software for modeling species niches and distributions (version 3.4.1). Available online at
http://biodiversityinformatics.amnh.org/open_source/Maxent.
Sima, A., Baeck, P., Nuyts, D., Delalieux, S., Livens, S., Blommaert, J., Delauré, B., Boonen, M., 2016. Compact hyperspectral imaging system (COSI) for small remotely piloted aircraft systems (RPAS) – system overview and first performance evaluation results. In: Proceedings of the ISPRS Congres, Prague, Czech Republic.
Tack, N., Lambrechts, A., Soussan, P., Haspeslagh, L., 2011. A compact, high-speed, and low-cost hyperspectral imager. In: