LAND COVER CLASSIFICATION OF MULTI-SENSOR IMAGES BY DECISION
FUSION USING WEIGHTS OF EVIDENCE MODEL
Peijun Li* and Benqin Song
Institute of Remote Sensing and GIS, Peking University, Beijing 100871, P R China
Emails: [email protected], [email protected]
Commission VII, WG VII/4
KEY WORDS: weights of evidence, multi-sensor, land cover classification, decision fusion
ABSTRACT:
This paper proposed a novel method of decision fusion based on weights of evidence model (WOE). The probability rules from classification results from each separate dataset were fused using WOE to produce the posterior probability for each class. The final classification was obtained by maximum probability. The proposed method was evaluated in land cover classification using two examples. The results showed that the proposed method effectively combined multisensor data in land cover classification and obtained higher classification accuracy than the use of single source data. The weights of evidence model provides an effective decision fusion method for improved land cover classification using multi-sensor data.
* Corresponding author.
1. INTRODUCTION
With the increasing availability of digital images acquired by different sensors, it is crucially important to effectively process and analyze these multisensor data sets in diverse applications, since these data provide complementary information for improved land cover mapping and monitoring. The development of new and effective image fusion methods has been one of the important topics in remote sensing information processing and applications. This study proposes a novel decision fusion method based on the weights of evidence model (Good, 1985; Spiegelhalter and Knill-Jones, 1983) to combine multi-sensor data for improved land cover classification.
2. METHODS
The proposed method can be summarized as follows. The land cover classification was first separately conducted on each dataset using a supervised classifier. The obtained classification results from different datasets were then fused using the weights of evidence model.
2.1 Weight of evidence model
The weights of evidence model is a data integration method. The model was originally developed for medical diagnosis based on presence or absence of a set of symptoms (Good, 1985; Spiegelhalter and Knill-Jones, 1983), and was subsequently adopted for mineral potential mapping (Bonham-Carter et al., 1988, 1989).
The weights of evidence method used in this study is derived from those used in medical diagnostics. Suppose that there are
multiple source of evidence. Let
E
i,
i
=
1
,
2
,...,
n
, be the ith binary evidence which is related to the occurrence of a class, i.e.an event D.
E
andE
denote the presence and absence of the evidence, respectively. The probability of the occurrence of a class in a location (pixel), given the presence and absence of the evidence Ei, can be given by the following conditionalprobabilities:
These two equations can be also expressed in terms of the odd:
(
)
( ) (
(
)
)
probabilities of D given the absence and presence of theevidence
E
i.The weights for evidence
E
i in a WOE model are calculated asInternational Archives of the Photogrammetry, Remote Sensing and Spatial Information Sciences, Volume XXXIX-B7, 2012 XXII ISPRS Congress, 25 August – 01 September 2012, Melbourne, Australia
From expressions (2) and (3), we can obtain:
Similarly, if more than two evidence maps are used, they can be added by assuming that all the evidence maps are also conditionally independent with respect to the occurrence of a class. Therefore, we can obtain,
(
)
( )
∑
where the superscript k refers to the presence or absence of the evidence, respectively.As mentioned previously, the WOE assumes that all the evidence patterns are conditionally independent. However, in most applications, evidence patterns are conditionally dependent. Thus, posterior probability estimates by directly using WOE are likely to be biased upwards when this assumption is violated. In this study, we adopted a modified WOE model, which is called the conditional dependence adjusted weights of evidence (CDAWE) (Deng, 2009), to correct the bias using the correlation structure of the evidence patterns.
2.2 Fusion of multi-sensor data for land cover classification
In this study, the Support Vector Machine (SVM) was first applied on different data to produce land cover classification results. The SVM classifier is a recently developed statistical learning method, which has been widely used in remote sensing image classification and showed very good performance (e.g., Gualtieri and Cromp, 1998; Huang et al., 2002; Melgani and Bruzzone, 2004). The obtained urban classification results were then fused by weights of evidence model. The estimation of conditional probability for each class is crucially important, since it directly related to the weight of each evidential map. In this study, the intermediate classification results derived from the SVM classification, i.e. posterior probability of classification, either from classification rule image as in ENVI or using the method proposed by Platt (2000) were used as the initial conditional probability of each class. Since classification results from different data show different accuracies (i.e. class reliability), final conditional probability for each class is obtained by combining conditional probability from the initial classification and class reliability (i.e. class accuracy). Since the conventional weights of evidence method is defined for one-class extraction (e.g. mineral occurrence), in order to extend it to multi-class classification, the weights of evidence method was first used in classification to produce a posterior probability for each class, and then the class for each pixel is estimated by taking the most probable class of the posterior distribution (i.e. with highest posterior probability).
3. EXPERIMENTAL RESULTS AND DISCUSSION
The proposed method was evaluated and validated in land cover classification using two examples. The first example includes Landsat TM and multitemporal ENVISAT ASAR data, covering Beijing urban-suburban area, China. The second example includes Landsat ETM+ and SPOT 5 multispectral images of Hengshui area of Hebei Province, China. Landsat
TM/ETM+ and ENVISAT ASAR data have a 30m spatial resolution, whereas the SPOT 5 data have a 10 m spatial resolution (band 4 has 20 m spatial resolution).
Results showed that the combination of multi-sensor data using weights of evidence model produced higher classification accuracy than the use of single data alone. For example, for Beijing area, combined classification based on WOE produced 41.72% and 3.22% of increase in Kappa coefficient, compared with those from SAR and TM images, respectively (Table 1). For Hengshui area, combined classification based on WOE produced 7.08% and 6.22% of increase in Kappa coefficient, compared with those from ETM+ and SPOT 5 images, respectively (Table 2). It seems that when two individual classification results show comparable accuracy, the increase in classification accuracy (both overall accuracy and Kappa coefficient) produced by WOE based decision fusion is more significant (i.e. in Table 2).
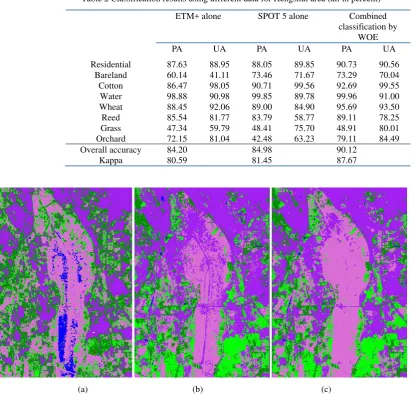
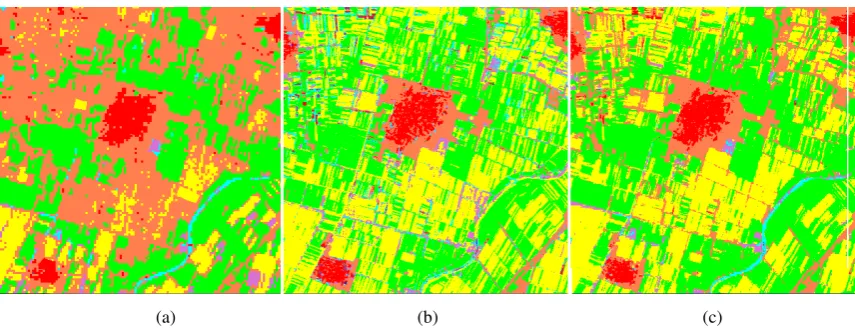
Figures 1 and 2 show portions of classifications using difference data combinations for two examples. From these figures, WOE effectively fused the classification results from different results. For example, salt-pepper appearance was significantly reduced.
4. CONCLUSION
A decision fusion method based on the weights of evidence model was proposed in this study and evaluated in land cover classification using two different es. Results showed that the combination of different data using weights of evidence model in land cover classification produced significantly higher accuracy (both overall accuracy and Kappa) than the use of single source of data alone.
In conclusion, the weights of evidence model provides an effective decision fusion method for improved land cover classification using multi-sensor data.
5. REFERENCES
Bonham-Carter, G. F., Agterberg, F. P., and Wright, D. F., 1988. Integration of geological datasets for gold exploration in Nova Scotia. Photogram. Remote Sens., v. 54, no. 11, p. 1585–1592.
Bonham-Carter, G. F., Agterberg, F. P., and Wright, D. F., 1989. Weights of evidence modelling: a new approach to mapping mineral potential, in Agterberg, F. P., and Bonham-Carter, G. F., eds., Statistical Applications in the Earth Sciences: Geological Survey Canada paper 9-9, p. 171–183.
Deng, M., 2009. A Conditional Dependence Adjusted Weights of Evidence Model. Natural Resources Research, 18(4), 249-258.
Good, I. J., 1985. Statistical evidence. In Encyclopedia of statistical Sciences, New York, Wiley, pp., 651-656.
Gualtieri, J.A., and R.F. Cromp, 1998. Support vector machines for hyperspectral remote sensing classification, Proceedings of SPIE, the International Society for Optical Engineering, 3584: 221–232.
Huang, C., L.S. Davis, and J.R.G. Townshend, 2002. An assessment of support vector machines for land cover classification, International Journal of Remote Sensing, 23(4):725–749.
International Archives of the Photogrammetry, Remote Sensing and Spatial Information Sciences, Volume XXXIX-B7, 2012 XXII ISPRS Congress, 25 August – 01 September 2012, Melbourne, Australia
Melgani, F., and L. Bruzzone, 2004. Classification of hyperspectral remote sensing images with support vector machines, IEEE Transactions on Geoscience and Remote
Sensing, 42(8):1778–1790.
Platt, J., 2000. Probabilities for SV machines, in Advances in Large Margin Classifiers, Smola, A., Bartlett, P., Scholkopf, B. and Schuurmans, D., Eds. Cambridge, MA: MIT Press.
Spiegelhalter, D. J. and Knill-Jones, R.P., 1983. Statistical and Knowledge-Based Approaches to Clinical Decision-Support Systems, with an Application in Gastroenterology. Journal of the Royal Statistical Society. Series A (General)Vol. 147, No. 1 (1984), pp. 35-77.
Table 1 Classification results using different data for Beijing area (all in percent)
SAR alone TM alone Combined
classification by WOE
PA UA PA UA PA UA
Agricultural 37.62 41.87 91.90 71.57 94.60 74.13
Builtup area 74.64 67.81 81.40 74.67 91.23 75.34
Woodland 54.21 43.87 69.84 91.08 68.86 91.56
Water 44.49 81.71 96.40 93.24 93.64 98.88
Bareland 42.15 42.11 78.06 85.41 79.78 92.06
Overall Accuracy Kappa
51.77 38.44
81.71 76.94
84.28 80.16
Table 2 Classification results using different data for Hengshui area (all in percent)
ETM+ alone SPOT 5 alone Combined
classification by WOE
PA UA PA UA PA UA
Residential 87.63 88.95 88.05 89.85 90.73 90.56
Bareland 60.14 41.11 73.46 71.67 73.29 70.04
Cotton 86.47 98.05 90.71 99.56 92.69 99.55
Water 98.88 90.98 99.85 89.78 99.96 91.00
Wheat 88.45 92.06 89.00 84.90 95.69 93.50
Reed 85.54 81.77 83.79 58.77 89.11 78.25
Grass 47.34 59.79 48.41 75.70 48.91 80.01
Orchard 72.15 81.04 42.48 63.23 79.11 84.49
Overall accuracy Kappa
84.20 80.59
84.98 81.45
90.12 87.67
(a) (b) (c)
Figure 1 Portions of land cover classification results using difference data combinations: (a) SAR data alone; (b) Landsat TM alone; (c) Combined TM and SAR data using WOE.
International Archives of the Photogrammetry, Remote Sensing and Spatial Information Sciences, Volume XXXIX-B7, 2012 XXII ISPRS Congress, 25 August – 01 September 2012, Melbourne, Australia
(a) (b) (c)
Figure 2 Portions of land cover classification results using difference data combinations for Hengshui area: (a) ETM+ data alone; (b) SPOT 5 alone; (c) Combined ETM+ and SPOT 5 data using WOE.
International Archives of the Photogrammetry, Remote Sensing and Spatial Information Sciences, Volume XXXIX-B7, 2012 XXII ISPRS Congress, 25 August – 01 September 2012, Melbourne, Australia