A. B. Nilsen, K. Bjørkelo
Norwegian Forest and Landscape Institute, PO Box 115, 1431 Ås, Norway - (ban, kbj)@skogoglandskap.no
KEY WORDS: Land Cover, Statistics, Change Detection, Automation, Open Systems, Internet
ABSTRACT:
An overall societal aim is to ensure a sustainable use and management of a country’s land resources. This requires continuous deliv-ery of reliable and up-to-date information to decision-makers. To be able to deliver this information the Norwegian Forest and Land-scape Institute (Skog og landskap) produces, among others, land resource statistics for all municipalities in Norway. The statistics are also produced on a county level and for the whole country. The acreage numbers are retrieved from a combination of different na-tional datasets in various scales together with interpretation of satellite images. Through a reclassification, statistics are calculated for certain land resource classes like arable land, pasture, forest based on productivity class, fresh water, snow and glacier, mountain-ous/scarcely vegetated area and built up area. Skog og landskap has for the last couple of years been using open source software. The whole statistics production line is carried out by the means of such software. The results are stored in XML-files that are published on the internet. The production requires processing of several databases with national coverage, and needs to handle geometric opera-tions efficiently and without error. The open software solution is reliable, stable and fast.
1. BACKGROUND
To understand the relationship between land use and environmental impacts, information is needed at different scales - global, European, national and local.
In Norway many different institutions are gathering information about and monitoring different aspects of the Norwegian society and environment, e.g. Statistics Norway, The Norwegian Directorate for Nature Management, Norwegian Water Resources and Energy Directorate, The Geological Survey of Norway and The Norwegian Forest and Landscape Institute (Skog og landskap). Skog og landskap is conducting research and providing information about the forest, soils, outfields and landscapes for the mainland. The total area of Norway's mainland is 324 000 km2.
Skog og landskap was responsible for delivering the CORINE Land Cover (CLC) dataset for year 2000 and 2006 (Heggem, Strand, 2010 and Aune-Lundberg, Strand 2010) covering mainland Norway, issued in 2008 and 2010 respectively. Through these two datasets Norway has national data for a European level (minimum mapping unit 25 ha, suitable scale 1:250 000 or smaller) and is a part of one seamless, homogenous land cover map of Europe based on a standardized nomenclature with 44 classes.
However, on a national basis, more detailed information is needed to ensure a sustainable use and management of Norway's land resources. This requires continuous delivery of reliable and up-to-date information to decision-makers. Skog og landskap produces, among others, land cover statistics for the whole country, all counties and all municipalities.
The statistics are demanded by the government, local authori-ties, state institutions and private companies. By keeping the historical statistics, it is easier to observe the increase or de-crease of the different land cover classes. Especially the agricul-tural areas are of interest since only approximately 3 % of Nor-way is arable land. Arable land is usually divided into three sub-classes: fully cultivated land, surface cultivated land and culti-vated pastures. Even though the total area of arable land seems
to be stable among 3 %, the internal distribution within the three sub-classes is changing. Areas with the best soil quality are de-creasing and "moving" into the two other classes (Tenge, 2011).
The statistics is based on a database called ARSTAT, which is a collection of the most detailed information that is relevant and available. ARSTAT is a map database, but not intended for cartographic display.
2. DATA SOURCES
2.1 Below the tree line
2.1.1 AR5: AR5 is a Norwegian national land capability classification system and spatial dataset that describes land recourses, with emphasis on capability for agriculture and natural plant production. AR5 covers the productive part of Norway (about 60 %). Areas close to, or above the tree line is not mapped.
This detailed land cover map gives the best information regarding Norway’s land resources below the tree line suitable use in scales from 1:500 to 1: 20 000. The dataset classifies the areas based on land cover type, forest site class, tree species and soil conditions. AR5 consists of 104 classes based on combination of these four attributes. Minimum mapping unit is 0.05 ha in agricultural areas and 0.2 ha in outfield. The accuracy of well-defined boundaries is better than 2 meters.
The field work started in 1960 and was completed in 1995. The dataset is continuously up-dated: First update was completed in December 2010. The dataset is periodically revised using orthophotos (ground sample distance 10-50 cm) and maintained by Skog og landskap (Bjørdal and Bjørkelo, 2006).
2.2 Above the tree line
names, buildings, borders and restrictive areas. However, the land cover classes do not distinguish between different kind of forest or arable land. This dataset is suitable in scales from 1:25 000 to 1:100 000. The accuracy is ±2-50 metres depending on the feature type.
Some classes in N50 are updated once or twice a year, while others are updated more seldom depending on access to/available source data.
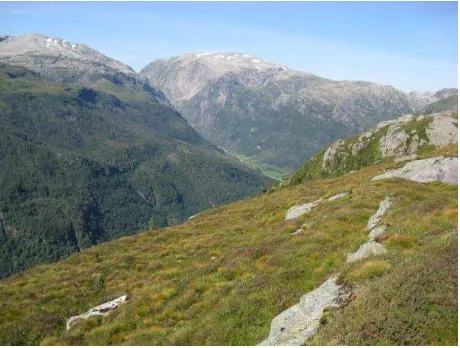
2.2.2 ARmountain: The before mentioned CLC project speeded up the mapping of the mountain areas in Norway which are about 43 % of Norway’s mainland, see Figure 1. In these sparsely populated areas with low-intensity land use, only topographic maps (e.g. N50) provided by NMA with a coarse division of land cover classes were originally available.
Skog og landskap started some years ago with manual interpretation of satellite images covering these areas. But this approach soon turned out to be too time-consuming. However, the development of the capacity of computers, the improvement of the relevant software and the CLC2000-project, gave Skog og landskap the opportunity to make “ARmountain map in 1:50 000” semi-automatically and in this way obtain a more homogenous and detailed dataset above the tree line. ARmountain (Norwegian: AR-FJELL) is a dataset that covers mountains and unproductive areas above the tree line and includes a wide spectre of resource-types. It contains land cover ranging from unproductive boulder fields to high-productive meadows. Five classes are produced: abiotic, sparse vegetation, lichen, moderately fresh vegetation and vigorous vegetation.
ARmountain was produced using a semi-automatic method de-veloped at Skog og landskap. The mapping was carried out us-ing a two-step segmentation and classification of satellite imag-es (using SPOT4, Landsat 7 and 5 scenimag-es from 1999-2006) followed by a manual correction of the results. The input da-tasets were the satellite mountain area mask generated from the N50 dataset and a snow and cloud mask.
The resulting ARmountain dataset is not published as a separate product, but is used to complete other land resource databases, ensuring that these products have complete national coverage (Gjertsen, Angeloff, Strand, 2011).
Figure 1. Typical mountain area in Norway. Photographer: Michael Angeloff, Skog og landskap.
2.2.3 AR50: To offer a homogeneous dataset covering the whole mainland of Norway (below and above the tree line), Skog og landskap produces a land cover map in 1:50 000 called AR50. This map is created through a generalization of AR5 below the tree line and ARmountain (interpretation of satellite images) above the tree line. In addition, N50 is used where neither AR5 nor ARmountain is available (Skog og landskap, 2011). AR50 is suitable for cartographic presentation in scale 1:20 000 to 1:100 000 and is used on a regional and municipality level.
2.2.4 Area figures for land and freshwater: The official acreage figures for each municipality in Norway are provided by NMA. These numbers are downloaded from the internet (Statens kartverk, 2012b) as an XLS-file and converted and stored as a table in PostgreSQL (PostgreSQL, 2012a). The administrative borders and numbers have been unchanged since 2008 (no municipalities have been merged together). In 2012 the numbers will change slightly due to the new coastline (Statens kartverk, 2012c).
3. SOFTWARE
The majority of the software used by Skog og landskap has been proprietary; the data are stored in Oracle relational data-base with ESRI’s ArcSDE extension. ArcGIS is used for the production of paper maps, carrying out all kind of analyses and processing data. However, the software has proven to fail when processing large vector datasets (and Skog og landskap are to a large extend dealing with national datasets) and many of the op-erations are surprisingly and disappointingly very time-consuming. In addition, you have the cost of purchase and sup-port of the software.
The use of open source software is expanding, and since 2005, Skog og landskap has gradually been moving from proprietary and licensed software to open source software solutions for a lot of tasks. Datasets are stored in PostgreSQL relational database with PostGIS extension (PostGIS, 2012) and GeoTools for different GIS tasks. The internet application for viewing and downloading maps is entirely based on open source software like GeoServer, MapServer, OpenLayers and GeoExt.
The production of land resource statistics is based on PostgreSQL and PostGIS.
To automate the production, the calculation is run by the use of batch files (Wikipedia, 2012a). Even though batch-files may sound a little bit “old-fashioned”, it is still a very easy, simple and convenient way of automating processes when running Windows. Every Windows system is capable of creating and using batch files.
4. STATISTICS
4.1 Producing ARSTAT
ARSTAT is stored in PostgreSQL and created using the geometric functionality of the PostGIS extension. The final database contains 14 million polygon objects, with a total of one billion points.
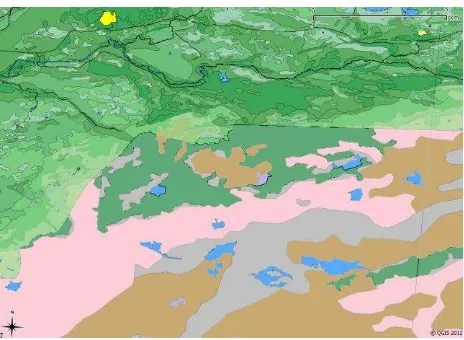
update regimes of the data sources varies greatly, as seen in Figure 2, and ARSTAT is not suited for cartographic presentation.
As mentioned, the amount of data and insufficient tools for geometry processing made the production cumbersome and tedious. Data had to be exported to shape-datasets in small chunks in order to overcome time constraints and errors in geometric operations, and the results imported back to the database. The migration to PostGIS made it possible to do the processing on ARSTAT stored as one table in the database (likewise for the source datasets). Most operations could be executed as single SQL-queries on the national datasets. Still, some of the heavy geometric operations were implemented as functions and run on chunks. However, the convenience of all data resident in the same database and the ability to use SQL, together with the improved speed and near error-free performance of geometry-operations, was a major improvement.
The land cover and capability of the objects is characterized by seven attributes, inherited from AR5 and AR50. There are several thousand allowable combinations of these attributes, which are used to compute the classes needed for the statistics. The alignment of classes across the different classification schemes (briefly described below) is developed in cooperation with the domain experts and the end users.
Figure 2. The dataset ARSTAT is not homogeneous with respect to MMU and classification.
4.2 Land resource classes
Acreage numbers for different land resources on municipality, county and country level is calculated automatically.
The final results contain total area (land and fresh water, see 2.2.4), acreage figures for land resource classes based on AR5 (see 2.1.1) and AR50 (i.e. ARSTAT, see 4.1). Further, mountainous areas are dived into five sub-classes and forest is distinguished based on productivity classes and tree species.
Land type classes from AR5: Fully cultivated land, Surface cultivated land, Pasture, Productive forest, Unproductive forest, Open peat bog, Open land with soil-cover, Open land with little or no soils, Area that is not mapped (unknown classification)
Land type classes from AR50: Fully cultivated land, Surface cultivated land, Pasture, Forest, Open peat bog, Mountainous
areas, Freshwater, Glacier and permanent snow, Built-up area and Transport network area.
Forest classes from AR50: Very high productivity, High productivity, Medium productivity, Low productivity, Non-productive and Unknown classification for Coniferous forest, Mixed forest, Deciduous forest and Forested peat bog.
Mountainous areas classes from AR50: Vigorous vegetation, Moderately fresh vegetation, Sparse vegetation, Bare rock and Unknown classification.
4.3 Calculating and saving acreage figures
The workflow is the same for computing numbers for 430 municipalities, 19 counties or for the whole country.
The calculation of the statistics is done automatically by running a BAT-file which executes a PSQL-command (PostgreSQL, 2012b) which for each statistical level starts an SQL-file. The SQL-file contains SQL-queries to different tables stored in PostgreSQL. The resulting acreage figures for the different classes mentioned in 4.2, is written to an XML-file.
Computing time for one municipality is about 25 seconds, 65-75 minutes for one county and about 23 hours for the whole country.
4.4 Publishing the statistics
The resulting XML-files are available on Skog og landskap’s home page on the internet. In addition to the acreage figures, some additional information about the statistics, the involved datasets and the land types is included.
To make the XML-files more easy to read and nice to look at, XSLT-files have been created. This ensures a nice layout of the statistics in different web browsers. To save work, one CSS-file (Cascading Style Sheets) is being created. CSS defines how HTML elements are to be displayed. Styles saved in this CSS-file enable us to change the appearance and layout of all the pages (XML-files) in a web site, just by editing this single file (WC3, 2012).
Statistics are produced every second year, and acreage figures from 2006, 2008 and 2010 are available. People may look at, print and/or download these land resource statistics sheets as HTML-files. An example, land resource statistics for Norway:
http://kart2.skogoglandskap.no/xml_filer/2010/Norge_arstat_20 10.xml
4.5 Synergy effects
The dataset ARSTAT has a national coverage, but is inhomoge-neous with respect to MMU, classification, and update frequen-cy. In order to quantify changes of specific importance more accurately Skog og landskap also conduct sample-based moni-toring programs for different strata.
The specific monitoring of changes in the agricultural landscape combined with the long-term changes captured by the full cov-erage area resource statistics provides information that makes it possible to analyse trends and drivers in the changes.
Further, the processing of 3Q-data was improved based on the successful use of PostGIS for ARSTAT. The landscape analysis application was a typical desktop GIS production flow, includ-ing several tools, format conversions etc. We decided to fully exploit the GIS-functionality integrated in the DBMS while “translating” the application to PostGIS. A significant reduction in complexity and processing time was achieved.
The GIS functions in PostGIS cover the Simple feature specifi-cation (ISO, 2004) and more. This makes it possible to analyse spatial information and compute and store the entire set of indi-cators using relatively simple SQL-queries.
5. CHALLENGES
The statistics are based on AR5 and AR50. AR5 has the most detailed classification. AR50 is based on generalized AR5-data, the topographic dataset N50 and interpretation of satellite images in mountainous areas. AR5 is yearly updated, while AR50 is revised every second year. The land resource statistics is accordingly produced every second year. Changes in the AR5 dataset may therefore not be published in these figures before two years after the changes actually took place.
A copy of AR5 is frozen as a “year version” of the dataset in January, e.g. year version 2011 is the database version available at the beginning of 2012. During 2012, AR5 will be updated. These changes will not be included before the year version 2012 produced January 2013.
The changes in AR5 occur at different time in different municipalities and landscape types. Thus, the real changes in the landscape are better presented using longer intervals than one year. Although we consider the production line to be fairly efficient, there are small changes from year to year on a national scale. In the future, in order to better highlight significant changes, the statistics will be issued every third year.
Total acreage numbers from ARSTAT may differ a little bit from the official total numbers given by NMA due to different map projection, data source and generalization. NMA has used Lambert azimuthal equal area projection (ETRS89-LAEA) with azimuthal origin in the centre of gravity of Norway (E12, N64) for their dataset with administrative borders and acreage figures for all municipalities in Norway. AR5 and AR50, on the other hand, are given in ETRS89-UTM33.
An additional challenge for this year's version was the new high quality version of Norway's coastline published by the NMA in October 2011. We decided to use this new shoreline in order to correct our data in some remote areas. A side effect was that this introduced a lot of slivers where the old coastline was quite OK. Norway has the world's second longest coastline (after Canada). This overlay process allowed us to try out several exiting functions in the PostGIS toolkit.
6. CONCLUSIONS
The open software solution is reliable, stable and fast. It is quite easy to use and to adapt to PostGIS if you know a little bit of
SQL and are familiar with standard GIS functions.
Publishing statistics on national to local level based on one data source is in many respects efficient. While data capture (through remote sensing or field work) is still costly, the use of efficient GIS tools offers flexible data processing to a low cost. However, publishing statistics based on fairly complicated and inhomogeneous data also poses quite a bit of challenges, espe-cially communicating the information to the users. The need for high quality data capture of the real landscape should not be
Bjørdal, I., Bjørkelo, K., 2006. AR5 klassifikasjonssystem. Klassifikasjon av arealressurser. Skog og landskap. Manual 01/2006.
http://www.skogoglandskap.no/publikasjon/1170254097.17
Statens kartverk 2012a. N50 Kartdata. Brochure.
http://www.statkart.no/?module=Articles;action=ArticleFolder. publicOpenFolder;ID=5674
Skog og landskap, 2011. Arealressurskart AR5, AR50, AR250, CLC. Skog og landskap. Brochure 1/2011.
http://www.skogoglandskap.no/filearchive/arealressurskart_bro Arealressurskartover fjellområdene. Kart og plan, Aas, no. 71/1, pp. 45-51.
http://www.skogoglandskap.no/publikasjon/arealressurskart_ov er_fjellomradene
Dramstad, W. E., Fjellstad, W. J., Strand, G.-H., Mathiesen, H. F., Engan, G., Stokland, J. N., 2002. Development and imple-mentation of the Norwegian monitoring programme for agricul-tural landscapes. Journal of Environmental management, 64, pp. 49-63.
http://www.skogoglandskap.no/publikasjon/1187704186.1
References from websites:
Tenge, I. M., 2011. Det blir mindre kvalitetsjord. Forskning.no, September 8 2011, 1 page.
Statens kartverk, 2012b. Arealstatistikk - tall for kommuner og fylker.
http://www.kartverket.no/nor/Land/Fagomrader/Arealer_og_tall /Arsutgaver_av_arealstatistikken/
PostgreSQL 2012a. What is PostgreSQL?
http://www.postgresql.org/docs/9.1/interactive/intro-whatis.html
Statens kartverk, 2012c. Lengre kyst og flere øyer.
http://www.kartverket.no/Lengre+kyst+og+flere+%C3%B8yer. d25-SwZrY27.ips
PostGIS 2012. What is PostGIS?
http://postgis.refractions.net/
PostgreSQL 2012b. psql.
http://www.postgresql.org/docs/9.1/interactive/app-psql.html
Wikipedia, 2012a. Batch files.
http://en.wikipedia.org/wiki/Batch_file
W3C, 2012. Read more about SQL, XML, XSLT and CSS on the home page of World Wide Web Consortium (W3C).