CHANGE ANALYSIS OF ANTARCTIC ICE SHELVES BASED ON
MULTIPLE REMOTE SENSING PRODUCTS
Yixiang Tian a, *, Hexia Weng a,b, Da Lv a, Xiaohua Tong a, Rongxing Li a
a
Center for Spatial Information Science and Sustainable Development Applications, College of Surveying and Geo-Informatics, Tongji University, China - (tianyixiang, 2014_whx, lvda, xhtong, rli)@tongji.edu.cn
b
Colleague of Architecture and Survey Engineering, Jiangxi University of Science and Technology, China
Commission VIII, WG VIII/6
KEY WORDS: Ice shelf, Extent, Coastline, Change analysis
ABSTRACT:
The Antarctic ice sheet is well known as the most sensitive and key issue in the global climate change research and is playing a more and more important role for the global sea level change. Measurement of changes in area and mass of the Antarctic ice sheet is critically important and has been made by using different remote sensing technologies and ground exploration data. Sequential mapping of Antarctic boundaries provides a simple and direct method for measuring the area and volume if ice sheet or ice shelves advances or retreats in the Antarctic coasts. Our results show that the total ice shelf area is retreated between 1963 and 2009. However, the trend for each ice shelf is quite different.
* Corresponding author
1. INTRODUCTION
The majority of Antarctica’s mass loss to the ocean occurs
through its ice shelves via iceberg calving and basal melting (Depoorter at al., 2013; Rignot et al., 2013). Regional and global changes in atmospheric and oceanic conditions through ice-ocean and ice-atmosphere interactions may lead to iceberg calving or ice shelf basal melt. Meanwhile, the seaward motion of the ice front may occur at a speed at least a few hundred meters per year (Rignot et al., 2011). Although mass change in ice shelves have little or no direct effect on global sea level as the ice shelves are already floating on the sea, they buttress the grounded ice upstream. Reduction of buttressing from ice shelves leads to acceleration of mass loss from ice sheet. Therefore, to accurately understand and study the impact of Antarctic ice mass balance, ice shelf is the important part that needs to be analysed. The ice-shelf thickness around the Antarctic was observed at the accelerating thinning status (Paolo et al., 2015). However, many researchers assume that the ice shelf has no areal extent change when calculate volume change or mass change of ice shelves, which increases the uncertainty of results (Liu et al., 2015). Coastlines generated from remote sensing data could used to predict and analyse iceberg calving and calculate area change of ice shelves and glaciers. Sequential mapping of ice shelf fronts provides a simple and direct method for measuring the area of Antarctic ice shelves. Analysis based on a long period should be more reliable since the ice front of ice shelf can change by kilometers in just a few weeks (Scambos et al., 2000). There are some commonly used methods to analyse ice-shelf change, such as changes in ice-shelf area, average front motion rate, motion rate along main flow lines (Kim, 2004; Ferrigno et al., 2006; Liu et al., 2015). Zwally et al. (2002) summarized mean annual barrier motion estimates obtained from slant-range analysis of ERS-1 and ERS-2 data from 1978 to 1988. Their barrier motion is estimated as the ratio between ice-shelf area change and the
length of the discharge periphery. The estimate of their result should be a lower limit estimate of ice-shelf front motion seaward or ice-shelf front regression based on their ice-shelf area change estimation methods. We applied all above methods to analyse changes of Antarctic ice shelves based on multiple remote sensing products.
2. RESEARCH AREA AND DATA
In this paper, ice shelf changes are analysed based on coastlines that are obtained from multiple remote sensing products between 1963 and 2009. DISP coastline was derived from Declassified Intelligence Satellite Photographs (DISP) mosaic by using an automated coastline extraction and refinement algorithm. The DISP images were acquired on 29 August 1963, 29 October 1963 and 3 November 1963 respectively (Kim, 2004). The DISP coastline covers all the Antarctica except Lassiter Coast, Bryan and Eights Coast, Alexander Island, Syowa Prince Olav Coast, Mawson Coast, and WilhelmⅡ Coast. Radarsat-1 coastline was extracted by applying an automated coastline extraction algorithm based on the Radarsat-1 synthetic aperture radar (SAR) image mosaic with a data acquisition time from September 09 to October 20, 1997 (Liu and Jezek, 2004). MOA2004 coastline was digitized based on visual interpretation by using MODIS Mosaic of Antarctica (MOA) data sets including MODIS band1 and band2 data acquired over the austral summer season between November 20, 2003 and February 29, 2004. Using the same method, MOA2009 coastline was generated based on MOA2009 surface morphology image map that were acquired 1 November 2008 through 28 February 2009 for the full spring-summer season (Scambos et al., 2007).
The area change is calculated for all the ice shelves and summarized in each basin that based on the basin subdivision The International Archives of the Photogrammetry, Remote Sensing and Spatial Information Sciences, Volume XLI-B8, 2016
XXIII ISPRS Congress, 12–19 July 2016, Prague, Czech Republic
This contribution has been peer-reviewed.
map proposed by Zwally et al. (2012). Some big ice shelves are feed by more than one drainage basin, we do not separate them into different basins. Motion estimates are applied to 64 Antarctic ice shelves (Fig. 1), which are named by USGS and account for more than 90% of the total ice-shelf area of Antarctica.
Figure 1. Location and name of ice shelves that are analyzed motion rate.
3. CHANGE ANALYSIS METHODS
Coastline outlines the outermost features of the Antarctic coast, which includes both the ice fronts of ice shelves and the grounded ice sheet margin. The extent changes of ice sheet and ice shelves have different meanings to the Antarctic mass balance and the ice sheet margin is more stable than ice shelf front. Therefore, the ice shelf mask generated by Depoorter et al. (2013) is used to identify ice shelves and separate ice shelf coastline and non-ice shelf coastline.
Several methods and procedures are developed and applied to analyse the quality of the products and to detect changes of the ice shelves. The metrics used include area change, average distance change and lower-limit distance change. Area changes are measured from extent between the grounding line and ice front at different periods and are estimated for all ice shelves of Antarctica. The extents of Antarctic ice shelves are measured separately for four products. Then changed areas of each ice shelf are calculated for three time intervals, which are 1963-1997, 1997-2004 and 2004-2009. During area change calculation, the retreat and advance areas of changed areas are classified by comparing whether the later coastline segments are out or in the previous coastal region. Average distance change and lower-limit distance change are estimated as the ratio between ice-shelf area change and the length of the ice shelf front. Their difference is the way to treat advanced and retreated region in distance computation between two ice front boundaries. During average distance change calculation, the length of coastline segments in advanced and retreated region is used as weight. Lower-limit distance change is estimated in the similar way as described in Zwally et al. (2002). If the ice-shelf area change is a positive number, lower-limit distance change presents the lower limit of seaward motion because iceberg calving events smaller than ice front advance. In contrast, if the ice-shelf area change is a negative number, lower-limit distance change presents the lower limit of ice front regression because seaward ice front advance smaller than iceberg calving. These metrics should reflect ice-shelf front change caused by a
combination of seaward ice flux and break-back by ice front calving. We summarize the mean annual motion estimates for major 64 Antarctic ice shelves which are shown in Fig.1.
4. RESULT AND ANALYSIS
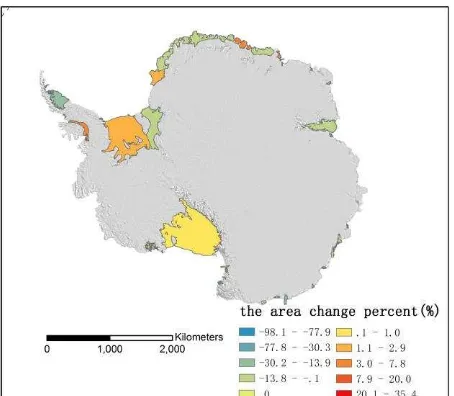
The total ice shelf area in Antarctica is retreated from 1963 to 2009 and the retreat area calculated based on four coastline products is up to 63,865 km2. The total retreat area should be more than this number since DISP coastline didn’t cover ice shelves at Amundsen Sea Embayment (ASE) and ice shelves in West Antarctica are commonly retreated during this period as reported by other researchers. We the as the reference data, the area change rate for 48 ice shelves are shown in Fig.2. Although the total area of Antarctic ice shelves is decreased, some big ice shelves are extended, such as Ross Ice Shelf and Ronne Ice Shelf.
Figure 2. The area change rate of ice shelves between 1963 and 2009.
The ice shelf front motion rates are even more complex. The following is the detail analysis of Amery Ice Shelf (AIS), which situates between 67.5° and 75° East longitude and between 68.5° and 73.3° South latitude. It is the largest ice shelf in East Antarctica. The Amery Ice Shelf front advanced steadily at a rate of approximately 1,500 m/yr from 1936 to 1963. There was a large piece of the ice shelf, about 9,600 km2, calved between late 1963 and early 1964 (Foley et al., 2013). The DISP coastline show the AIS front before the calving event. Based on DISP coastline and Radarsat-1 coastline the AIS area decreased 3929 km2 and the front retreated at average rate of 439 m/yr from1963 to 1997. Taking the calved area into consideration, the AIS actual advanced area is 5671km from 1964 to 1997 and the AIS front average advance rate was 354m/yr. Based on Radarsat-1 coastline and MOA2004 coastline the AIS area increased by 883 km2 and the AIS front advanced rate was 312 m/yr. The rate of advance in the middle portion of the Amery Ice Shelf front is 700m/yr from 1997 to 2004 and higher than that on both sides of the ice shelf front. Based on MOA2004 coastline and MOA2009 coastline, the AIS area increased 1053 km2 and the AIS front advanced rate was 488 m/yr. The rate of advance in the middle portion of the Amery Ice Shelf front is about 960 m/yr from 2004 to 2009. Comprehensive considering period from 1963 to 2009, after the last major calving event of The International Archives of the Photogrammetry, Remote Sensing and Spatial Information Sciences, Volume XLI-B8, 2016
XXIII ISPRS Congress, 12–19 July 2016, Prague, Czech Republic
This contribution has been peer-reviewed.
the AIS that was in late 1963 or early 1964, the AIS front kept advancing with a steady rate with minimal calving and the whole AIS was in a expand stage from 1964 to 2009. However the most MOA2009 coastline segments did not extent to the position of DISP coastline segments and the AIS area decreased by 1992 km2 from 1963 to 2009.
5. CONCLUSION
Our results show that the total ice shelf area is retreated between 1963 and 2009. However, the trend for each ice shelf is quite different. Based on ice front motion rate, the trend for ice front change and different effect of ice flux and calving can be analysed. Some ice shelves keep a very stable advancing rate, such as Amery ice shelf. Others have lost areas for some years because of calving but with a similar seaward motion rate, such as Ross Ice Shelf. This paper presents a preliminary result of Antarctic ice shelf change since 1963. Detailed analysis is still under advisement and its associated mechanism should also be further investigated.
REFERENCES
Depoorter, M.A., J.L. Bamber, J.A. Griggs, J.T.M. Lenaerts, S.R.M. Ligtenberg, M.R. van den Broke and G. Moholdt. 2013. Calving fluxes and basal melt rates of Antarctic ice shelves. Nature, 502, pp.89-92.
Ferrigno, J.G., A.J. Cook, K.M. Foley, R.S. Williams, , Jr., Swithinbank, Charles, Fox, A.J., Thomson, J.W., and Sievers, Jörn. 2006. Coastal-change and glaciological map of the Trinity Peninsula area and South Shetland Islands, Antarctica—1843– 2001: U.S. Geological Survey Geologic Investigations Series Map I–2600–A, 1 map sheet, 32pp.
Foley, K.M., J.G. Ferrigno, C. Swithinbank, R.S. Williams,Jr. and A.L. Orndorff. 2013. Coastal-Change and Glaciological Map of the Amery Ice Shelf Area, Antarctica: 1961–2004: U.S. Geological Survey Geologic Investigations Series Map I–2600– Q, 1 map sheet, 8pp.
Kim, K., 2004. Satellite mapping and automated feature extraction geographic information system-based change detection of the Antarctic coast. PhD thesis. Ohio State: The Ohio State University.
Liu, H. and K.C. Jezek. 2004. A complete high-resolution coastline of Antarctica extracted from orthorectified Radarsat SAR imagery. Photogrammetric Engineering & Remote Sensing, 70(5), pp.605-616.
Liu, Y., J.C. Moore, X. Cheng, R.M. Gladstone, J.N. Bassis, H. Liu, J. Wen and F. Hui, 2015. Ocean-driven thinning enhances iceberg calving and retreat of Antarctic ice shelves. PNAS, 112(11), pp.3263-3268.
Paolo F.S., H.A. Fricker and L. Padman, 2015. Volume loss from Antarctic ice shelves is accelerating. Science, 348(6232), pp.327-331.
Rignot, E., J. Mouginot, and B. Scheuchl. 2011. Ice flow of the Antarctic Ice Sheet. Science, 333(6048), pp.1427–1430.
Rignot E, S. Jacobs, J. Mouginot and B. Scheuchl. 2013. Ice-Shelf Melting Around Antarctica. Science, 341(6143), pp.266-270.
Scambos, T.A., T.M. Haran, M.A. Fahnestock, T.H. Painter and J. Bohlander. 2007. MODIS-based Mosaic of Antarctica (MOA) data sets: Continent-wide surface morphology and snow grain size. Remote Sensing of Environment, 111(2), pp.242-257.
Scambos, T.A., C. Hulbe, M.A. Fahnestock, and J. Bohlander. 2000. The link between climate warming and breakup of ice shelves in the Antarctic Peninsula. Journal of Glaciology, 46(154), pp.516–530.
Zwally H J, M.A. Beckley, A.C. Brenner and M.B. Giovinetto. 2002. Motion of major ice-shelf fronts in Antarctica from slant-range analysis of radar altimeter data, 1978-98. Annals of Glaciology, 34, pp.255-262.
Zwally H.J., M.B. Giovinetto, M.A. Beckley and J.L. Saba. 2012. Antarctic and Greenland Drainage Systems. GSFC
Cryospheric Sciences Laboratory.
http://icesat4.gsfc.nasa.gov/cryo_data/ant_grn_drainage_system s.php.
The International Archives of the Photogrammetry, Remote Sensing and Spatial Information Sciences, Volume XLI-B8, 2016 XXIII ISPRS Congress, 12–19 July 2016, Prague, Czech Republic
This contribution has been peer-reviewed.